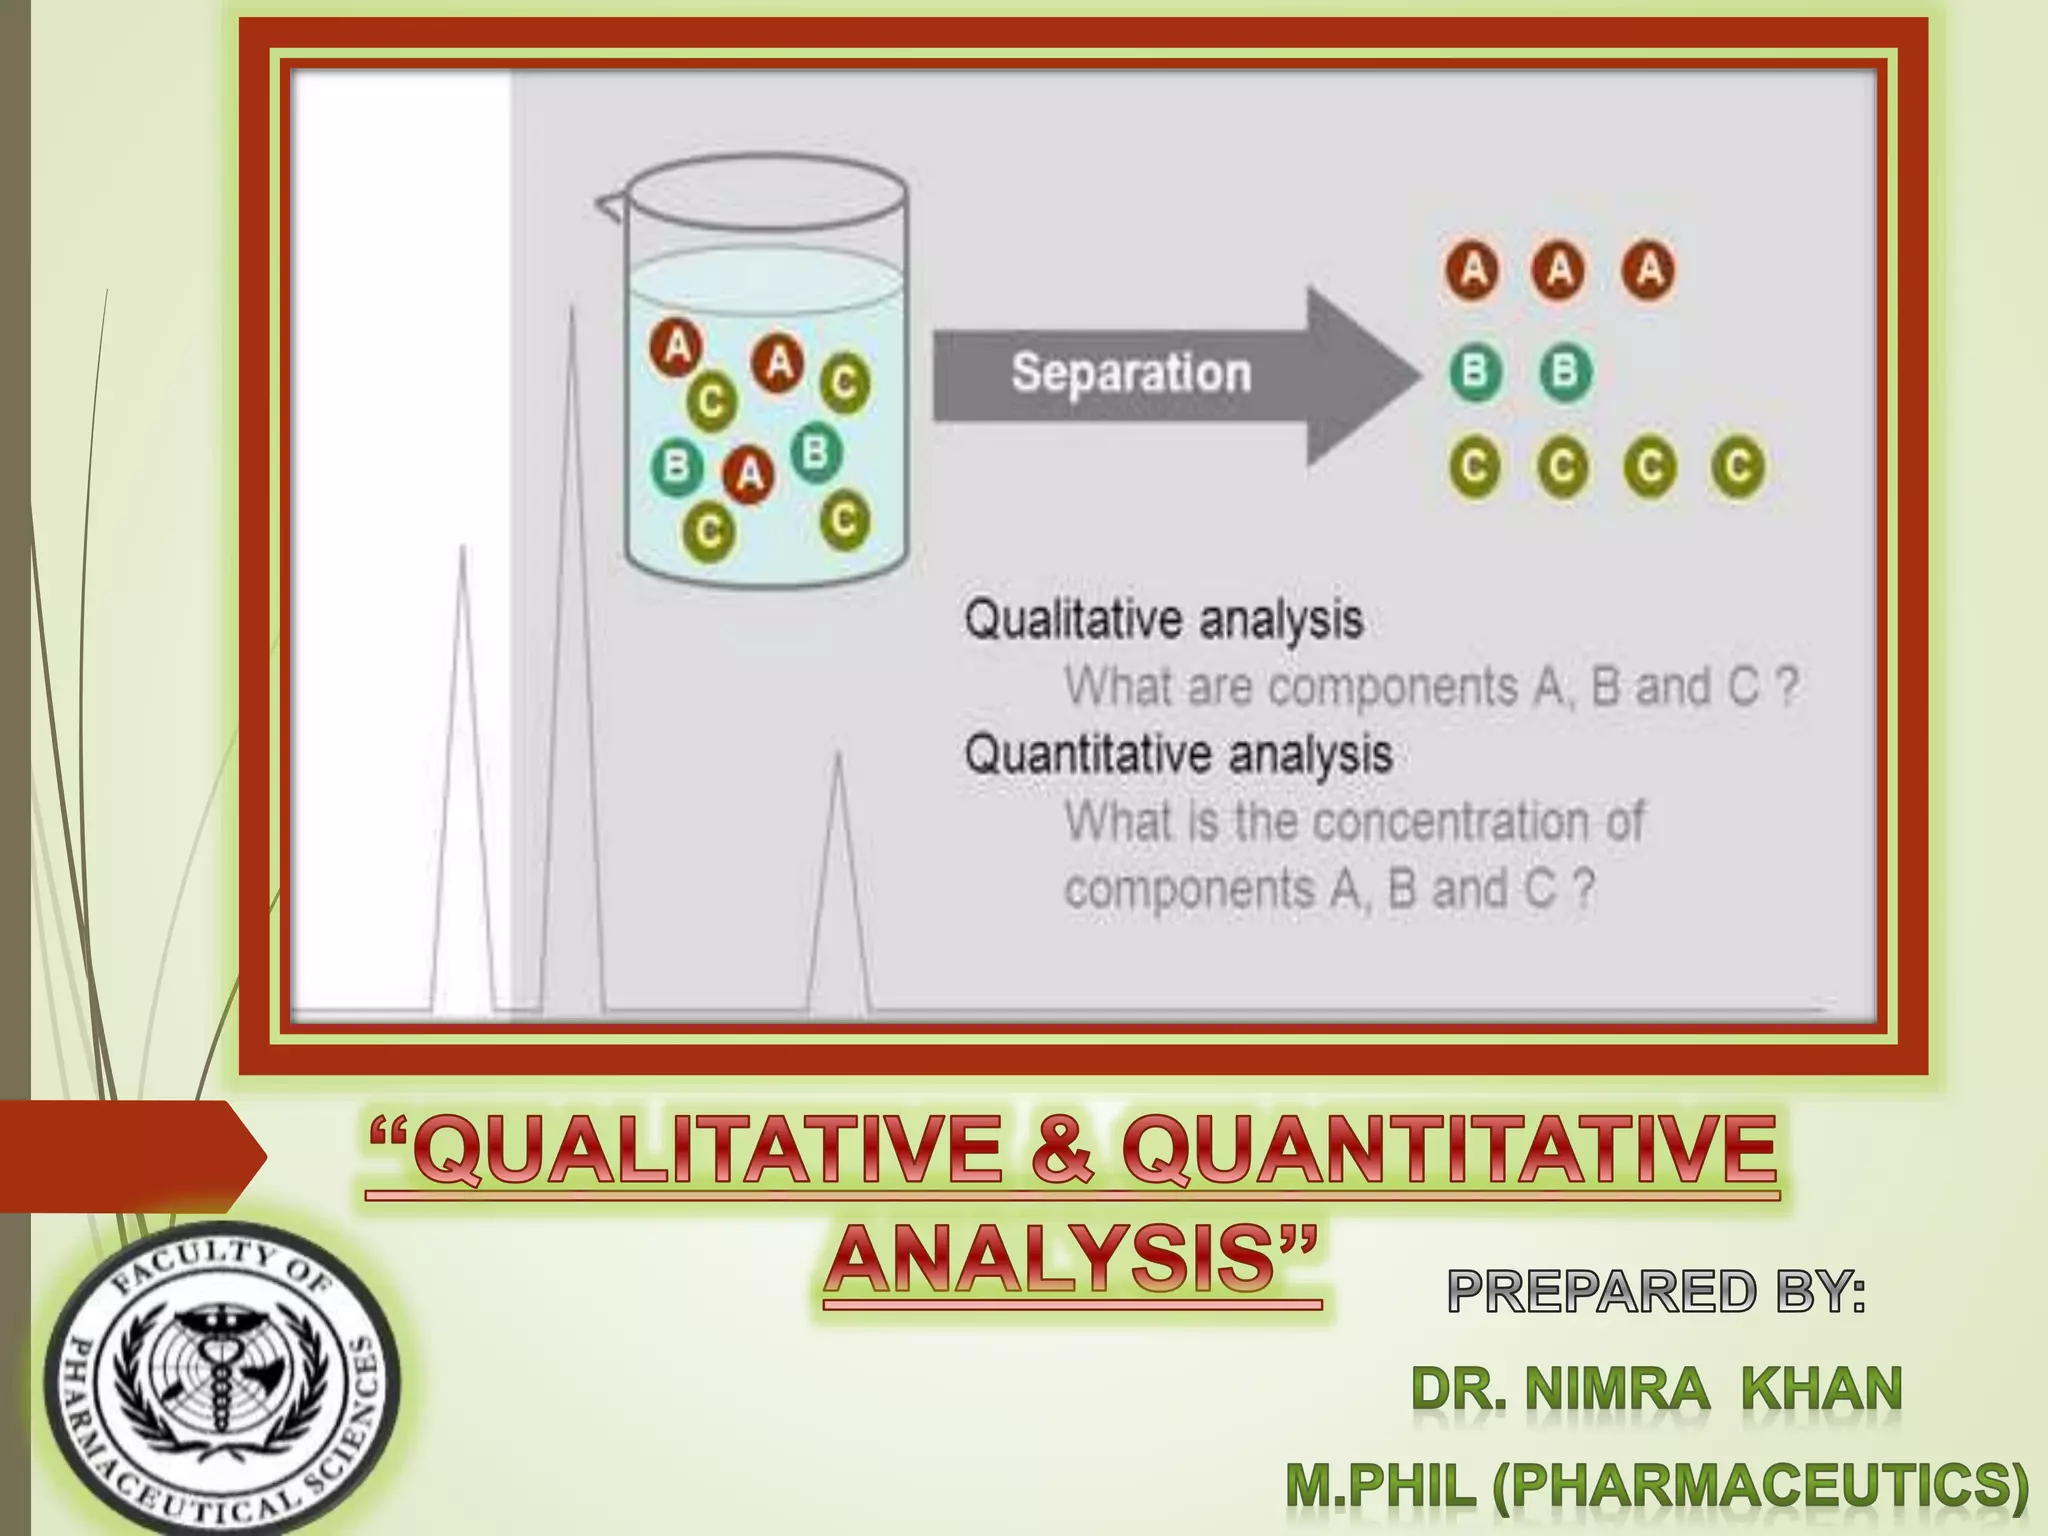
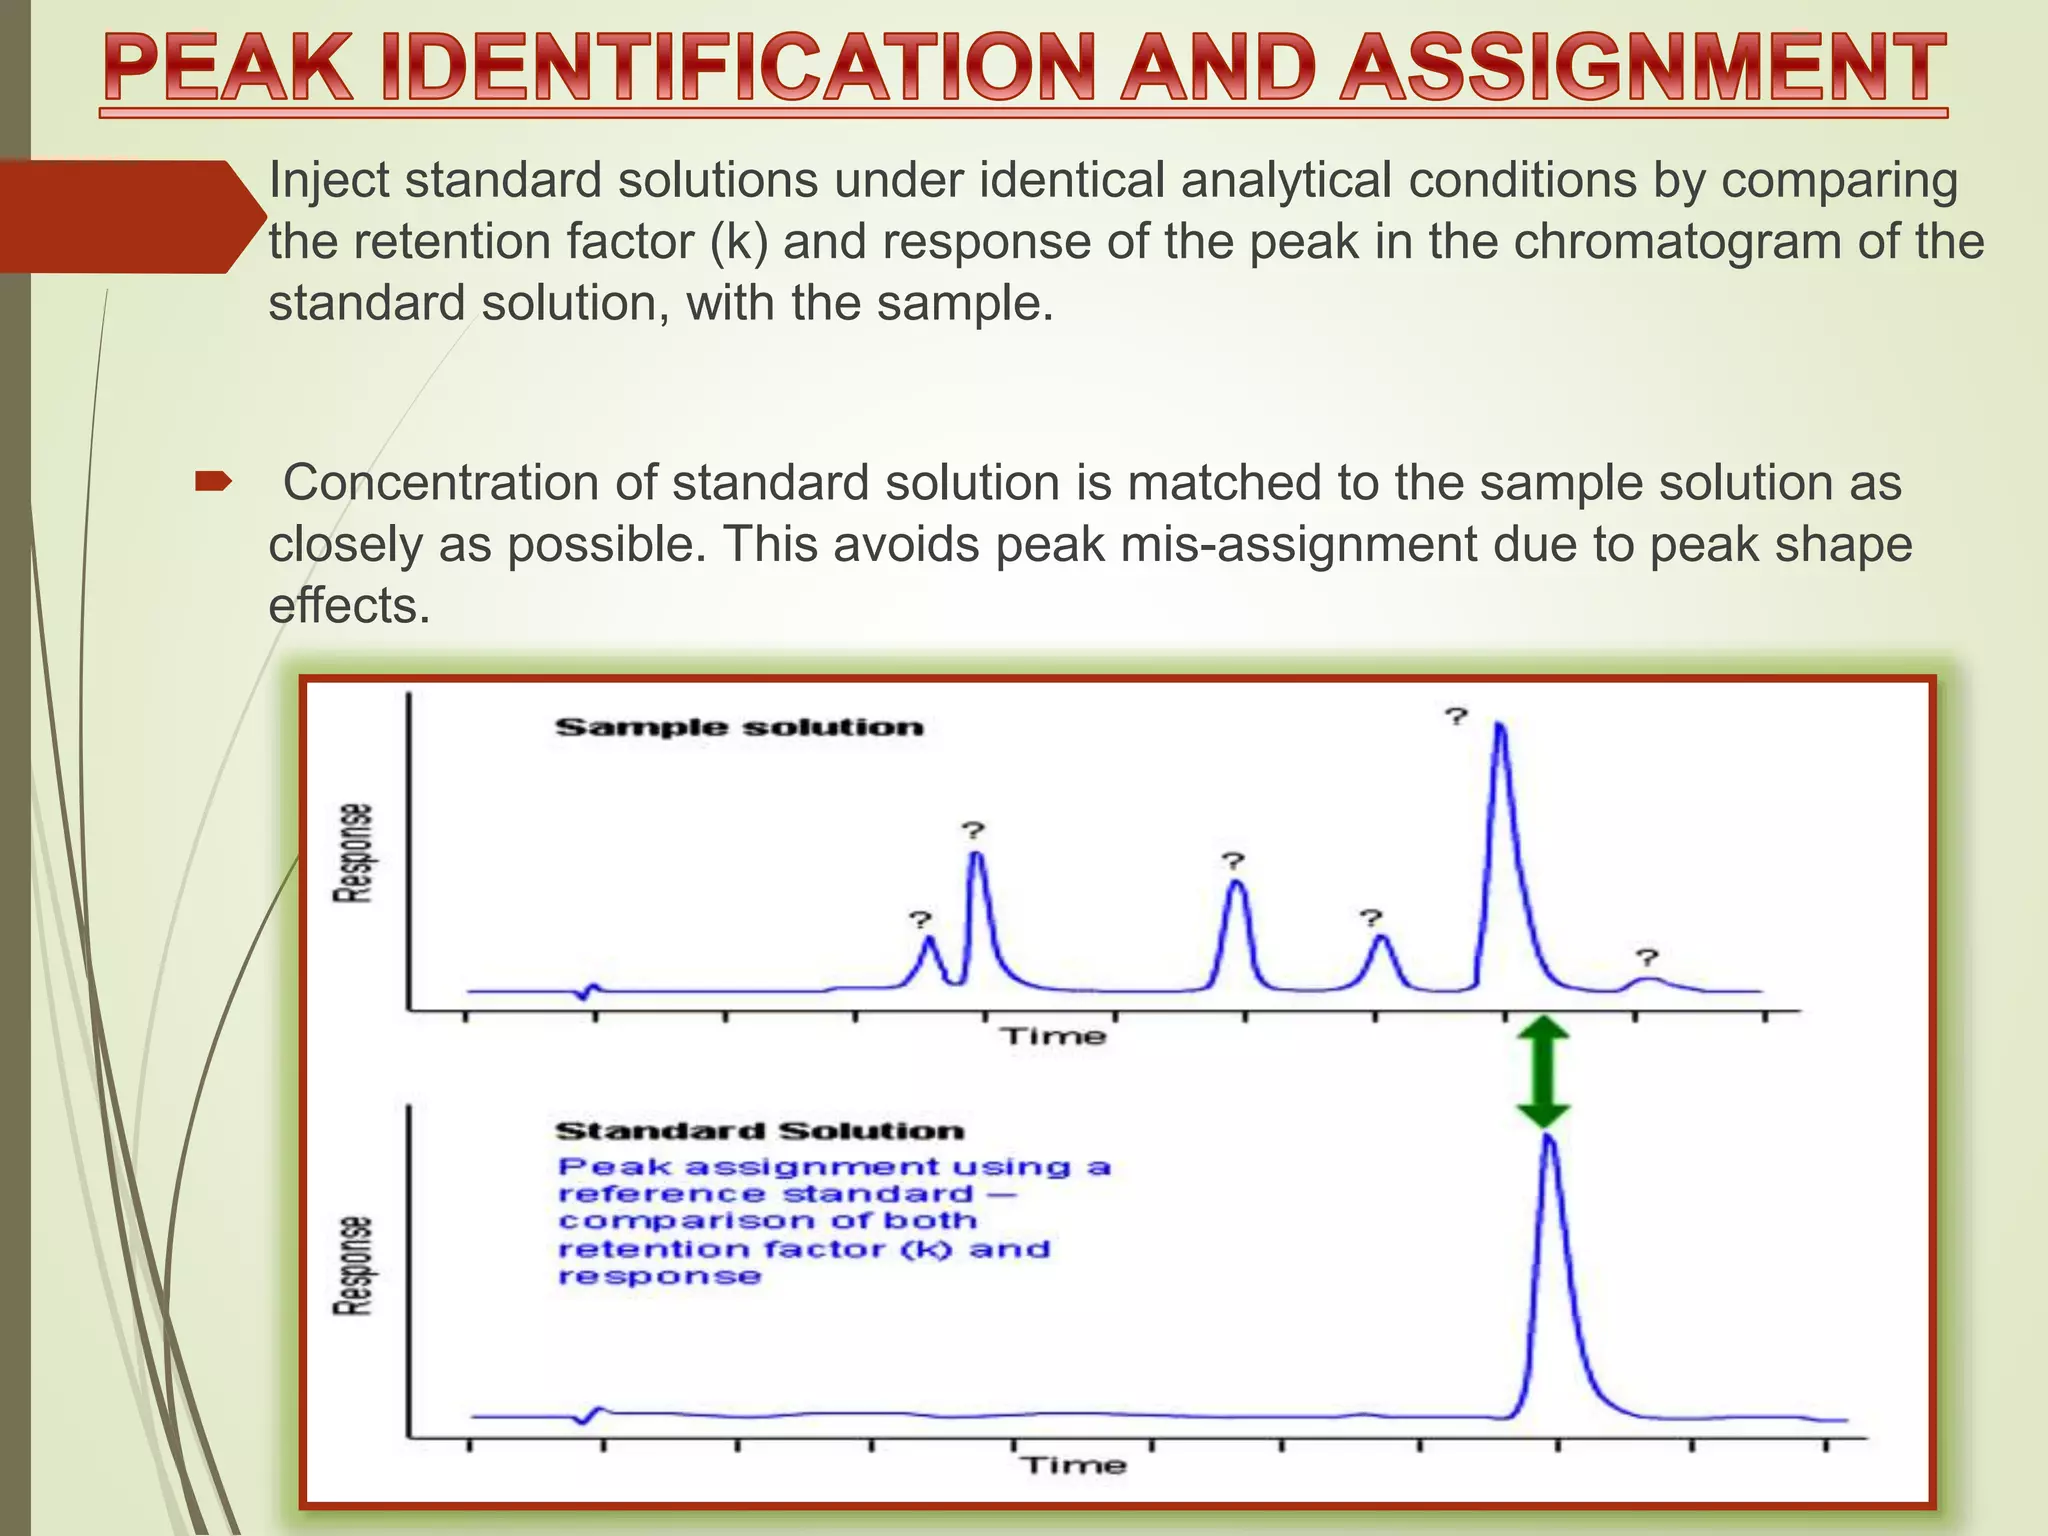
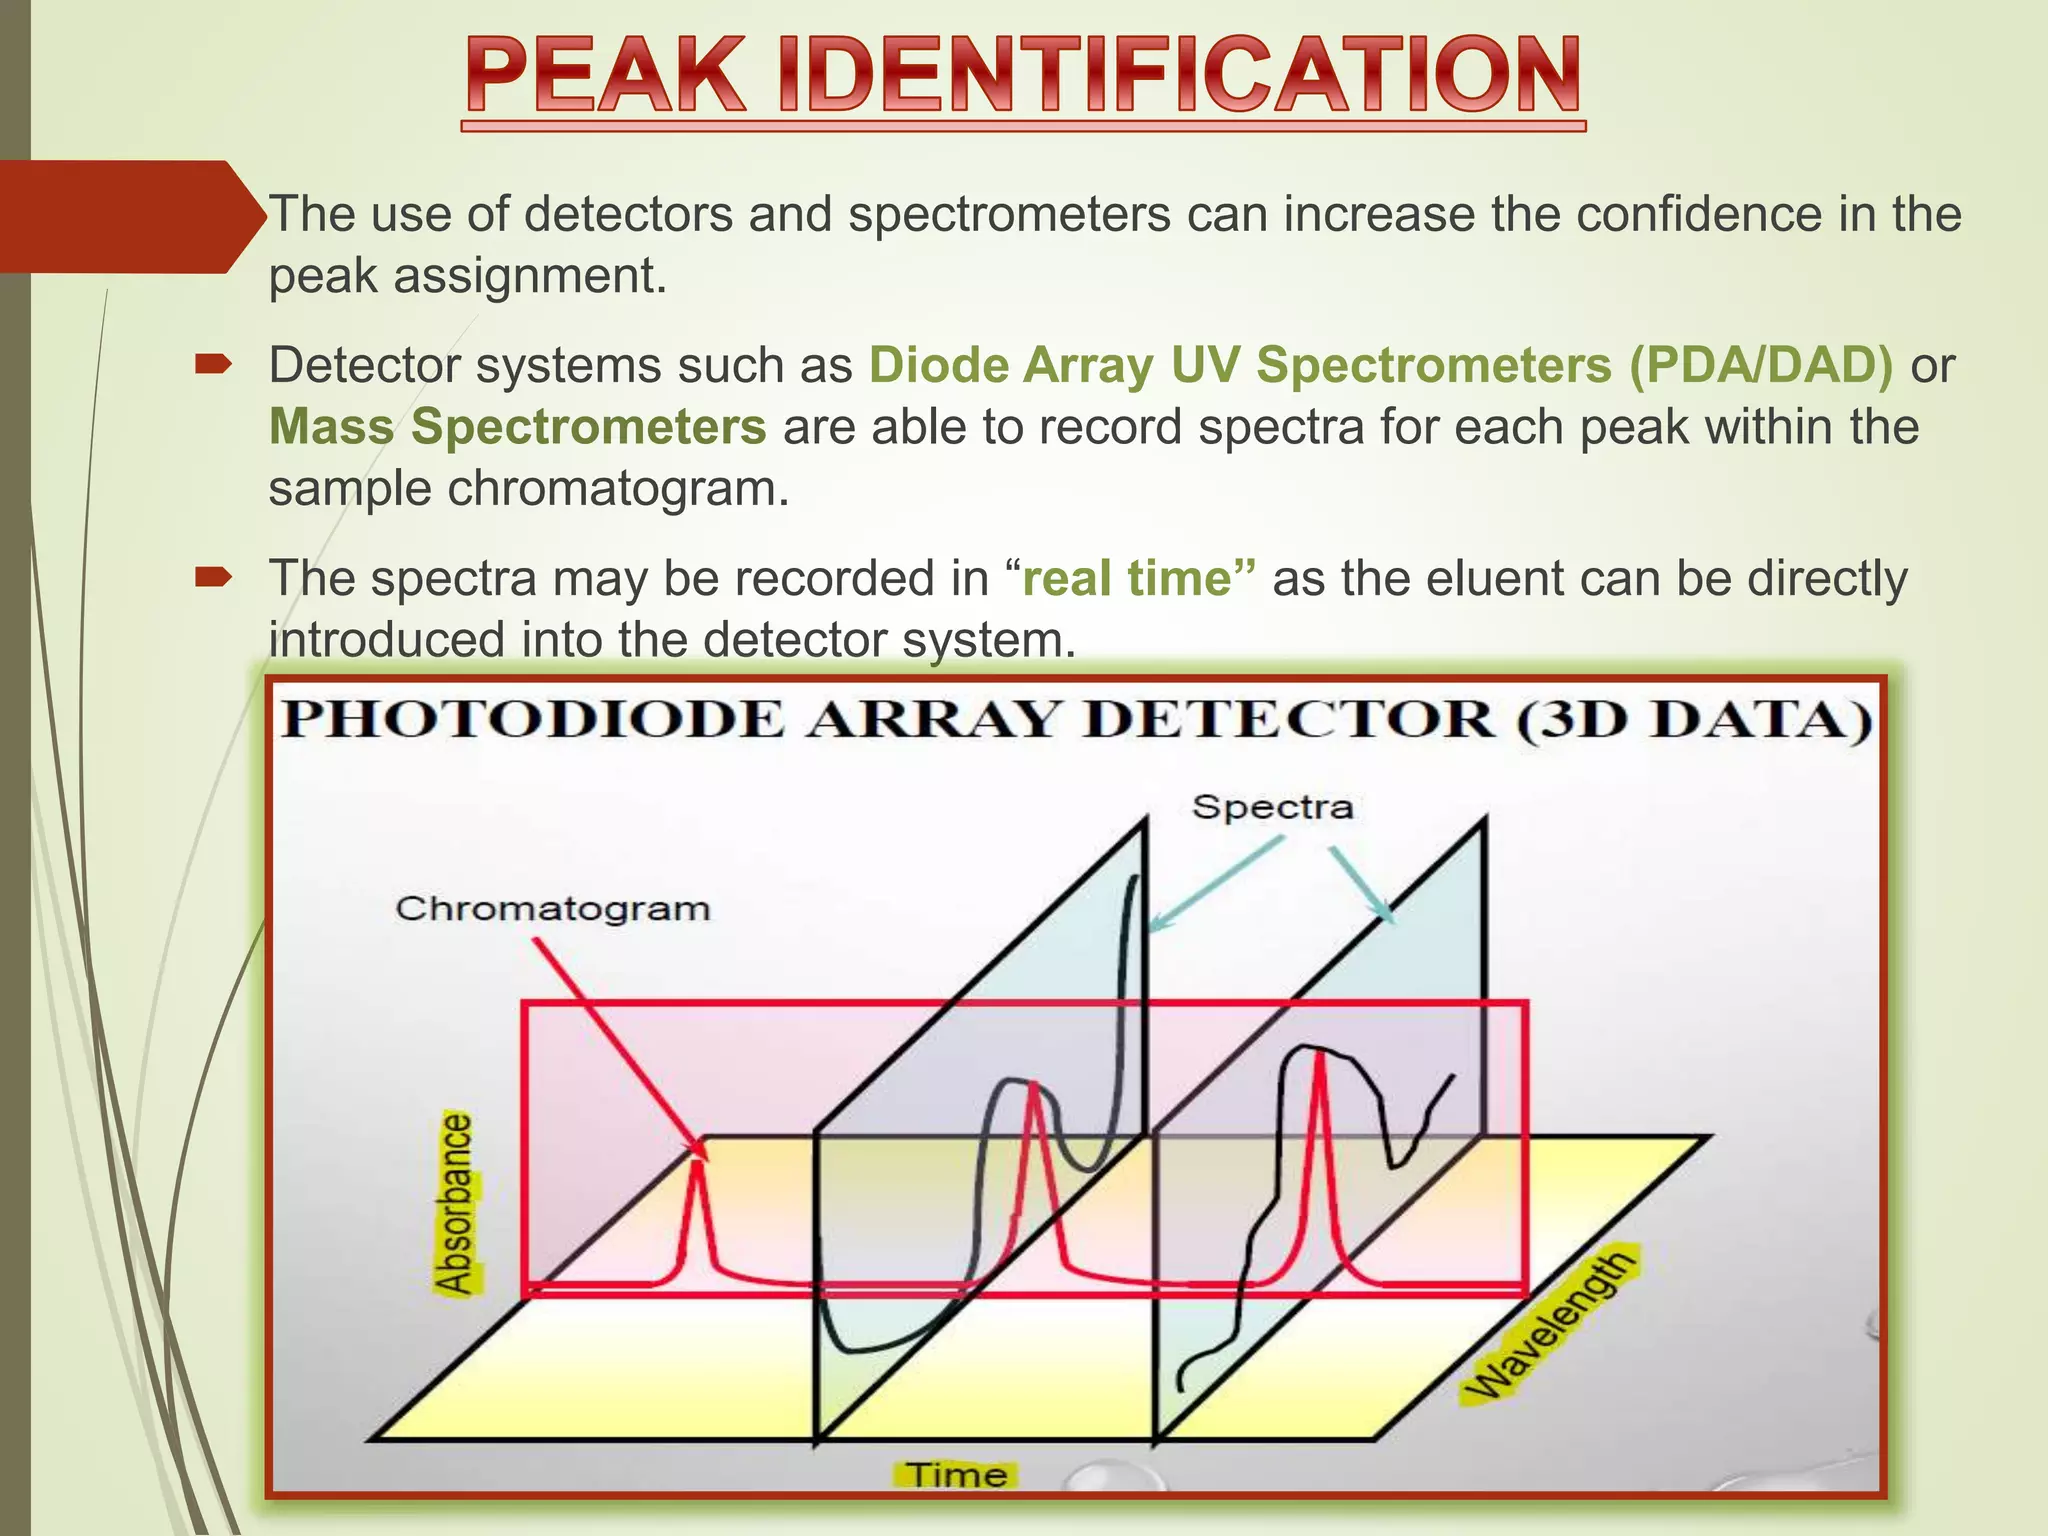
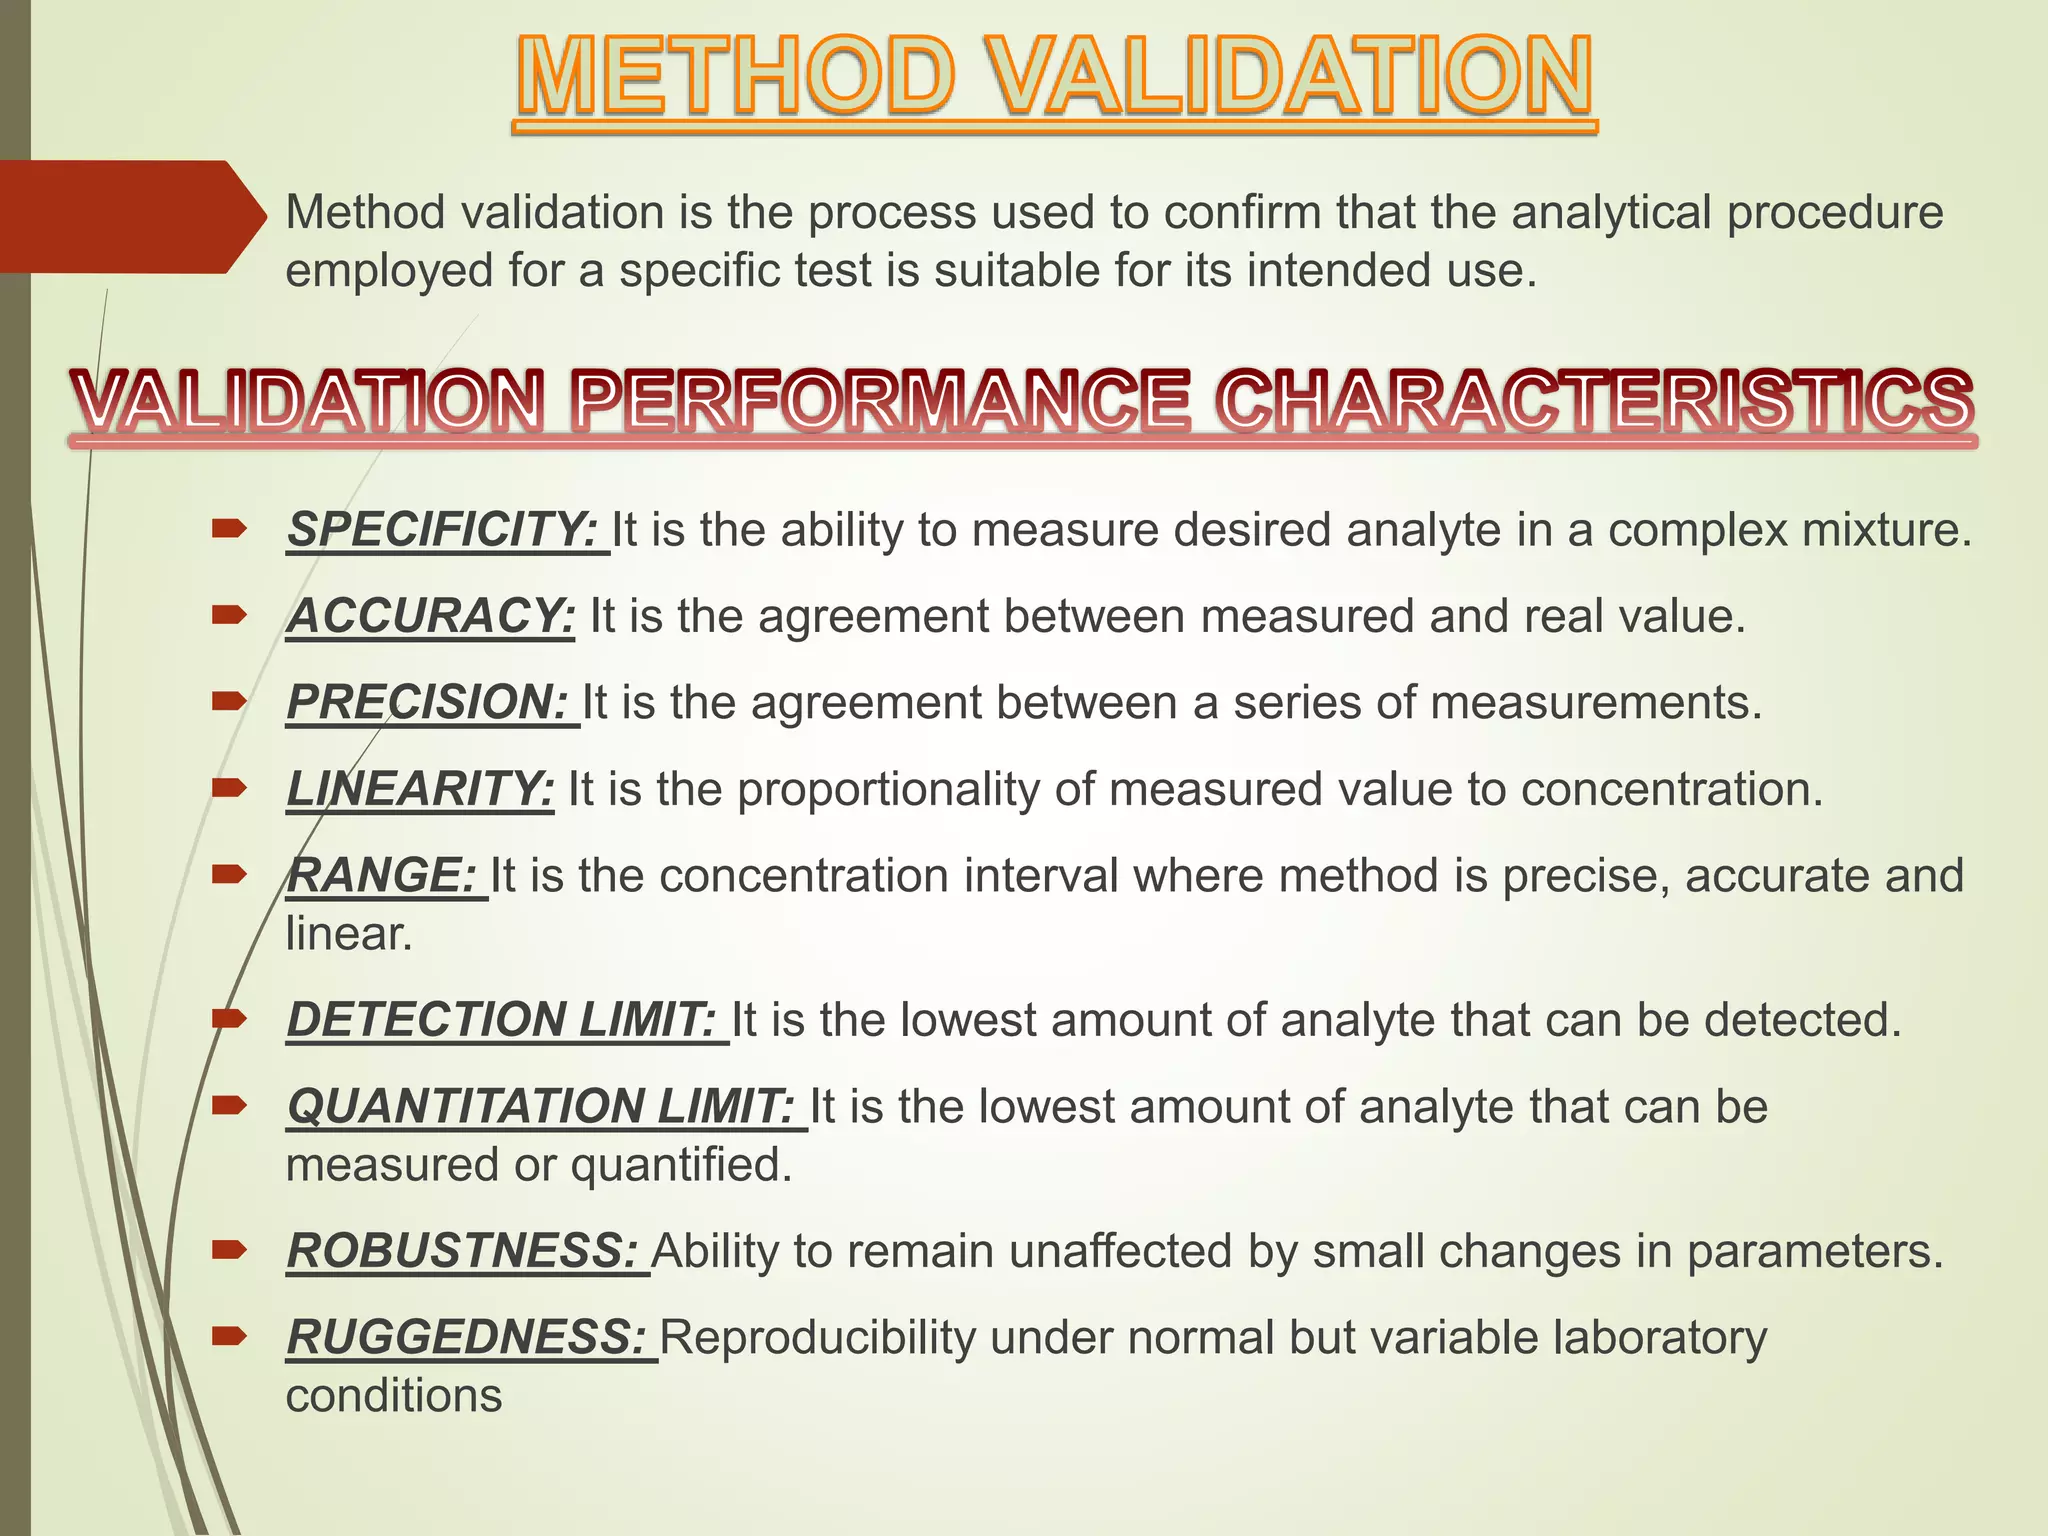
Quantitative and Qualitative analysis of HPLC and GC
1.
2. “The testing of a substance or mixture to
determine the characteristics of its
chemical constituents.”
3. Two situations exist for qualitative analysis in HPLC & GC:
The sample components are known and peaks need to be
assigned.
By injecting standards of the pure compound assign the peaks in
the chromatogram based on the retention time of the standard.
Having a selective detector, such as Fluorescence detector, which
assists in identification by producing spectra can assist in peak
assignment.
The sample is a complete unknown.
Employ detectors that can be used to aid in identification, such as
mass spectrometers.
It may also be necessary to collect the eluent for characterization
using Infra-red or Nuclear Magnetic Resonance Spectroscopy
(NMR).
4. Inject standard solutions under identical analytical conditions by comparing
the retention factor (k) and response of the peak in the chromatogram of the
standard solution, with the sample.
Concentration of standard solution is matched to the sample solution as
closely as possible. This avoids peak mis-assignment due to peak shape
effects.
5. The use of detectors and spectrometers can increase the confidence in the
peak assignment.
Detector systems such as Diode Array UV Spectrometers (PDA/DAD) or
Mass Spectrometers are able to record spectra for each peak within the
sample chromatogram.
The spectra may be recorded in “real time” as the eluent can be directly
introduced into the detector system.
6. “The technique of ‘spiking’ a sample involves the
addition of a known reference material to a
sample, in order to confirm the identity of one
of the sample component peaks.”
7. In this case, one of the peaks
in the sample is suspected to
be insulin.
The sample is spiked with
insulin at approximately the
same concentration as the
sample components.
If any of the peaks within the
chromatogram gets larger,
then that peak may be
insulin.
If a new chromatographic
peak is seen, or if any of the
peaks develops a ‘shoulder’,
then it is unlikely that any of
the peaks in the
chromatogram is due to
insulin within the sample.
8. After the peaks have been integrated and identified, the next step in the
analysis is quantification.
“Chemical analysis designed to determine the amounts or proportions
of the components of a substance”
Quantification uses peak areas or heights to determine the concentration of
a compound in the sample.
9. A quantitative analysis involves many steps that are briefly
summarized as follows:
Know the compound you are analyzing.
Establish a method for analyzing samples containing this
compound .
Analyze a sample containing a known concentration (the
Standard) of the compound to obtain the response due to that
concentration.
Analyze the sample containing an unknown concentration of the
compound to obtain the response due to the unknown
concentration.
Compare the response of the unknown concentration to the
response of the known (standard) concentration to determine how
much of the compound is present.
11. Peak area is especially useful because
HPLC peaks may be tailed. In this case,
because peak heights may vary
(although area will remain constant),
area values are more repeatable.
For trace analysis, when the peak of
interest is very small, use peak height
for calculations, this reduces the error
sustained in small changes in peak start
and end time variation.
Areas of a chromatographic peak will
change if the flow rate changes. Be
aware that poorly maintained pump
systems will have an unstable flow rate
resulting in a loss of peak area precision
(reproducibility). For this reason, always
perform routine maintenance on the
pump seals, check valves and filters.
Make certain that the pump has been
primed and dissolved gasses removed.
Both peak height and area
measurements will be irreproducible if
injection volume varies.
12. Each detector will produce a response that depends upon
the AMOUNT of analyte to which it is responding.
Some general requirements that must be met before a
quantitative analysis can be taken include:
1. Identity of the component to be analyzed should be
known.
2. Best possible separation of the component should be
achieved.
3. Standards of known purity should be available (otherwise
accuracy may be compromised).
4. If internal standards are not used, then mobile phase flow
rate and injection volume should be reproducible.
13.
14. The Area% calculation procedure reports the area of each peak in the
chromatogram as a percentage of the total area of all peaks
Height % calculation procedure reports the height of each peak in the run as
a percentage of the total height of all peaks in the run.
15.
16. The external standard (ESTD) is the basic quantification procedure in which both
calibration and unknown samples are analyzed under the same conditions.
The external standard method is the technique used most frequently to gather
quantitative information from a chromatogram. In this case, a pure reference
substance (ideally the same compound as the one to be determined in the sample)
is injected in increasing concentrations and the peak areas or peak heights
obtained are plotted versus the concentration (calibration curve). These calibration
curves should show a constant slope (linear curves), and the intercept should be as
close to zero as possible.
17. A calibration curve must be recorded for each component of interest.
The peak areas heights of the sample chromatogram are then
compared with those in the calibration curve.
CONC unknown = area unknown/ area known x conc known
18. An internal standard must
fulfill several requirements:
a) It must not already be
present in the sample.
b) It should elute close to the
peak of interest and the
two peak sizes should not
differ too much.
c) If possible, peaks should
not overlap, and no
chemical interaction the
internal standard and other
sample components should
occur.
d) The internal standard must
also have good storage
stability and be available in
high purity.
A defined amount of a chosen compound (internal standard) is
added to the sample, so that two peaks (that of the internal
standard and that of the compound of interest) must be
measured to obtain one result.
19. CONC unknown
=
Area of internal STD known /
Area of internal STD unknown
x
Area of unknown / Area of known
20. Graphical representation of
the amount and response
data for a single analyte
(compound) obtained from
one or more calibration
samples.
Curve is usually constructed
by injecting an aliquot of the
calibration (standard)
solution of known
concentration and
measuring the peak area
obtained.
21.
22. “The minimum amount of analyte that can be detected.”
LOD=3.3(STD deviation/slope)
“Lowest concentration of an analyte where identification and quantitative
measurement can be achieved.”
The term limit of quantitation is preferred to limit of determination to
differentiate it from LOD.
LOQ has been defined as 3 times the LOD (Keith, 1991).
LOQ=10(STD deviation/slope)
23. “Concentration range over which the
intensity of the signal obtained is
directly proportional to the
concentration of the species
producing the signal.”
Linear range of a detector
represents the range of
concentrations or mass flows
of a substance in the mobile
phase at the detector over which
the sensitivity of the detector is
constant within a specified
variation, usually ±5% .
The linear range of a detector
may be presented as the plot of
peak area (height) against
concentration
Numerically, expressed as ratio
of the upper limit of linearity and
the minimum detectability.
24. “
”
“Validation is an integral part of quality
assurance; it involves systematic study of
systems, facilities and processes aimed at
determining whether they perform their intended
functions adequately and consistently as
specified.”
25. Method validation is the process used to confirm that the analytical procedure
employed for a specific test is suitable for its intended use.
SPECIFICITY: It is the ability to measure desired analyte in a complex mixture.
ACCURACY: It is the agreement between measured and real value.
PRECISION: It is the agreement between a series of measurements.
LINEARITY: It is the proportionality of measured value to concentration.
RANGE: It is the concentration interval where method is precise, accurate and
linear.
DETECTION LIMIT: It is the lowest amount of analyte that can be detected.
QUANTITATION LIMIT: It is the lowest amount of analyte that can be
measured or quantified.
ROBUSTNESS: Ability to remain unaffected by small changes in parameters.
RUGGEDNESS: Reproducibility under normal but variable laboratory
conditions
26. High Performance Liquid Chromatography (HPLC) is the most widely
used of all analytical separation techniques.
It is a technique used to separate the components in a mixture , to
identify each component, and to quantify each component.
It relies on pumps to pass a pressurized liquid solvent containing the
sample mixture through a column filled with a solid adsorbent
material.
HPLC method development and validation play important role in the
discovery, development and manufacture of pharmaceutical products.
Using the available literature and previous methodology, the methods
are adopted and modified.
If no previous methods exist for the analyte in the literature, so
investigate the compounds that are similar in structure and
properties.
The most commonly used chromatographic methods are normal
phase, reverse phase and ion exchange methods.
In the selection of method for the organic compounds primarily
reverse phase method should be tried.
27. Columns being the heart of HPLC for optimum separation method.
The selection of column involves the following parameters:
* Column length * Column diameter * Column particle size *
Column particle shape
The pH of the mobile phase should not alters the pH of the sample.
Detectors are the eyes of the chromatography system and measure
the compounds after separation of the column.
It detects in a faster rate. Hence a detector is considered as a brain
of an instrument. Without the help of an detector, no one would be
able analyze any compound.