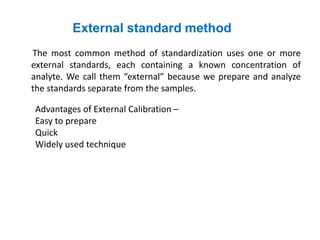
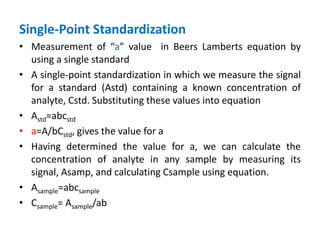
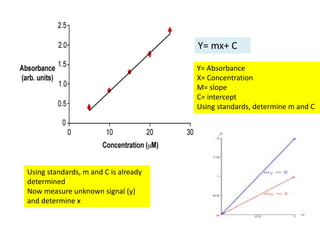
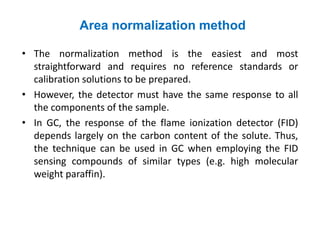
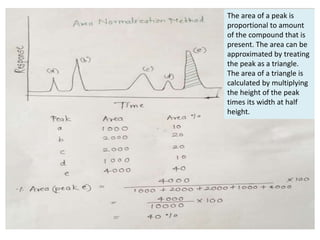
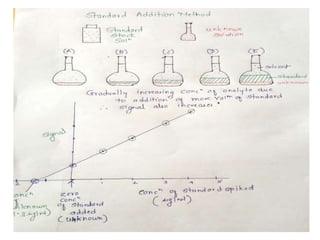
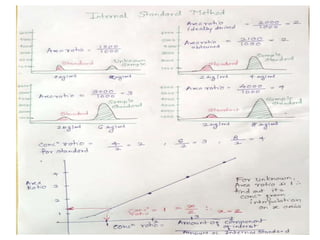
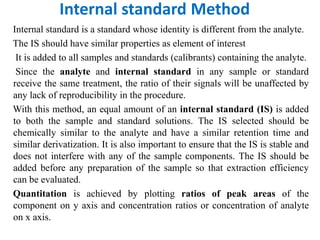
Quantitation techniques used in
Gas Chromatography/ HPLC
Dr. Vrushali S.Tambe
PES Modern College of Pharmacy (For Ladies), Moshi
Quantitative techniques involve determination of quantity
of analyte from different matrices.
Following are the quantitation techniques used in
chromatography
• Standard addition method
• External standard method
• Internal standard addition method
• Area normalisation method
External standard method
The most common method of standardization uses one or more
external standards, each containing a known concentration of
analyte. We call them “external” because we prepare and analyze
the standards separate from the samples.
Advantages of External Calibration –
Easy to prepare
Quick
Widely used technique
Single-Point Standardization
• Measurement of “a” value in Beers Lamberts equation by
using a single standard
• A single-point standardization in which we measure the signal
for a standard (Astd) containing a known concentration of
analyte, Cstd. Substituting these values into equation
• Astd=abcstd
• a=A/bCstd, gives the value for a
• Having determined the value for a, we can calculate the
concentration of analyte in any sample by measuring its
signal, Asamp, and calculating Csample using equation.
• Asample=abcsample
• Csample= Asample/ab
The standard and sample solutions are prepared in a
similar manner. Ideally, the concentration of the standard
solution should be close to that of the sample solution.
A single-point standardization is the least desirable method
Any error in our determination carries over into our
calculation of Csamp.
Our experimental value for “a” is for a single concentration of
analyte. Extending this value of a to other concentrations of
analyte requires us to assume a linear relationship between
the signal and the analyte’s concentration, an assumption that
often is not true.
Double point standardization
• Double point bracketing method is required to determine the
concentration of sample solution. The concentration of one
standard solution is greater than that of sample solution,
while other standard solution has lower concentration than
sample. The concentration of substance in sample solution is
given by equation;
• Where, Std1 refers to standard solution with high
concentration. Std2 refers to standard solution with low
concentration.
Multiple-Point Standardizations
The preferred approach to standardizing a method is to
prepare a series of standards, each containing the analyte at a
different concentration.
Standards are chosen such that they bracket the expected
range for the analyte’s concentration.
A multiple-point standardization should include at least six
standards.
A plot of Sstd (signal from standard) versus Cstd
(concentration) is known as a calibration curve.
The exact standardization, or calibration relationship is
determined by an appropriate curve-fitting algorithm.
There are advantages to multiple-point standardization.
Although a determinate error in one standard introduces a
determinate error into the analysis, its effect is minimized by
the remaining standards.
• Preparation of External Calibration Solutions
• Need to evenly space calibration concentrations
• If the highest concentration is much higher than the rest, linear
regression introduces bias favoring the high point
Y= mx+ C
Y= Absorbance
X= Concentration
M= slope
C= intercept
Using standards, determine m and C
Using standards, m and C is already
determined
Now measure unknown signal (y)
and determine x
Area normalization method
• The normalization method is the easiest and most
straightforward and requires no reference standards or
calibration solutions to be prepared.
• However, the detector must have the same response to all
the components of the sample.
• In GC, the response of the flame ionization detector (FID)
depends largely on the carbon content of the solute. Thus,
the technique can be used in GC when employing the FID
sensing compounds of similar types (e.g. high molecular
weight paraffin).
The area of a peak is
proportional to amount
of the compound that is
present. The area can be
approximated by treating
the peak as a triangle.
The area of a triangle is
calculated by multiplying
the height of the peak
times its width at half
height.
Standard addition method
If only a few samples are to be chromatographed, it is possible to employ
the method of standard addition.
This method is used in situations where sample matrix also contributes to
the analytical signal (matrix effect), thus making it impossible to compare
the analytical signal between sample and standard using the
traditional calibration curve approach.
The chromatogram of the unknown is recorded. Then a known amount of
the analyte(s) is added, and the chromatogram is repeated using the same
reagents, instrument parameters, and procedures.
From the increase in the peak area (or peak height), the original
concentration can be computed by interpolation. The detector response
must be a linear function of analyte concentration and yield no signal
(other than background) at zero concentration of the analyte.
Sufficient time must elapse between addition of the standard and actual
analysis to allow equilibrium of added standard with any matrix
interferant.
The point at zero concentration added of analyte is the reading
of the unknown, the other points are the readings after adding
increasing amounts ('spikes') of standard solution.
The absolute value of the x-intercept is the concentration of
analyte in the unknown. This negative intercept on the x-axis
corresponds to the amount of the analyte in the test sample.
This value is given by b/a, the ratio of the intercept and the
slope of the regression line.
Advantages: – Overcomes matrix differences – More precise
and accurate than external calibration
Internal standard Method
Internal standard is a standard whose identity is different from the analyte.
The IS should have similar properties as element of interest
It is added to all samples and standards (calibrants) containing the analyte.
Since the analyte and internal standard in any sample or standard
receive the same treatment, the ratio of their signals will be unaffected by
any lack of reproducibility in the procedure.
With this method, an equal amount of an internal standard (IS) is added
to both the sample and standard solutions. The IS selected should be
chemically similar to the analyte and have a similar retention time and
similar derivatization. It is also important to ensure that the IS is stable and
does not interfere with any of the sample components. The IS should be
added before any preparation of the sample so that extraction efficiency
can be evaluated.
Quantitation is achieved by plotting ratios of peak areas of the
component on y axis and concentration ratios or concentration of analyte
on x axis.
• Uncertainties in sample injection can be overcome by use of an internal standard. Any
inconsistency in injection of the sample will affect both the analyte and internal standard.
The retention times of internal standard and analyte should be different and the two peaks
must be well separated, R >1.25. The detector response factor for the analyte and the
internal standard should be the same.
• In spectroscopy, internal standards can help correct for random errors due to changes in
light source intensity. If a lamp or other light source has variable power, it will affect the
absorption and consequently, emission of a sample. However, the ratio of an internal
standard to analyte will stay constant, even if the light source does not.
• For applications with mass spectrometry as the detector, the internal standard can be an
isotopically-labeled analyte, so that the molecular weight (MW) will be different than the
analyte of interest. Internal standard corrects for drift and matrix effect.
• Drift is an indication of the loss of perfect repeatability or reproduction of a measured
value by an instrument.
• Baseline drift is the low-frequency signal variation that occurs in the baseline due to
column stationary phase bleed, background ionization, and low-frequency variations in the
detector and/or instrument-controlled parameters (such as temperature or flow).

Quantitation techniques used in chromatography

  • 1.
    Quantitation techniques usedin Gas Chromatography/ HPLC Dr. Vrushali S.Tambe PES Modern College of Pharmacy (For Ladies), Moshi
  • 2.
    Quantitative techniques involvedetermination of quantity of analyte from different matrices. Following are the quantitation techniques used in chromatography • Standard addition method • External standard method • Internal standard addition method • Area normalisation method
  • 3.
    External standard method Themost common method of standardization uses one or more external standards, each containing a known concentration of analyte. We call them “external” because we prepare and analyze the standards separate from the samples. Advantages of External Calibration – Easy to prepare Quick Widely used technique
  • 4.
    Single-Point Standardization • Measurementof “a” value in Beers Lamberts equation by using a single standard • A single-point standardization in which we measure the signal for a standard (Astd) containing a known concentration of analyte, Cstd. Substituting these values into equation • Astd=abcstd • a=A/bCstd, gives the value for a • Having determined the value for a, we can calculate the concentration of analyte in any sample by measuring its signal, Asamp, and calculating Csample using equation. • Asample=abcsample • Csample= Asample/ab
  • 5.
    The standard andsample solutions are prepared in a similar manner. Ideally, the concentration of the standard solution should be close to that of the sample solution. A single-point standardization is the least desirable method Any error in our determination carries over into our calculation of Csamp. Our experimental value for “a” is for a single concentration of analyte. Extending this value of a to other concentrations of analyte requires us to assume a linear relationship between the signal and the analyte’s concentration, an assumption that often is not true.
  • 6.
    Double point standardization •Double point bracketing method is required to determine the concentration of sample solution. The concentration of one standard solution is greater than that of sample solution, while other standard solution has lower concentration than sample. The concentration of substance in sample solution is given by equation; • Where, Std1 refers to standard solution with high concentration. Std2 refers to standard solution with low concentration.
  • 7.
    Multiple-Point Standardizations The preferredapproach to standardizing a method is to prepare a series of standards, each containing the analyte at a different concentration. Standards are chosen such that they bracket the expected range for the analyte’s concentration. A multiple-point standardization should include at least six standards. A plot of Sstd (signal from standard) versus Cstd (concentration) is known as a calibration curve. The exact standardization, or calibration relationship is determined by an appropriate curve-fitting algorithm. There are advantages to multiple-point standardization. Although a determinate error in one standard introduces a determinate error into the analysis, its effect is minimized by the remaining standards.
  • 8.
    • Preparation ofExternal Calibration Solutions • Need to evenly space calibration concentrations • If the highest concentration is much higher than the rest, linear regression introduces bias favoring the high point
  • 9.
    Y= mx+ C Y=Absorbance X= Concentration M= slope C= intercept Using standards, determine m and C Using standards, m and C is already determined Now measure unknown signal (y) and determine x
  • 10.
    Area normalization method •The normalization method is the easiest and most straightforward and requires no reference standards or calibration solutions to be prepared. • However, the detector must have the same response to all the components of the sample. • In GC, the response of the flame ionization detector (FID) depends largely on the carbon content of the solute. Thus, the technique can be used in GC when employing the FID sensing compounds of similar types (e.g. high molecular weight paraffin).
  • 11.
    The area ofa peak is proportional to amount of the compound that is present. The area can be approximated by treating the peak as a triangle. The area of a triangle is calculated by multiplying the height of the peak times its width at half height.
  • 13.
    Standard addition method Ifonly a few samples are to be chromatographed, it is possible to employ the method of standard addition. This method is used in situations where sample matrix also contributes to the analytical signal (matrix effect), thus making it impossible to compare the analytical signal between sample and standard using the traditional calibration curve approach. The chromatogram of the unknown is recorded. Then a known amount of the analyte(s) is added, and the chromatogram is repeated using the same reagents, instrument parameters, and procedures. From the increase in the peak area (or peak height), the original concentration can be computed by interpolation. The detector response must be a linear function of analyte concentration and yield no signal (other than background) at zero concentration of the analyte. Sufficient time must elapse between addition of the standard and actual analysis to allow equilibrium of added standard with any matrix interferant.
  • 14.
    The point atzero concentration added of analyte is the reading of the unknown, the other points are the readings after adding increasing amounts ('spikes') of standard solution. The absolute value of the x-intercept is the concentration of analyte in the unknown. This negative intercept on the x-axis corresponds to the amount of the analyte in the test sample. This value is given by b/a, the ratio of the intercept and the slope of the regression line. Advantages: – Overcomes matrix differences – More precise and accurate than external calibration
  • 16.
    Internal standard Method Internalstandard is a standard whose identity is different from the analyte. The IS should have similar properties as element of interest It is added to all samples and standards (calibrants) containing the analyte. Since the analyte and internal standard in any sample or standard receive the same treatment, the ratio of their signals will be unaffected by any lack of reproducibility in the procedure. With this method, an equal amount of an internal standard (IS) is added to both the sample and standard solutions. The IS selected should be chemically similar to the analyte and have a similar retention time and similar derivatization. It is also important to ensure that the IS is stable and does not interfere with any of the sample components. The IS should be added before any preparation of the sample so that extraction efficiency can be evaluated. Quantitation is achieved by plotting ratios of peak areas of the component on y axis and concentration ratios or concentration of analyte on x axis.
  • 17.
    • Uncertainties insample injection can be overcome by use of an internal standard. Any inconsistency in injection of the sample will affect both the analyte and internal standard. The retention times of internal standard and analyte should be different and the two peaks must be well separated, R >1.25. The detector response factor for the analyte and the internal standard should be the same. • In spectroscopy, internal standards can help correct for random errors due to changes in light source intensity. If a lamp or other light source has variable power, it will affect the absorption and consequently, emission of a sample. However, the ratio of an internal standard to analyte will stay constant, even if the light source does not. • For applications with mass spectrometry as the detector, the internal standard can be an isotopically-labeled analyte, so that the molecular weight (MW) will be different than the analyte of interest. Internal standard corrects for drift and matrix effect. • Drift is an indication of the loss of perfect repeatability or reproduction of a measured value by an instrument. • Baseline drift is the low-frequency signal variation that occurs in the baseline due to column stationary phase bleed, background ionization, and low-frequency variations in the detector and/or instrument-controlled parameters (such as temperature or flow).