Downloaded 77 times


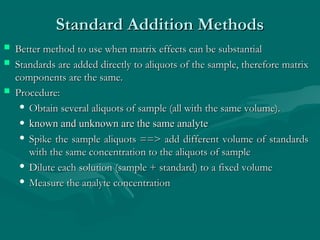
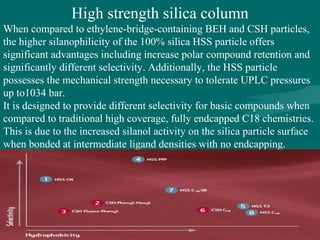
![51
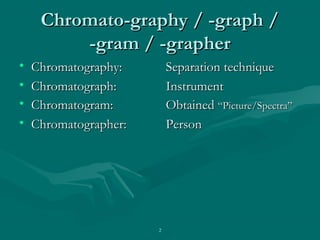
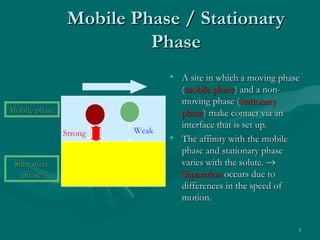
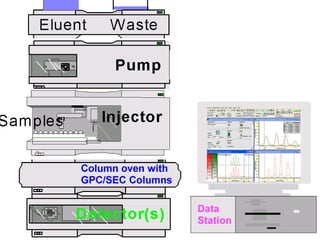
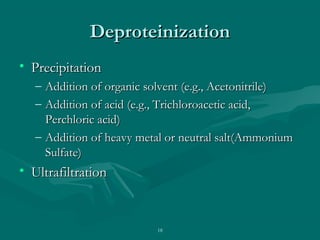
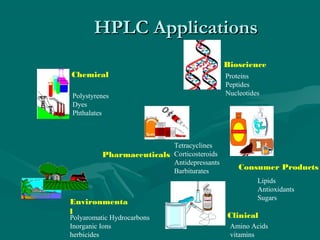
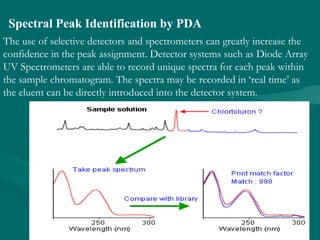
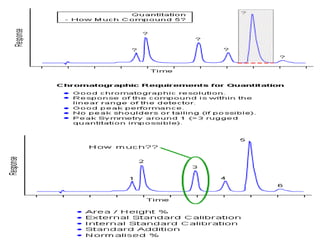
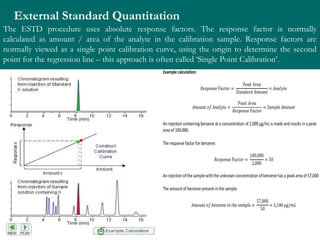
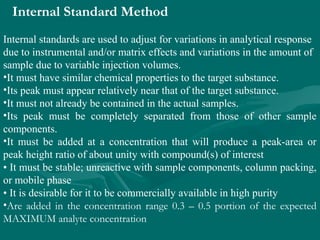
The value of glucose in the original sample is found by determiningThe value of glucose in the original sample is found by determining
the x-intercept by extrapolation, i.e.,the x-intercept by extrapolation, i.e., finding the value of x when y = 0.finding the value of x when y = 0.
Or by using the values shown by the Linear Fit and the form of theOr by using the values shown by the Linear Fit and the form of the
linear equationlinear equation
y = mx + by = mx + b
0 = 0.006580 = 0.00658xx + 0.229+ 0.229
Solving for x,Solving for x,
xx = -0.229/0.00658 == -0.229/0.00658 = - 34.8- 34.8 µµg.g.
The amount of glucose in unknown glucose sample, that had noThe amount of glucose in unknown glucose sample, that had no
standard glucose was added, isstandard glucose was added, is 34.8034.80 µµg.g.
Since the volume was 50.0Since the volume was 50.0 µµL, the [Glucose] = 34.8L, the [Glucose] = 34.8 µµg / 50g / 50 µµL orL or
11 µµg/g/µµL. This could also be expressed as [Glucose] = 0.696 mg/mLL. This could also be expressed as [Glucose] = 0.696 mg/mL](https://image.slidesharecdn.com/drsumanpresentation-150406040908-conversion-gate01/85/HPLC-APPLICATION-RECENT-DEVELOPMENT-STATIONARY-PHASE-MATERIAL-Dr-suman-presentation-51-320.jpg)

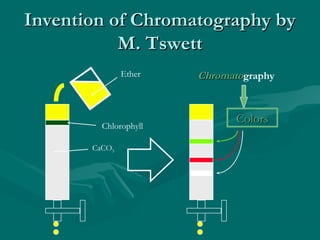
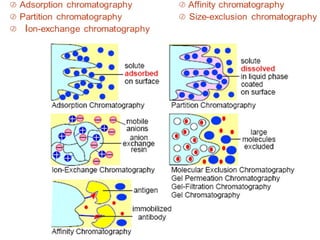
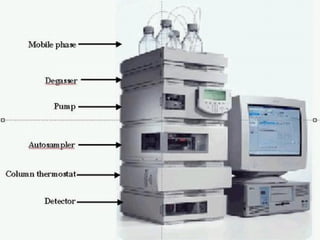
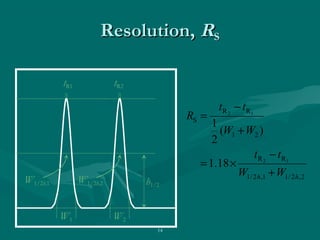
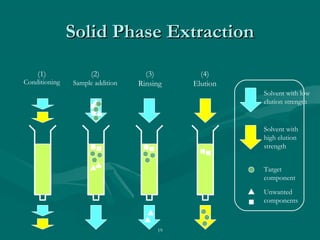
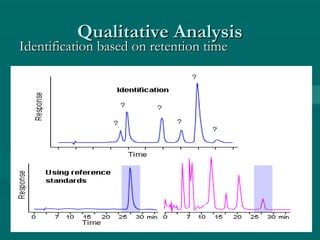
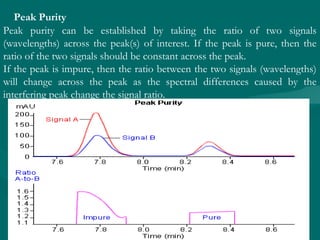
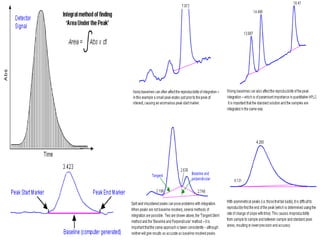
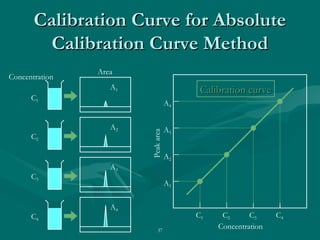
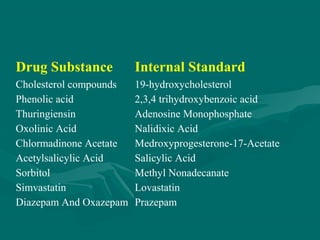
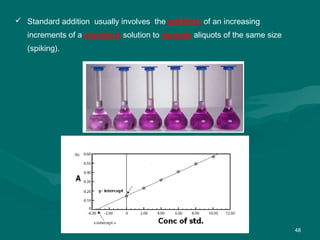
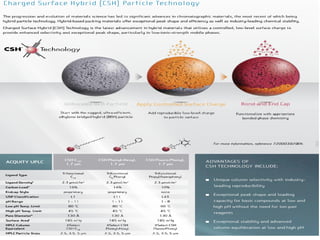
![New generation of organo-silane material incorporates ethylene bridges into porous silica.
Tetraethoxysilane + Bis(tetraethoxysilyl)ethane = Polyethoxysilane.
• Provide pH stability from 1-12
• Five times more durability than earlier hybrids.
•The homogenous surface offers some steric selectivity.
Ethylene Bridged Hybrid [BEH] HPLC Column.](https://image.slidesharecdn.com/drsumanpresentation-150406040908-conversion-gate01/85/HPLC-APPLICATION-RECENT-DEVELOPMENT-STATIONARY-PHASE-MATERIAL-Dr-suman-presentation-55-320.jpg)
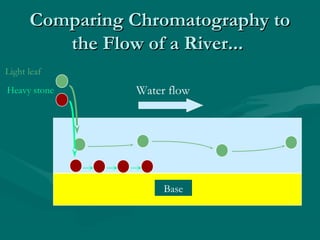
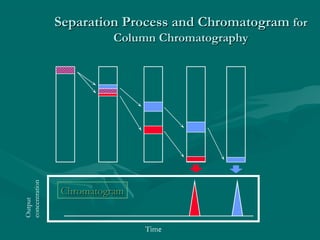
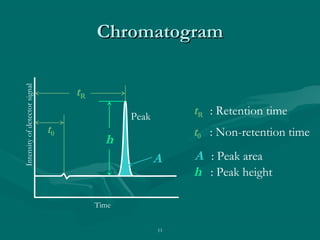
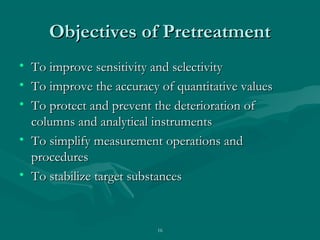
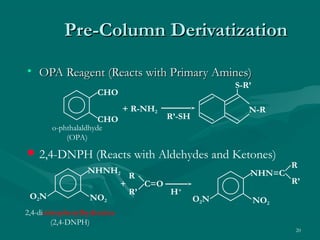
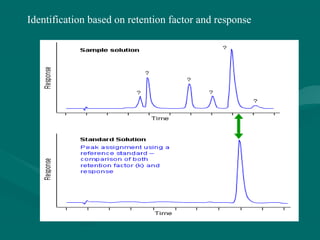
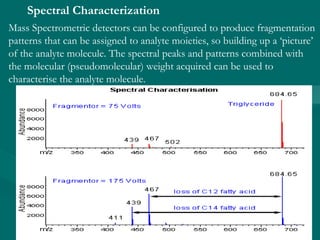
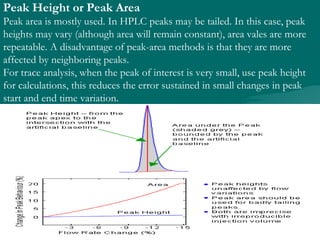
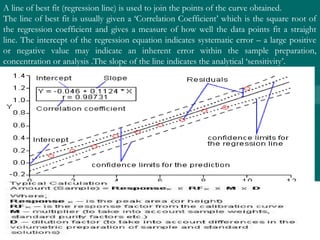
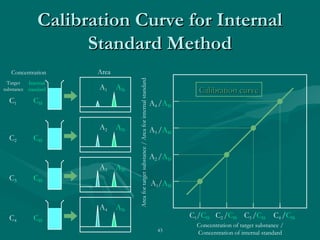
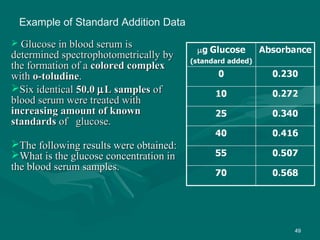
![Ethylene Bridged Hybrid [BEH] HPLC Column.
BEH C18 BEH ShieldRP18 BEH C8 BEH Phenyl BEH
HILIC
BEH Amide
Ligand
Type
Trifunctonal
C18
Monofunctional
Embedded Polar
Trifunctional
C8
Trifunctional
Phenyl-Hexyl
Unbonded
BEH
Particle
Trifunctional
Carbamoyl
Ligand
Density
3.1μmol/m2
3.3μmol/m2
3.2μmol/m2
3.0μmol/m2
n/a 7.5 μmol/m2
Carbon
Load
18% 17% 13% 15% Unbonded 12%
Endcap
Style
Proprietary TMS Proprietary Proprietary N/A None
pH Range 1-12 2-11 1-12 1-12 1-9 1-11
Temp.Limit 60 o
C 45o
C 60 o
C 60 o
C 45 o
C 90 o
C
Pore
Diameter
130AO
130AO
130AO
130AO
130AO
130AO
Surface
Area
185m2
/g 185m2
/g 185m2
/g 185m2
/g 185m2
/g 185m2
/g
Particle
Sizes
1.7,2.5,3.5,5
μm
1.7,2.5,3.5,5μm 1.7,2.5,3.5,5μ
m
1.7,2.5,3.5,5μ
m
1.7,2.5,3.5
,5μm
1.7,2.5,3.5,5
μm](https://image.slidesharecdn.com/drsumanpresentation-150406040908-conversion-gate01/85/HPLC-APPLICATION-RECENT-DEVELOPMENT-STATIONARY-PHASE-MATERIAL-Dr-suman-presentation-56-320.jpg)
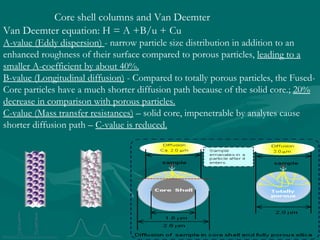
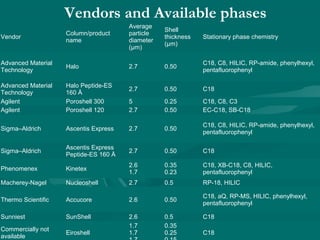
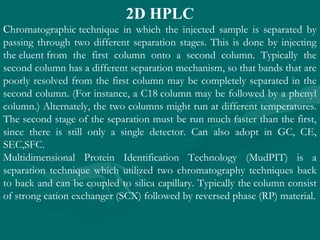
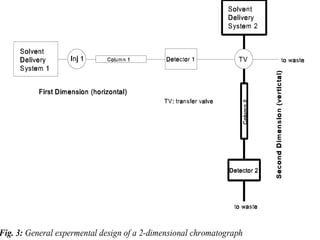


The document provides an overview of chromatography, detailing its principles and applications, including separation techniques, the role of mobile and stationary phases, and various methodologies for sample preparation and analysis. It addresses the importance of pretreatment processes, qualitative and quantitative analysis techniques, as well as calibration methods to ensure accurate results. Additionally, it discusses advancements in chromatography column materials and the significance of internal standard methods to mitigate effects of impurities in samples.


![APPLICATIONS OF GAS CHROMATOGRAPHY [APPLICATIONS OF GC] BY Prof. Dr. P.RAVISA...](https://cdn.slidesharecdn.com/ss_thumbnails/appicationsofgc-prs-130615130914-phpapp01-thumbnail.jpg?width=640&height=640&fit=bounds)


![谷歌留痕技术 [ 𝙩𝙤𝙥 𝟮𝟯𝟯. 𝙘 𝙤𝙢 ]](https://cdn.slidesharecdn.com/ss_thumbnails/top233-260130174328-3833018c-thumbnail.jpg?width=640&height=640&fit=bounds)


