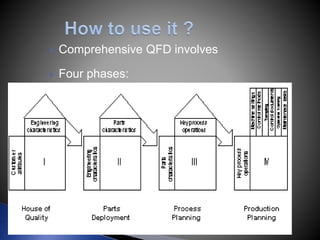
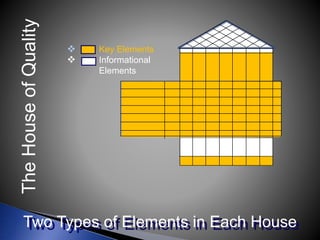
 At the conclusion of this class – You will have a
thorough understanding of:
1. What is QFD?
2. Why it is important?
3. When it is used?
4. How it is used?
5. Understand the function of a QFD Team
6. Realize the Benefits of QFD
7. The Voice of The Customer
8. Organization of information
9. The House of Quality
10. QFD Process
 Yoji Akao, a Japanese planning specialist,
conceptualized QFD in the 1960’s
Dr. Shigeru Mizuno, Professor Emeritus of
the Tokyo Institute of Technology is credited
with initiated the quality function deployment
system
Statistical Quality Control, SQC, was the central
quality control activity after WWII.
 SQC is an effective method of monitoring process
using control charts.
SQC became Total Quality Control, TQC.
QFD was derived from TQC.
 1966, Bridgestone Tire Corp first used a process
assurance table.
 1972, the process assurance table was retooled
by Akao to include QFD process.
 1972, Kobe Shipyards (of Mitsubishi Heavy
Industry) began a QFD Oil Tanker project.
 1978, Kobe Shipyards published their quality
chart for the tanker.
 QFD spread rapidly in North America during the 1980’s
 The Automobile industry and Manufacturing began
heavy use of QFD at this time.
 QFD symposiums (North American, Japanese,
European, International) were set up to explore research
relating to QFD techniques.
 The QFD institute was formed in 1994.
 Quality Function Deployment is a comprehensive quality
design method that:
 Seeks out spoken and unspoken customer needs
from fuzzy Voice of the Customer verbatim;
 Uncovers "positive" quality that wows the customer;
 Translates these into designs characteristics and
deliverable actions; and
 Builds and delivers a quality product or service by
focusing the various business functions toward
achieving a common goal—customer satisfaction.
 Quality Function Deployment, QFD, is a quality
technique which evaluates the ideas of key
stakeholders to produce a product which better
addresses the customers needs.
 Customer requirements are gathered into a
visual document which is evaluated and
remodeled during construction so the important
requirements stand out as the end result.
 The link between
 Customer
 Design Engineer
 Competitors
 Manufacturing
 Provide Insight
 Into the whole design & manufacturing operation
 From concept to manufacture (cradle to the grave)
 Can improve efficiency
 A systematic way of documenting and breaking down
customer needs into manageable and actionable detail.
 A planning methodology that organizes relevant
information to facilitate better decision making.
 A way of reducing the uncertainty involved in product
and process design.
 A technique that promotes cross-functional teamwork.
 A methodology that gets the right people together, early,
to work efficiently and effectively to meet customers’
needs.
Key Thought
Throughout
Quality Function Deployment is a
Valuable Decision Support Tool, But
it is Not a Decision Maker
WHAT DOES QFD DO?
 Better Designs in Half the Time!
CUSTOMERCONCEPT
Benefits
“Traditional Timeline”
Plan Design Redesign Manufacture
QFD is a Productivity Enhancer
 QFD provides the opportunity to make sure you
have a good product before you try to design
and implement it.
 It is about planning and problem prevention, not
problem solving .
 QFD provides a systematic approach to identify
which requirements are a priority for whom,
when to implement them, and why.
 QFD is very powerful because it
incorporates the voice of customer in the
design
Resulting in :
 A better product design
 A satisfied customer
 Insight into the design/manufacture
operation
 Improved problem solving and efficiency
in production
 Ask these important questions
◦ Why do QFD?
◦ What is the goal?
◦ What should its make-up be?
◦ Is QFD the right tool ?
◦ Is this the right time?
◦ Is this the right place to implement?
◦ What is success?
◦ Who all should be involved?
 Poor communications and expectations get lost in the
complexity of product development.
 Lack of structure or logic to the allocation of product
development resources.
 Lack of efficient and / or effective product / process
development teamwork.
 Extended development time caused by excessive
redesign, problem solving, or putting out fires.
QFD Team
1. Its function in deployment
2. Two Types of Teams
New product design
Improving an existing design
3. Cross functional
 Marketing, design, quality, finance and
production
 Comprehensive QFD involves
 Four phases:
Quality Function Deployment’s
House of Quality
Customer
Perceptions
Relationships
between
Customer Needs
and
Design Attributes
ImportanceRankings
Customer
Needs
Design
Attributes
Costs/Feasibility
Engineering Measures
Correlation
Matrix
1
The House
of Quality
 Establishes the Flowdown
 Relates WHAT'S & HOW'S
 Ranks The Importance
2
3
6
5
4
7
8
Two Types of Elements in Each House
 Key Elements
 Informational
Elements
TheHouseofQuality
QFD Flowdown
Customer Wants
Technical Requirements
Part Characteristics
Manufacturing Process
Production Requirements
Manufacturing
Environment
Customer Wants
Product Functionality
System Characteristics
Design Alternatives
Software
Environment
Customer Wants
Service Requirements
Service Processes
Process Controls
Service
Environment
Flowdown Relates The Houses To Each Other
LevelsOfGranularity
Building the House of Quality
1. Identify Customer Attributes
2. Identify Design Attributes / Requirements
3. Relate the customer attributes to the design
attributes.
4. Conduct an Evaluation of Competing Products.
5. Evaluate Design Attributes and Develop Targets.
6. Determine which Design Attributes to Deploy in the
Remainder of the Process.
1. Identify Customer Attributes
 These are product or service requirements IN THE
CUSTOMER’S TERMS.
 Market Research;
 Surveys;
 Focus Groups.
 “What does the customer expect from the product?”
 “Why does the customer buy the product?”
 Salespeople and Technicians can be important sources of
information – both in terms of these two questions and in
terms of product failure and repair.
 OFTEN THESE ARE EXPANDED INTO Secondary and
Tertiary Needs / Requirements.
Lagging Leading
Solicited
Quantitative
Structured
Unsolicited
Qualitative
Random
Trade visits
Customer visits
Consultants
Sales force
Training programs
Conventions
Trade journals
Trade shows
Vendor
Supplier
Academic
Employees
Focus groups
Complaint reports
Organization standards
Government regulations
Lawsuits
Hot lines
Surveys
Customer tests
Trade trials
Prefered costumers
OM testing
Product purchase survey
Customer audits
2. Identify Design Attributes.
 Design Attributes are Expressed in the Language of the
Designer / Engineer and Represent the TECHNICAL
Characteristics (Attributes) that must be Deployed
throughout the DESIGN, MANUFACTURING, and
SERVICE PROCESSES.
 These must be MEASURABLE since the Output will be
Controlled and Compared to Objective Targets.
 The ROOF of the HOUSE OF QUALITY shows,
symbolically, the Interrelationships between Design
Attributes.
3.Relating Customer & Design Attributes
 Symbolically we determine whether there is NO relationship, a WEAK one,
MODERATE one, or STRONG relationship between each Customer Attribute and
each Design Attribute.
 The PURPOSE it to determine whether the final Design Attributes adequately
cover Customer Attributes.
 LACK of a strong relationship between A customer attribute and any design
attribute shows that the attribute is not adequately addressed or that the final
product will have difficulty in meeting the expressed customer need.
 Similarly, if a design attribute DOES NOT affect any customer attribute, then it
may be redundant or the designers may have missed some important customer
attribute.
4. Add Market Evaluation & Key Selling Points
 This step includes identifying importance ratings for each
customer attribute AND evaluating existing products /
services for each of the attributes.
 Customer importance ratings represent the areas of
greatest interest and highest expectations AS EXPRESSED
BY THE CUSTOMER.
 Competitive evaluation helps to highlight the absolute
strengths and weaknesses in competing products.
 This step enables designers to seek opportunities for
improvement and links QFD to a company’s strategic vision
and allows priorities to be set in the design process.
5. Evaluate Design Attributes of Competitive
Products & Set Targets.
 This is USUALLY accomplished through in-house testing and
then translated into MEASURABLE TERMS.
 The evaluations are compared with the competitive evaluation of
customer attributes to determine inconsistency between
customer evaluations and technical evaluations.
 For example, if a competing product is found to best satisfy a
customer attribute, but the evaluation of the related design
attribute indicates otherwise, then EITHER the measures used
are faulty, OR else the product has an image difference that is
affecting customer perceptions.
 On the basis of customer importance ratings and existing product
strengths and weaknesses, TARGETS and DIRECTIONS for
each design attribute are set.
6. Select Design Attributes to be Deployed in the
Remainder of the Process
 This means identifying the design attributes that:
 have a strong relationship to customer needs,
 have poor competitive performance,
 or are strong selling points.
 These attributes will need to be DEPLOYED or
TRANSLATED into the language of each function in
the design and production process so that proper
actions and controls are taken to ensure that the voice
of the customer is maintained.
 Those attributes not identified as critical do not need
such rigorous attention.
Using the House of Quality
The voice of the customer MUST be carried THROUGHOUT
the production process.
Three other “houses of quality” are used to do this and,
together with the first, these carry the customer’s voice from
its initial expression, through design attributes, on to
component attributes, to process operations, and eventually
to a quality control and improvement plans.
In Japan, all four are used.
The tendency in the West is to use only the first one or two.
Customer
Attributes
Design Attributes
1
2
3
4
Design
Attributes Component Attributes
Component
Attributes
Process Operations
Quality Control Plan
The How’s at One Level Become the
What’s at the Next Level
 Voice of the customer (VOC)
“The efforts to investigate and analyze the customer. With QFD, VOC
data is reduce into a set of critical customer needs using techniques
such as affinity, diagrams, function analysis, etc, defined and
documented in customer needs data dictionary, and prioritized. This
VOC effort is also the opportunity to recognize unfulfilled needs that
can be provided at minimum, competitive advantage and potentially, a
break-through product or true value innovation”
The Cascading Voice of the Customer
NOTES:
“Design Attributes” are also called “Functional Requirements”
“Component Attributes” are also called “Part Characteristics”
“Process Operations” are also called “Manufacturing Processes” and
the “Quality Control Plan” refers to “Key Process Variables.
Critical to Quality
Characteristics
(CTQs)
Key Manufacturing
Processes
Key Process Variables
X
Y
Improves customer
satisfaction
Reduces implementation
time
Promotes team work
Provides documentation
Improves
customer
satisfaction
Reduces
implementation
time
Promotes
teamwork
Provides
documentation
•Creates focus on customer requirements
•Uses competitive information effectively
•Prioritizes resources
•Identifies items that can be acted upon
•Structures resident experience/information
•Decreases midstream design changes
•Limits post introduction problems
•Avoids future development redundancies
•Identifies future application opportunities
•Surfaces missing assumptions
•Based on consensus
•Creates communication at interfaces
•Identifies actions at interfaces
•Creates global view out of details
•Documents rational for design
•Is easy to assimilate
•Adds structure to the information
•Adapts to changes (living document)
•Provides framework for sensitivity analysis
 QFD On Everything
Set the “Right” Granularity
Don’t Apply To Every Last Project
 Inadequate Priorities
 Lack of Teamwork
Wrong Participants
Lack of Team Skills
Lack of Support or Commitment
 Too Much “Chart Focus”
 “Hurry up and Get Done”
 Failure to Integrate and Implement QFD
CommonQFDPitfalls
 The process may look simple, but requires effort.
 Many entries look obvious—after they’re written down.
 If there are NO “tough spots” the first time: It Probably Isn’t
Being Done Right!!!!
 Focus on the end-user customer.
 Charts are not the objective. Charts are the means for
achieving the objective.
 Find reasons to succeed, not excuses for failure.
 Remember to follow-up afterward
Points to Remember

Quality function development

  • 2.
     At theconclusion of this class – You will have a thorough understanding of: 1. What is QFD? 2. Why it is important? 3. When it is used? 4. How it is used? 5. Understand the function of a QFD Team 6. Realize the Benefits of QFD 7. The Voice of The Customer 8. Organization of information 9. The House of Quality 10. QFD Process
  • 3.
     Yoji Akao,a Japanese planning specialist, conceptualized QFD in the 1960’s Dr. Shigeru Mizuno, Professor Emeritus of the Tokyo Institute of Technology is credited with initiated the quality function deployment system
  • 4.
    Statistical Quality Control,SQC, was the central quality control activity after WWII.  SQC is an effective method of monitoring process using control charts. SQC became Total Quality Control, TQC. QFD was derived from TQC.
  • 5.
     1966, BridgestoneTire Corp first used a process assurance table.  1972, the process assurance table was retooled by Akao to include QFD process.  1972, Kobe Shipyards (of Mitsubishi Heavy Industry) began a QFD Oil Tanker project.  1978, Kobe Shipyards published their quality chart for the tanker.
  • 6.
     QFD spreadrapidly in North America during the 1980’s  The Automobile industry and Manufacturing began heavy use of QFD at this time.  QFD symposiums (North American, Japanese, European, International) were set up to explore research relating to QFD techniques.  The QFD institute was formed in 1994.
  • 7.
     Quality FunctionDeployment is a comprehensive quality design method that:  Seeks out spoken and unspoken customer needs from fuzzy Voice of the Customer verbatim;  Uncovers "positive" quality that wows the customer;  Translates these into designs characteristics and deliverable actions; and  Builds and delivers a quality product or service by focusing the various business functions toward achieving a common goal—customer satisfaction.
  • 8.
     Quality FunctionDeployment, QFD, is a quality technique which evaluates the ideas of key stakeholders to produce a product which better addresses the customers needs.  Customer requirements are gathered into a visual document which is evaluated and remodeled during construction so the important requirements stand out as the end result.
  • 9.
     The linkbetween  Customer  Design Engineer  Competitors  Manufacturing  Provide Insight  Into the whole design & manufacturing operation  From concept to manufacture (cradle to the grave)  Can improve efficiency
  • 10.
     A systematicway of documenting and breaking down customer needs into manageable and actionable detail.  A planning methodology that organizes relevant information to facilitate better decision making.  A way of reducing the uncertainty involved in product and process design.  A technique that promotes cross-functional teamwork.  A methodology that gets the right people together, early, to work efficiently and effectively to meet customers’ needs.
  • 11.
    Key Thought Throughout Quality FunctionDeployment is a Valuable Decision Support Tool, But it is Not a Decision Maker
  • 12.
    WHAT DOES QFDDO?  Better Designs in Half the Time! CUSTOMERCONCEPT Benefits “Traditional Timeline” Plan Design Redesign Manufacture Plan Design Redesign Manufacture QFD is a Productivity Enhancer
  • 13.
     QFD providesthe opportunity to make sure you have a good product before you try to design and implement it.  It is about planning and problem prevention, not problem solving .  QFD provides a systematic approach to identify which requirements are a priority for whom, when to implement them, and why.
  • 14.
     QFD isvery powerful because it incorporates the voice of customer in the design Resulting in :  A better product design  A satisfied customer  Insight into the design/manufacture operation  Improved problem solving and efficiency in production
  • 15.
     Ask theseimportant questions ◦ Why do QFD? ◦ What is the goal? ◦ What should its make-up be? ◦ Is QFD the right tool ? ◦ Is this the right time? ◦ Is this the right place to implement? ◦ What is success? ◦ Who all should be involved?
  • 16.
     Poor communicationsand expectations get lost in the complexity of product development.  Lack of structure or logic to the allocation of product development resources.  Lack of efficient and / or effective product / process development teamwork.  Extended development time caused by excessive redesign, problem solving, or putting out fires.
  • 17.
    QFD Team 1. Itsfunction in deployment 2. Two Types of Teams New product design Improving an existing design 3. Cross functional  Marketing, design, quality, finance and production
  • 18.
     Comprehensive QFDinvolves  Four phases:
  • 19.
    Quality Function Deployment’s Houseof Quality Customer Perceptions Relationships between Customer Needs and Design Attributes ImportanceRankings Customer Needs Design Attributes Costs/Feasibility Engineering Measures Correlation Matrix 1 The House of Quality  Establishes the Flowdown  Relates WHAT'S & HOW'S  Ranks The Importance 2 3 6 5 4 7 8
  • 20.
    Two Types ofElements in Each House  Key Elements  Informational Elements TheHouseofQuality
  • 21.
    QFD Flowdown Customer Wants TechnicalRequirements Part Characteristics Manufacturing Process Production Requirements Manufacturing Environment Customer Wants Product Functionality System Characteristics Design Alternatives Software Environment Customer Wants Service Requirements Service Processes Process Controls Service Environment Flowdown Relates The Houses To Each Other LevelsOfGranularity
  • 22.
    Building the Houseof Quality 1. Identify Customer Attributes 2. Identify Design Attributes / Requirements 3. Relate the customer attributes to the design attributes. 4. Conduct an Evaluation of Competing Products. 5. Evaluate Design Attributes and Develop Targets. 6. Determine which Design Attributes to Deploy in the Remainder of the Process.
  • 23.
    1. Identify CustomerAttributes  These are product or service requirements IN THE CUSTOMER’S TERMS.  Market Research;  Surveys;  Focus Groups.  “What does the customer expect from the product?”  “Why does the customer buy the product?”  Salespeople and Technicians can be important sources of information – both in terms of these two questions and in terms of product failure and repair.  OFTEN THESE ARE EXPANDED INTO Secondary and Tertiary Needs / Requirements.
  • 24.
    Lagging Leading Solicited Quantitative Structured Unsolicited Qualitative Random Trade visits Customervisits Consultants Sales force Training programs Conventions Trade journals Trade shows Vendor Supplier Academic Employees Focus groups Complaint reports Organization standards Government regulations Lawsuits Hot lines Surveys Customer tests Trade trials Prefered costumers OM testing Product purchase survey Customer audits
  • 25.
    2. Identify DesignAttributes.  Design Attributes are Expressed in the Language of the Designer / Engineer and Represent the TECHNICAL Characteristics (Attributes) that must be Deployed throughout the DESIGN, MANUFACTURING, and SERVICE PROCESSES.  These must be MEASURABLE since the Output will be Controlled and Compared to Objective Targets.  The ROOF of the HOUSE OF QUALITY shows, symbolically, the Interrelationships between Design Attributes.
  • 26.
    3.Relating Customer &Design Attributes  Symbolically we determine whether there is NO relationship, a WEAK one, MODERATE one, or STRONG relationship between each Customer Attribute and each Design Attribute.  The PURPOSE it to determine whether the final Design Attributes adequately cover Customer Attributes.  LACK of a strong relationship between A customer attribute and any design attribute shows that the attribute is not adequately addressed or that the final product will have difficulty in meeting the expressed customer need.  Similarly, if a design attribute DOES NOT affect any customer attribute, then it may be redundant or the designers may have missed some important customer attribute.
  • 27.
    4. Add MarketEvaluation & Key Selling Points  This step includes identifying importance ratings for each customer attribute AND evaluating existing products / services for each of the attributes.  Customer importance ratings represent the areas of greatest interest and highest expectations AS EXPRESSED BY THE CUSTOMER.  Competitive evaluation helps to highlight the absolute strengths and weaknesses in competing products.  This step enables designers to seek opportunities for improvement and links QFD to a company’s strategic vision and allows priorities to be set in the design process.
  • 28.
    5. Evaluate DesignAttributes of Competitive Products & Set Targets.  This is USUALLY accomplished through in-house testing and then translated into MEASURABLE TERMS.  The evaluations are compared with the competitive evaluation of customer attributes to determine inconsistency between customer evaluations and technical evaluations.  For example, if a competing product is found to best satisfy a customer attribute, but the evaluation of the related design attribute indicates otherwise, then EITHER the measures used are faulty, OR else the product has an image difference that is affecting customer perceptions.  On the basis of customer importance ratings and existing product strengths and weaknesses, TARGETS and DIRECTIONS for each design attribute are set.
  • 29.
    6. Select DesignAttributes to be Deployed in the Remainder of the Process  This means identifying the design attributes that:  have a strong relationship to customer needs,  have poor competitive performance,  or are strong selling points.  These attributes will need to be DEPLOYED or TRANSLATED into the language of each function in the design and production process so that proper actions and controls are taken to ensure that the voice of the customer is maintained.  Those attributes not identified as critical do not need such rigorous attention.
  • 30.
    Using the Houseof Quality The voice of the customer MUST be carried THROUGHOUT the production process. Three other “houses of quality” are used to do this and, together with the first, these carry the customer’s voice from its initial expression, through design attributes, on to component attributes, to process operations, and eventually to a quality control and improvement plans. In Japan, all four are used. The tendency in the West is to use only the first one or two.
  • 31.
    Customer Attributes Design Attributes 1 2 3 4 Design Attributes ComponentAttributes Component Attributes Process Operations Quality Control Plan The How’s at One Level Become the What’s at the Next Level
  • 32.
     Voice ofthe customer (VOC) “The efforts to investigate and analyze the customer. With QFD, VOC data is reduce into a set of critical customer needs using techniques such as affinity, diagrams, function analysis, etc, defined and documented in customer needs data dictionary, and prioritized. This VOC effort is also the opportunity to recognize unfulfilled needs that can be provided at minimum, competitive advantage and potentially, a break-through product or true value innovation”
  • 33.
    The Cascading Voiceof the Customer NOTES: “Design Attributes” are also called “Functional Requirements” “Component Attributes” are also called “Part Characteristics” “Process Operations” are also called “Manufacturing Processes” and the “Quality Control Plan” refers to “Key Process Variables. Critical to Quality Characteristics (CTQs) Key Manufacturing Processes Key Process Variables X Y
  • 34.
  • 35.
    Improves customer satisfaction Reduces implementation time Promotes teamwork Provides documentation •Creates focus oncustomer requirements •Uses competitive information effectively •Prioritizes resources •Identifies items that can be acted upon •Structures resident experience/information •Decreases midstream design changes •Limits post introduction problems •Avoids future development redundancies •Identifies future application opportunities •Surfaces missing assumptions •Based on consensus •Creates communication at interfaces •Identifies actions at interfaces •Creates global view out of details •Documents rational for design •Is easy to assimilate •Adds structure to the information •Adapts to changes (living document) •Provides framework for sensitivity analysis
  • 36.
     QFD OnEverything Set the “Right” Granularity Don’t Apply To Every Last Project  Inadequate Priorities  Lack of Teamwork Wrong Participants Lack of Team Skills Lack of Support or Commitment  Too Much “Chart Focus”  “Hurry up and Get Done”  Failure to Integrate and Implement QFD CommonQFDPitfalls
  • 37.
     The processmay look simple, but requires effort.  Many entries look obvious—after they’re written down.  If there are NO “tough spots” the first time: It Probably Isn’t Being Done Right!!!!  Focus on the end-user customer.  Charts are not the objective. Charts are the means for achieving the objective.  Find reasons to succeed, not excuses for failure.  Remember to follow-up afterward Points to Remember

Editor's Notes

  • #5 Control Charts enable the use of objective criteria for distinguishing background variation from events of significance based on statistical techniques.
  • #13 The main benefits of QFD are: Improved Customer Satisfaction Reduced Development Time Improved Internal Communications Better Documentation of Key Issues Save Money Some additional benefits are: Improved morale, organizational harmony Improved efficiency Reduction in design changes Increased competitiveness High market acceptance Problems are easier to identify
  • #16 Its important that Organizations ask themselves these types of questions when considering QFD of a new or enhance product. Leadership is also important.
  • #18 Management and team member must be committed to the amount of time involved Priorities need to be defined and communicated to all departments The scope of the project must be clearly defined as well And the most important tool of the QFD process is communication
  • #19 “Quality function deployment is a process of listening to the ‘voice of the customer,’ identifying the customer’s needs, and incorporating those needs in the design and production of goods and services” [Madu, 1999]. This quote emphasizes the role of QFD in the entire production scheme, not just at the beginning. QFD is NOT equal to the House of Quality! We will, however, focus on the House of Quality since it is most relevant to requirements engineering. But as a take-away message, be remindful of the fact that QFD revises the design and production stages of product and service delivery. Note how the “hows” from one phase become the “whats” of the subsequent phase. Think of these phases as more iterative than waterfall. The House of Quality (HOQ) – The HOQ is a blueprint for product development [Madu, 1999]. It’s called a “house” because of it’s physical appearance. Note that the HOQ goes by the name “quality chart” outside of North America [Akao, 1997]. Customer requirements, technical requirements, requirements prioritization, design targets, all merge onto the HOQ through a multi-step process. The HOQ is the focus of section 3 in this presentation.
  • #25 Quality book
  • #36 Quality Book The main benefits of QFD are: Improved Customer Satisfaction Reduced Development Time Improved Internal Communications Better Documentation of Key Issues Save Money Some additional benefits are: Improved morale, organizational harmony Improved efficiency Reduction in design changes Increased competitiveness High market acceptance Problems are easier to identify