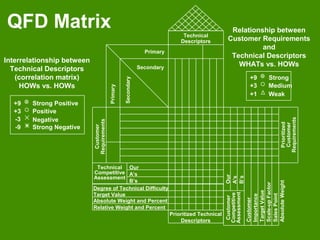
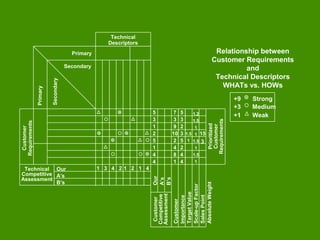
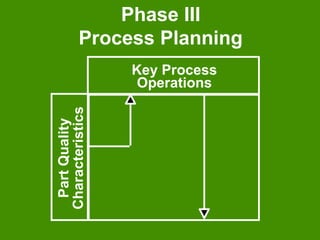
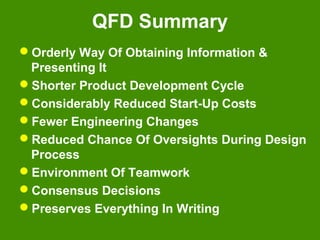
Quality
Function
Deployment
(QFD)
Outline
Introduction
QFD Team
Benefits Of QFD
Voice Of The Customer
House Of Quality
Building A House Of Quality
QFD Process
Summary
Introduction
Dr. Mizuno, Prof. Emeritus
Mitsubishi Heavy Industries
Kobe Shipyards, 1972
Toyota Minivans (1977 Base)
1979 - 20% Reduction In Start-Up Costs
1982 - 38%
1984 - 61%
Dr. Clausing, Xerox, 1984
Any Manufacturing Or Service
Industry
QFD Team
Significant Amount Of Time
Communication
Two Types Of Teams
New Product
Improve Existing Product
Marketing, Design, Quality, Finance,
Production, Etc.
Benefits Of QFD
Customer Driven
Reduces Implementation Time
Promotes Teamwork
Provides Documentation
Customer Driven
Creates Focus On Customer Requirements
Uses Competitive Information Effectively
Prioritizes Resources
Identifies Items That Can Be Acted On
Structures Resident
Experience/Information
Reduces Implementation Time
Decreases Midstream Design Change
Limits Post Introduction Problems
Avoids Future Development Redundancies
Identifies Future Application Opportunities
Surfaces Missing Assumptions
Promotes Teamwork
Based On Consensus
Creates Communication At Interfaces
Identifies Actions At Interfaces
Creates Global View-Out Of Details
Provides Documentation
Documents Rationale For Design
Is Easy To Assimilate
Adds Structure To The Information
Adapts To Changes (Living Document)
Provides Framework For Sensitivity
Analysis
Voice Of The Customer
Driving Force Behind QFD
Customer Dictates Attributes Of Product
Customer Satisfaction
Meeting Or Exceeding Customer
Expectations
Customer Expectations Can Be Vague &
General In Nature
Customer Expectations Must Be Taken
Literally, Not Translated Into What The
Organization Desires
Collecting Customer
Information
What Does Customer Really Want ?
What Are Customer’s Expectations ?
Are Customer’s Expectations Used
To Drive Design Process ?
What Can Design Team Do To
Achieve Customer Satisfaction?
Types Of Customer Information
Solicited, Measurable, Routine
Cus. & Market Surveys, Trade Trials
Unsolicited, Measurable, Routine
Customer Complaints, Lawsuits
Solicited, Subjective, Routine
Focus Groups
Solicited, Subjective, Haphazard
Trade & Cus. Visits, Indep. Consultants
Unsolicited, Subjective, Haphazard
Conventions, Vendors, Suppliers
House Of Quality
Technical Descriptors
(Voice of the organization)
Prioritized Technical
Descriptors
Interrelationship
between
Technical Descriptors
Customer
Requirements
(Voiceofthe
Customer)
Prioritized
Customer
Requirements
Relationship between
Requirements and
Descriptors
Building A House Of Quality
List Customer Requirements (What’s)
List Technical Descriptors (How’s)
Develop Relationship (What’s &
How’s)
Develop Interrelationship (How’s)
Competitive Assessments
Prioritize Customer Requirements
Prioritize Technical Descriptors
QFD Matrix
Absolute Weight and Percent
Prioritized Technical
Descriptors
Degree of Technical Difficulty
Relative Weight and Percent
Target Value
Customer
Requirements
Prioritized
Customer
Requirements
Technical
Descriptors
Primary
Primary
Secondary
Secondary
Technical
Competitive
Assessment
Customer
Competitive
Assessment
Our
A’s
B’s
Customer
Importance
TargetValue
Scale-upFactor
SalesPoint
AbsoluteWeight
Our
A’s
B’s
Relationship between
Customer Requirements
and
Technical Descriptors
WHATs vs. HOWs
Strong
Medium
Weak
+9
+3
+1
Strong Positive
Positive
Negative
Strong Negative
+9
+3
-3
-9
Interrelationship between
Technical Descriptors
(correlation matrix)
HOWs vs. HOWs
Customer Requirements (What’s)
CustomerRequirements
(WHATs)
Primary
Secondary
Tertiary
Technical Descriptors (How’s)
TechnicalDescriptors
(HOWs)
Primary
Secondary
Tertiary
L - Shaped Diagram
Customer
Requirements
Technical
Descriptors
Primary
Primary
Secondary
Secondary
Relationship Matrix
Customer
Requirements
Technical
Descriptors
Primary
Primary
Secondary Secondary
Relationship between
Customer
Requirements and
Technical Descriptors
WHATs vs. HOWs
Strong
Medium
Weak
+9
+3
+1
Correlation Matrix
Customer
Requirements
Technical
Descriptors
Primary
Primary
Secondary
Secondary
Relationship between
Customer Requirements
and
Technical Descriptors
WHATs vs. HOWs
Strong Positive
Positive
Negative
Strong Negative
+9
+3
-3
-9
Interrelationship between Technical
Descriptors (correlation matrix)
HOWs vs. HOWs
Strong
Medium
Weak
+9
+3
+1
Customer Competitive Assessment
Customer
Requirements
Customer
Competitive
Assessment
Ours
A’s
B’s
5
3
1
2
5
1
4
4
Relationship between
Customer Requirements
and
Technical Descriptors
WHATs vs. HOWs
Strong
Medium
Weak
+9
+3
+1
1 3 4 2 1 2 1 4
Technical Competitive Assessment
Customer
Requirements
Customer
Competitive
Assessment
Our
A’s
B’s
5
3
1
2
5
1
4
4
Relationship between
Customer Requirements
and
Technical Descriptors
WHATs vs. HOWs
Strong
Medium
Weak
+9
+3
+1Technical
Competitive
Assessment
Our
A’s
B’s
Prioritized Customer
Requirements
Importance Rating
Target Value
Scale-Up Factor
Sales Point
Absolute Weight & Percent
(Importance Rating)
(Scale-Up Factor)
(Sales Point)
7
3
9
10
2
4
8
1
Customer
Requirements
Prioritized
Customer
Requirements
Technical
Descriptors
Primary
Primary
Secondary
Secondary
Technical
Competitive
Assessment
Customer
Competitive
Assessment
Our
A’s
B’s
Customer
Importance
TargetValue
Scale-upFactor
SalesPoint
AbsoluteWeight
1 3 4 2 1 2 1 4
5
3
1
2
5
1
4
4
5
3
2
3
5
2
4
4
1.5
1
1.2
1.5
1
1
1.5
1
1.5
1
15
3
Our
A’s
B’s
Relationship between
Customer Requirements
and
Technical Descriptors
WHATs vs. HOWs
Strong
Medium
Weak
+9
+3
+1
Prioritized Technical
Descriptors
Degree Of Difficulty
Target Value
Absolute Weight & Percent
Relative Weight & Percent
a
j
R
ij
c
i
i
n
=
=
∑
1
b
j
R
ij
d
i
i
n
=
=
∑
1
R is Relationship Matrix
c is Customer Importance
R is Relationship Matrix
c is Customer Absolute
Weights
Absolute Weight and Percent
Prioritized Technical
Descriptors
Degree of Technical Difficulty
Relative Weight and Percent
Target Value
1 8 4 2 9 8 2 5
90
133
2 3 4 3 1 3 1 5
7
3
9
10
2
4
8
1
Customer
Requirements
Prioritized
Customer
Requirements
Technical
Descriptors
Primary
Primary
Secondary
Secondary
Technical
Competitive
Assessment
Customer
Competitive
Assessment
Our
A’s
B’s
Customer
Importance
TargetValue
Scale-upFactor
SalesPoint
AbsoluteWeight
1 3 4 2 1 2 1 4
5
3
1
2
5
1
4
4
5
3
2
3
5
2
4
4
1.5
1
1.2
1.5
1
1
1.5
1
1.5
1
15
3
Our
A’s
B’s
Relationship between
Customer Requirements
and
Technical Descriptors
WHATs vs. HOWs
Strong
Medium
Weak
+9
+3
+1
Strong Positive
Positive
Negative
Strong Negative
+9
+3
-3
-9
Interrelationship between
Technical Descriptors
(correlation matrix)
HOWs vs. HOWs
QFD ProcessWHATs
HOW
MUCH
HOWs
WHATs
HOW
MUCH
HOWs
Phase I
Product Planning
Design
Requirements
Customer
Requirements
Phase II
Part Development
Part Quality
Characteristics
Design
Requirements
Phase III
Process Planning
Key Process
Operations
PartQuality
Characteristics
Phase IV
Production Planning
Production
Requirements
KeyProcess
Operations
Production Launch
QFD Summary
Orderly Way Of Obtaining Information &
Presenting It
Shorter Product Development Cycle
Considerably Reduced Start-Up Costs
Fewer Engineering Changes
Reduced Chance Of Oversights During Design
Process
Environment Of Teamwork
Consensus Decisions
Preserves Everything In Writing

Qfd