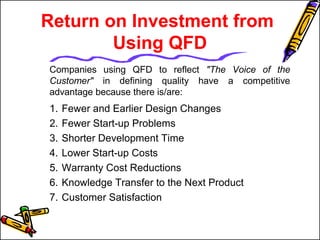
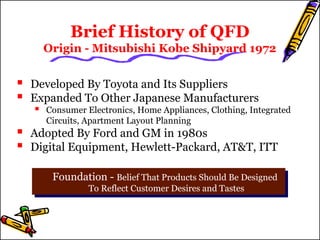
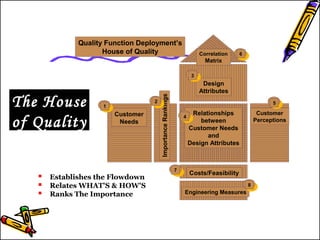
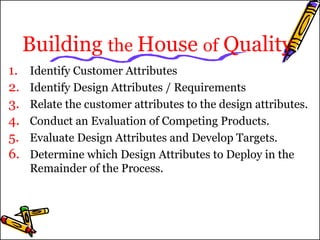
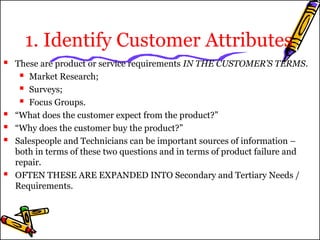
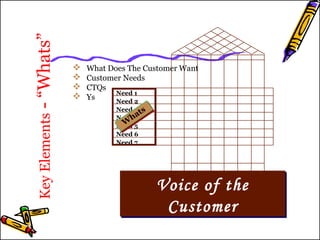
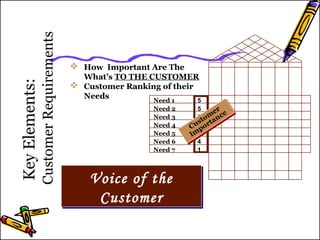
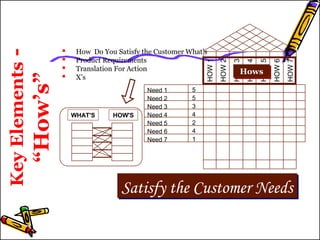
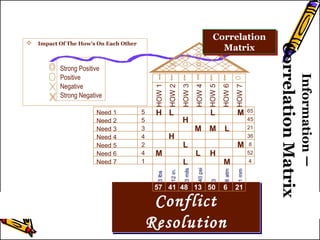
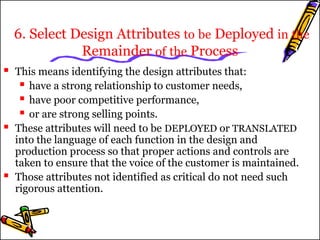
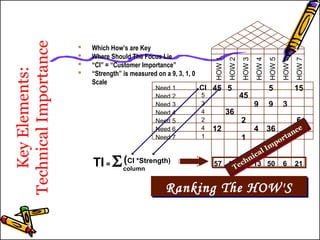
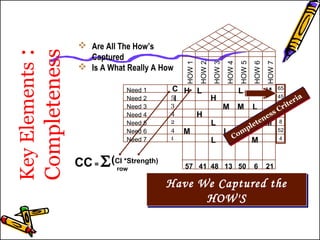
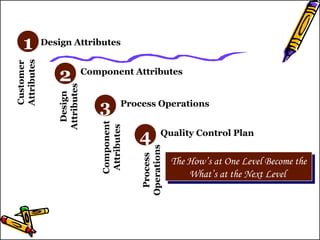
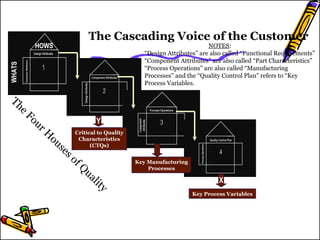
SlideShare a Scribd company logo
1 of 30
Quality Function 
Deployment 
PPrreeeettii MMiisshhrraa 
CCoouurrssee IInnssttrruuccttoorr
Quality Function Deployment 
 Is a structured method that is intended to transmit 
and translate customer requirements, that is, the 
 Voice of the Customer 
 through each stage of the product development and 
production process, that is, through the product 
realization cycle. 
 These requirements are the collection of customer 
needs, including all satisfiers, exciters/delighters, and 
dissatisfiers.
When is QFD Appropriate? 
 Poor communications and expectations get lost in the 
complexity of product development. 
 Lack of structure or logic to the allocation of product 
development resources. 
 Lack of efficient and / or effective product / process 
development teamwork. 
 Extended development time caused by excessive 
redesign, problem solving, or fire fighting.
Return on Investment from 
Using QFD 
Companies using QFD to reflect "The Voice of the 
Customer" in defining quality have a competitive 
advantage because there is/are: 
1. Fewer and Earlier Design Changes 
2. Fewer Start-up Problems 
3. Shorter Development Time 
4. Lower Start-up Costs 
5. Warranty Cost Reductions 
6. Knowledge Transfer to the Next Product 
7. Customer Satisfaction
Brief History of QFD 
Origin - Mitsubishi Kobe Shipyard 1972 
 Developed By Toyota and Its Suppliers 
 Expanded To Other Japanese Manufacturers 
 Consumer Electronics, Home Appliances, Clothing, Integrated 
Circuits, Apartment Layout Planning 
 Adopted By Ford and GM in 1980s 
 Digital Equipment, Hewlett-Packard, AT&T, ITT 
Foundation - Belief That Products Should Be Designed 
To Reflect Customer Desires and Tastes 
To Reflect Customer Desires and Tastes
Quality Function Deployment’s 
The House 
of Quality 
House of Quality 
Customer 
Perceptions 
Correlation 
Matrix 
Relationships 
between 
Customer Needs 
and 
Design Attributes 
Importance Rankings 
Customer 
Needs 
Design 
Attributes 
Costs/Feasibility 
Engineering Measures 
1 
2 
3 
4 
5 
6 
7 
8 
 Establishes the Flowdown 
 Relates WHAT'S & HOW'S 
 Ranks The Importance
 Key Elements 
 Informational Elements 
The House of Quality 
TTwwoo TTyyppeess ooff EElleemmeennttss iinn EEaacchh HHoouussee
QFD Flowdown 
Manufacturing 
Environment 
Manufacturing 
Environment 
GGrraannuullaarriittyy 
Customer Wants 
Technical Requirements 
Part Characteristics 
OOff Levels Manufacturing Process 
Production Requirements 
Flowdown Relates The 
Houses To Each Other Software 
Environment 
Software 
Environment 
Customer Wants 
Product Functionality 
System Characteristics 
Design Alternatives 
Service 
Service 
Environment 
Environment 
Customer Wants 
Service Requirements 
Service Processes 
Process Controls 
Flowdown Relates The 
Houses To Each Other
Building the House of Quality 
1. Identify Customer Attributes 
2. Identify Design Attributes / Requirements 
3. Relate the customer attributes to the design attributes. 
4. Conduct an Evaluation of Competing Products. 
5. Evaluate Design Attributes and Develop Targets. 
6. Determine which Design Attributes to Deploy in the 
Remainder of the Process.
1. Identify Customer Attributes 
 These are product or service requirements IN THE CUSTOMER’S TERMS. 
 Market Research; 
 Surveys; 
 Focus Groups. 
 “What does the customer expect from the product?” 
 “Why does the customer buy the product?” 
 Salespeople and Technicians can be important sources of information – 
both in terms of these two questions and in terms of product failure and 
repair. 
 OFTEN THESE ARE EXPANDED INTO Secondary and Tertiary Needs / 
Requirements.
 What Does The Customer Want 
 Customer Needs 
 CTQs 
 Ys 
Need 1 
Need 2 
Need 3 
Need 4 
Need 5 
Need 6 
Need 7 
Key Elements - “Whats” Voice of the 
Customer 
Whats
What’s TO THE CUSTOMER 
5534241 
Key Elements: 
Customer Requirements 
 How Important Are The 
 Customer Ranking of their 
Needs 
Voice of the 
Customer 
Customer 
Importance 
Need 1 
Need 2 
Need 3 
Need 4 
Need 5 
Need 6 
Need 7
2. Identify Design Attributes. 
 Design Attributes are Expressed in the Language of the 
Designer / Engineer and Represent the TECHNICAL 
Characteristics (Attributes) that must be Deployed 
throughout the DESIGN, MANUFACTURING, and 
SERVICE PROCESSES. 
 These must be MEASURABLE since the Output will be 
Controlled and Compared to Objective Targets. 
 The ROOF of the HOUSE OF QUALITY shows, 
symbolically, the Interrelationships between Design 
Attributes.
 How Do You Satisfy the Customer What’s 
 Product Requirements 
 Translation For Action 
 X’s HHoowwss 
Key Elements - 
“How’s” Satisfy the Customer Needs 
HOW 1 
HOW 2 
HOW 3 
HOW 4 
HOW 5 
HOW 6 
HOW 7 
WHAT'S HOW'S 
Need 1 
Need 2 
Need 3 
Need 4 
Need 5 
Need 6 
Need 7 
5534241
Information – 
Correlation Matrix 
Correlation 
Matrix 
HOW 1 
HOW 2 
HOW 3 
HOW 4 
HOW 5 
HOW 6 
HOW 7 
L L 
Conflict 
Resolution 
 Impact Of The How’s On Each Other 
Strong Positive 
Positive 
Negative 
Strong Negative 
Correlation 
Matrix 
Need 1 
Need 2 
Need 3 
Need 4 
Need 5 
Need 6 
Need 7 
5534241 
H 
H 
H 
H 
L 
M 
M 
M 
M M 
M L 
L 
L 
57 41 48 13 50 6 21 
65 
45 
21 
36 
8 
52 
4 
3 lbs 
12 in. 
3 mils 
40 psi 
3 
8 atm 
1 mm
3.Relating Customer & Design Attributes 
 Symbolically we determine whether there is NO relationship, a WEAK 
one, MODERATE one, or STRONG relationship between each Customer 
Attribute and each Design Attribute. 
 The PURPOSE it to determine whether the final Design Attributes 
adequately cover Customer Attributes. 
 LACK of a strong relationship between A customer attribute and any 
design attribute shows that the attribute is not adequately addressed or 
that the final product will have difficulty in meeting the expressed 
customer need. 
 Similarly, if a design attribute DOES NOT affect any customer attribute, 
then it may be redundant or the designers may have missed some 
important customer attribute.
Key Elements: 
Relationship 
 Strength of the Interrelation 
Between the What’s and the 
How’s 
 H Strong 9 
 M Medium 3 
 L Weak 1 
 Transfer Function 
 Y = f(X) 
Untangling The 
Web 
L L 
H 
H 
H 
H 
L 
M 
M 
M 
M M 
M L 
L 
LRelationship 
Need 1 
Need 2 
Need 3 
Need 4 
Need 5 
Need 6 
Need 7 
5534241 
HOW 1 
HOW 2 
HOW 3 
HOW 4 
HOW 5 
HOW 6 
HOW 7
4. Add Market Evaluation & Key Selling Points 
 This step includes identifying importance ratings for each customer 
attribute AND evaluating existing products / services for each of the 
attributes. 
 Customer importance ratings represent the areas of greatest interest 
and highest expectations AS EXPRESSED BY THE CUSTOMER. 
 Competitive evaluation helps to highlight the absolute strengths and 
weaknesses in competing products. 
 This step enables designers to seek opportunities for improvement 
and links QFD to a company’s strategic vision and allows priorities 
to be set in the design process.
5. Evaluate Design Attributes of Competitive 
Products & Set Targets. 
 This is USUALLY accomplished through in-house testing and then 
translated into MEASURABLE TERMS. 
 The evaluations are compared with the competitive evaluation of 
customer attributes to determine inconsistency between customer 
evaluations and technical evaluations. 
 For example, if a competing product is found to best satisfy a customer 
attribute, but the evaluation of the related design attribute indicates 
otherwise, then EITHER the measures used are faulty, OR else the 
product has an image difference that is affecting customer perceptions. 
 On the basis of customer importance ratings and existing product 
strengths and weaknesses, TARGETS and DIRECTIONS for each design 
attribute are set.
Information: How Much 
HOW 1 
HOW 2 
HOW 3 
HOW 4 
HOW 5 
HOW 6 
HOW 7 
M 
L L 
3 lbs 
12 in. 
3 mils 
40 psi 
3 
8 atm 
1 mm 
 Target Values for the 
CCoonnssiisstteenntt CCoommppaarriissoonn 
How’s 
 Note the Units 
HHooww MMuucchh 
Need 1 
Need 2 
Need 3 
Need 4 
Need 5 
Need 6 
Need 7 
5534241 
H 
H 
H 
H 
L 
M 
M 
M M 
M L 
L 
L 
57 41 48 13 50 6 21 
65 
45 
21 
36 
8 
52 
4
Information : 
 Information On The HOW'S 
Target Direction TThhee BBeesstt DDiirreeccttiioonn 
 More Is Better 
 Less Is Better 
 Specific Amount 
Target Direction 
HOW 1 
HOW 2 
HOW 3 
HOW 4 
HOW 5 
HOW 6 
HOW 7 
Need 1 
Need 2 
Need 3 
Need 4 
Need 5 
Need 6 
Need 7 
5534241 
L L 
H 
H 
H 
H 
L 
M 
M 
M 
M M 
M L 
L 
L 
57 41 48 13 50 6 21 
65 
45 
21 
36 
8 
52 
4
6. Select Design Attributes to be Deployed in the 
Remainder of the Process 
 This means identifying the design attributes that: 
 have a strong relationship to customer needs, 
 have poor competitive performance, 
 or are strong selling points. 
 These attributes will need to be DEPLOYED or TRANSLATED 
into the language of each function in the design and 
production process so that proper actions and controls are 
taken to ensure that the voice of the customer is maintained. 
 Those attributes not identified as critical do not need such 
rigorous attention.
5 5 
36 
45 
36 
45 
1 
15 
6 
M 
9 9 
12 4 
3 
2 
57 41 48 13 50 6 21 
Key Elements: 
Technical Importance 
 Which How’s are Key 
 Where Should The Focus Lie 
 “CI” = “Customer Importance” 
 “Strength” is measured on a 9, 3, 1, 0 
RRaannkkiinngg TThhee HHOOWW''SS 
Scale 
Technical Importance 
TI = Scolumn 
(CI *Strength) 
CI 
Need 1 
Need 2 
Need 3 
Need 4 
Need 5 
Need 6 
Need 7 
534241 
HOW 1 
HOW 2 
HOW 3 
HOW 4 
HOW 5 
HOW 6 
HOW 7
L L 
H 
H 
H 
H 
L 
M 
M 
M 
M M 
M L 
L 
L 
65 
45 
21 
36 
8 
52 
4 
Key Elements : 
Completeness Have We Captured the 
HOW'S 
 Are All The How’s 
Captured 
 Is A What Really A How 
Completeness Criteria 
CC = S row 
(CI *Strength) 
CI 
Need 1 
Need 2 
Need 3 
Need 4 
Need 5 
Need 6 
Need 7 
5 
3 
4 
2 
4 
1 
HOW 1 
HOW 2 
HOW 3 
HOW 4 
HOW 5 
HOW 6 
HOW 7 
57 41 48 13 50 6 21
Using the House of Quality 
The voice of the customer MUST be carried THROUGHOUT the 
production process. 
Three other “houses of quality” are used to do this and, together 
with the first, these carry the customer’s voice from its initial 
expression, through design attributes, on to component 
attributes, to process operations, and eventually to a quality 
control and improvement plans. 
In Japan, all four are used. 
The tendency in the West is to use only the first one or two.
1 Design Attributes 
Customer 
Attributes 
2 
3 
Process Operations 
4 
Design 
Attributes 
Component Attributes 
Component 
Attributes 
Quality Control Plan 
Process 
Operations 
The How’s at One Level Become the 
What’s at the Next Level 
What’s at the Next Level
The Cascading Voice of the Customer 
The Four Houses of Quality 
NOTES: 
“Design Attributes” are also called “Functional Requirements” 
“Component Attributes” are also called “Part Characteristics” 
“Process Operations” are also called “Manufacturing 
Processes” and the “Quality Control Plan” refers to “Key 
Process Variables. 
WHATS 
HOWS 
X 
Y 
Critical to Quality 
Characteristics 
(CTQs) 
Key Manufacturing 
Processes 
Key Process Variables
Common QFD Pitfalls 
 QFD On Everything 
Set the “Right” Granularity 
Don’t Apply To Every Last Project 
 Inadequate Priorities 
 Lack of Teamwork 
Wrong Participants 
Lack of Team Skills 
Lack of Support or Commitment 
 Too Much “Chart Focus” 
 “Hurry up and Get Done” 
 Failure to Integrate and Implement QFD
 Review Current Status 
 At Least Quarterly 
 Monthly on 1 Yr Project 
 Weekly on Small Projects 
 At Least Quarterly 
 Monthly on 1 Yr Project 
 Weekly on Small Projects 
The “Static” QFD 
Need 1 
Need 2 
Need 3 
Need 4 
Need 5 
Need 6 
Need 7 
5534241 
HOW 1 
HOW 2 
HOW 3 
HOW 4 
HOW 5 
HOW 6 
HOW 7 
L L 
65 
H 
45 
21 
H 
36 
8 
H 
52 
4 lbs 
3 H 
L 
M 
M 
M 
M M 
M L 
L 
L 
12 in. 
3 mils 
40 psi 
3 
8 atm 
1 mm 
57 41 48 13 50 6 21 
65 
45 
21 
36 
8 
52 
4
Points to Remember 
 The process may look simple, but requires effort. 
 Many entries look obvious—after they’re written down. 
 If there are NO “tough spots” the first time: It Probably Isn’t 
 The process may look simple, but requires effort. 
 Many entries look obvious—after they’re written down. 
 If there are NO “tough spots” the first time: It Probably Isn’t 
Being Done Right!!!! 
 Focus on the end-user customer. 
 Charts are not the objective. Charts are the means for 
achieving the objective. 
 Find reasons to succeed, not excuses for failure. 
 Remember to follow-up afterward 
 Remember to follow-up afterward

More Related Content

What's hot

What's hot (20)

Quality Function Development
Quality Function DevelopmentQuality Function Development
Quality Function Development
 
total quality management (tqm)
total quality management (tqm)total quality management (tqm)
total quality management (tqm)
 
Qfd
QfdQfd
Qfd
 
House of quality
House  of  qualityHouse  of  quality
House of quality
 
Total quality management
Total quality managementTotal quality management
Total quality management
 
WCM (World Class Manufacturing)
WCM (World Class Manufacturing)WCM (World Class Manufacturing)
WCM (World Class Manufacturing)
 
QFD
QFDQFD
QFD
 
quality engineering(ME522) part 1
quality engineering(ME522) part 1quality engineering(ME522) part 1
quality engineering(ME522) part 1
 
Tqm and six sigma
Tqm and six sigmaTqm and six sigma
Tqm and six sigma
 
House of quality matrix
House of quality matrixHouse of quality matrix
House of quality matrix
 
Business process reengineering
Business process reengineeringBusiness process reengineering
Business process reengineering
 
Six Sigma Qfd
Six Sigma QfdSix Sigma Qfd
Six Sigma Qfd
 
Quality function deployment
Quality function deploymentQuality function deployment
Quality function deployment
 
Quality Function Deployment
Quality Function DeploymentQuality Function Deployment
Quality Function Deployment
 
The DMAIC process
The DMAIC processThe DMAIC process
The DMAIC process
 
World Class Manufacturing
World Class Manufacturing World Class Manufacturing
World Class Manufacturing
 
FAILURE MODE EFFECT ANALYSIS
FAILURE MODE EFFECT ANALYSISFAILURE MODE EFFECT ANALYSIS
FAILURE MODE EFFECT ANALYSIS
 
Total Quality Management & 6 Sigma
Total Quality Management & 6 SigmaTotal Quality Management & 6 Sigma
Total Quality Management & 6 Sigma
 
Total Quality Management(TQM)
Total Quality Management(TQM)Total Quality Management(TQM)
Total Quality Management(TQM)
 
Industrial Facility Design
Industrial Facility DesignIndustrial Facility Design
Industrial Facility Design
 

Similar to Quality Function Deployment Explained

SeOperation Analysis Techniques Product and S.docx
SeOperation Analysis Techniques Product and S.docxSeOperation Analysis Techniques Product and S.docx
SeOperation Analysis Techniques Product and S.docxedgar6wallace88877
 
Requirements Management Booklet Pages
Requirements Management Booklet PagesRequirements Management Booklet Pages
Requirements Management Booklet PagesTonda MacLeod
 
PRODUCT BRIEF DEVELOPMENT TOOLS Quality Function Dep.docx
PRODUCT BRIEF DEVELOPMENT TOOLS Quality Function Dep.docxPRODUCT BRIEF DEVELOPMENT TOOLS Quality Function Dep.docx
PRODUCT BRIEF DEVELOPMENT TOOLS Quality Function Dep.docxbriancrawford30935
 
Detail explanation about the HOQ ( House of quality ) concept in engineering ...
Detail explanation about the HOQ ( House of quality ) concept in engineering ...Detail explanation about the HOQ ( House of quality ) concept in engineering ...
Detail explanation about the HOQ ( House of quality ) concept in engineering ...Nt Arvind
 
Initiating a new operations excellence project - Innovate Vancouver
Initiating a new operations excellence project - Innovate VancouverInitiating a new operations excellence project - Innovate Vancouver
Initiating a new operations excellence project - Innovate VancouverInnovate Vancouver
 
Introduction to Quality Function Deploymen1.docx
Introduction to Quality Function Deploymen1.docxIntroduction to Quality Function Deploymen1.docx
Introduction to Quality Function Deploymen1.docxMunaza21
 
Tools and Techniques of Quality Planning
Tools and Techniques of Quality PlanningTools and Techniques of Quality Planning
Tools and Techniques of Quality PlanningNicola Mezzetti
 
OM2_Lecture 11vvvhhbbjjbjdjjeebjrhvhuuhh
OM2_Lecture 11vvvhhbbjjbjdjjeebjrhvhuuhhOM2_Lecture 11vvvhhbbjjbjdjjeebjrhvhuuhh
OM2_Lecture 11vvvhhbbjjbjdjjeebjrhvhuuhhrammanoharjharupnaga
 
QFD-COVID TEST KIT updated-converted.pdf
QFD-COVID TEST KIT updated-converted.pdfQFD-COVID TEST KIT updated-converted.pdf
QFD-COVID TEST KIT updated-converted.pdfSachinShishodia4
 
Product design and development is a multi faceted process.
Product design and development is a multi faceted process.Product design and development is a multi faceted process.
Product design and development is a multi faceted process.Sonam704174
 
Designing Product for the Customer,House of quality matrix and design for man...
Designing Product for the Customer,House of quality matrix and design for man...Designing Product for the Customer,House of quality matrix and design for man...
Designing Product for the Customer,House of quality matrix and design for man...Rohit K.
 

Similar to Quality Function Deployment Explained (20)

Quality function development
Quality function developmentQuality function development
Quality function development
 
SeOperation Analysis Techniques Product and S.docx
SeOperation Analysis Techniques Product and S.docxSeOperation Analysis Techniques Product and S.docx
SeOperation Analysis Techniques Product and S.docx
 
Requirements Management Booklet Pages
Requirements Management Booklet PagesRequirements Management Booklet Pages
Requirements Management Booklet Pages
 
House of Quality
House of QualityHouse of Quality
House of Quality
 
chap 3-1.PPT
chap 3-1.PPTchap 3-1.PPT
chap 3-1.PPT
 
PRODUCT BRIEF DEVELOPMENT TOOLS Quality Function Dep.docx
PRODUCT BRIEF DEVELOPMENT TOOLS Quality Function Dep.docxPRODUCT BRIEF DEVELOPMENT TOOLS Quality Function Dep.docx
PRODUCT BRIEF DEVELOPMENT TOOLS Quality Function Dep.docx
 
house of quality
house of qualityhouse of quality
house of quality
 
Detail explanation about the HOQ ( House of quality ) concept in engineering ...
Detail explanation about the HOQ ( House of quality ) concept in engineering ...Detail explanation about the HOQ ( House of quality ) concept in engineering ...
Detail explanation about the HOQ ( House of quality ) concept in engineering ...
 
Initiating a new operations excellence project - Innovate Vancouver
Initiating a new operations excellence project - Innovate VancouverInitiating a new operations excellence project - Innovate Vancouver
Initiating a new operations excellence project - Innovate Vancouver
 
Introduction to Quality Function Deploymen1.docx
Introduction to Quality Function Deploymen1.docxIntroduction to Quality Function Deploymen1.docx
Introduction to Quality Function Deploymen1.docx
 
Tools and Techniques of Quality Planning
Tools and Techniques of Quality PlanningTools and Techniques of Quality Planning
Tools and Techniques of Quality Planning
 
OM2_Lecture 11vvvhhbbjjbjdjjeebjrhvhuuhh
OM2_Lecture 11vvvhhbbjjbjdjjeebjrhvhuuhhOM2_Lecture 11vvvhhbbjjbjdjjeebjrhvhuuhh
OM2_Lecture 11vvvhhbbjjbjdjjeebjrhvhuuhh
 
5 tools in dmai...
5 tools in dmai...5 tools in dmai...
5 tools in dmai...
 
Total Quality Management - II
Total Quality Management - IITotal Quality Management - II
Total Quality Management - II
 
Total Quality Management - II
Total Quality Management - IITotal Quality Management - II
Total Quality Management - II
 
QFD-COVID TEST KIT updated-converted.pdf
QFD-COVID TEST KIT updated-converted.pdfQFD-COVID TEST KIT updated-converted.pdf
QFD-COVID TEST KIT updated-converted.pdf
 
Ch13 apqp
Ch13 apqpCh13 apqp
Ch13 apqp
 
Product design and development is a multi faceted process.
Product design and development is a multi faceted process.Product design and development is a multi faceted process.
Product design and development is a multi faceted process.
 
Designing Product for the Customer,House of quality matrix and design for man...
Designing Product for the Customer,House of quality matrix and design for man...Designing Product for the Customer,House of quality matrix and design for man...
Designing Product for the Customer,House of quality matrix and design for man...
 
AS9103_2001.pdf
AS9103_2001.pdfAS9103_2001.pdf
AS9103_2001.pdf
 

More from Preeti Mishra

Effective Ways to Conduct Programming labs
Effective Ways to Conduct Programming labsEffective Ways to Conduct Programming labs
Effective Ways to Conduct Programming labsPreeti Mishra
 
Unit 8 software quality and matrices
Unit 8 software quality and matricesUnit 8 software quality and matrices
Unit 8 software quality and matricesPreeti Mishra
 
Unit 5 design engineering ssad
Unit 5 design engineering ssadUnit 5 design engineering ssad
Unit 5 design engineering ssadPreeti Mishra
 
architectural design
 architectural design architectural design
architectural designPreeti Mishra
 
Oo concepts and class modeling
Oo concepts and class modelingOo concepts and class modeling
Oo concepts and class modelingPreeti Mishra
 
Unit 7 performing user interface design
Unit 7 performing user interface designUnit 7 performing user interface design
Unit 7 performing user interface designPreeti Mishra
 
testing strategies and tactics
 testing strategies and tactics testing strategies and tactics
testing strategies and tacticsPreeti Mishra
 
requirements analysis and design
requirements analysis and designrequirements analysis and design
requirements analysis and designPreeti Mishra
 
Design process interaction design basics
Design process interaction design basicsDesign process interaction design basics
Design process interaction design basicsPreeti Mishra
 
Design process design rules
Design process  design rulesDesign process  design rules
Design process design rulesPreeti Mishra
 
Design process evaluating interactive_designs
Design process  evaluating interactive_designsDesign process  evaluating interactive_designs
Design process evaluating interactive_designsPreeti Mishra
 
Foundations understanding users and interactions
Foundations  understanding users and interactionsFoundations  understanding users and interactions
Foundations understanding users and interactionsPreeti Mishra
 

More from Preeti Mishra (20)

Effective Ways to Conduct Programming labs
Effective Ways to Conduct Programming labsEffective Ways to Conduct Programming labs
Effective Ways to Conduct Programming labs
 
Uml intro
Uml introUml intro
Uml intro
 
Component diagram
Component diagramComponent diagram
Component diagram
 
Activity diag
Activity diagActivity diag
Activity diag
 
Object diagram
Object diagramObject diagram
Object diagram
 
Sequence diagrams
Sequence diagramsSequence diagrams
Sequence diagrams
 
State chart diagram
State chart diagramState chart diagram
State chart diagram
 
Use case Diagram
Use case DiagramUse case Diagram
Use case Diagram
 
Unit 8 software quality and matrices
Unit 8 software quality and matricesUnit 8 software quality and matrices
Unit 8 software quality and matrices
 
Unit 5 design engineering ssad
Unit 5 design engineering ssadUnit 5 design engineering ssad
Unit 5 design engineering ssad
 
architectural design
 architectural design architectural design
architectural design
 
Oo concepts and class modeling
Oo concepts and class modelingOo concepts and class modeling
Oo concepts and class modeling
 
Unit 7 performing user interface design
Unit 7 performing user interface designUnit 7 performing user interface design
Unit 7 performing user interface design
 
testing strategies and tactics
 testing strategies and tactics testing strategies and tactics
testing strategies and tactics
 
requirements analysis and design
requirements analysis and designrequirements analysis and design
requirements analysis and design
 
Design process interaction design basics
Design process interaction design basicsDesign process interaction design basics
Design process interaction design basics
 
Design process design rules
Design process  design rulesDesign process  design rules
Design process design rules
 
Design process evaluating interactive_designs
Design process  evaluating interactive_designsDesign process  evaluating interactive_designs
Design process evaluating interactive_designs
 
Foundations understanding users and interactions
Foundations  understanding users and interactionsFoundations  understanding users and interactions
Foundations understanding users and interactions
 
IntrIntroduction
IntrIntroductionIntrIntroduction
IntrIntroduction
 

Recently uploaded

Call Girls in Naraina Delhi 💯Call Us 🔝8264348440🔝
Call Girls in Naraina Delhi 💯Call Us 🔝8264348440🔝Call Girls in Naraina Delhi 💯Call Us 🔝8264348440🔝
Call Girls in Naraina Delhi 💯Call Us 🔝8264348440🔝soniya singh
 
(Genuine) Escort Service Lucknow | Starting ₹,5K To @25k with A/C 🧑🏽‍❤️‍🧑🏻 89...
(Genuine) Escort Service Lucknow | Starting ₹,5K To @25k with A/C 🧑🏽‍❤️‍🧑🏻 89...(Genuine) Escort Service Lucknow | Starting ₹,5K To @25k with A/C 🧑🏽‍❤️‍🧑🏻 89...
(Genuine) Escort Service Lucknow | Starting ₹,5K To @25k with A/C 🧑🏽‍❤️‍🧑🏻 89...gurkirankumar98700
 
HR Software Buyers Guide in 2024 - HRSoftware.com
HR Software Buyers Guide in 2024 - HRSoftware.comHR Software Buyers Guide in 2024 - HRSoftware.com
HR Software Buyers Guide in 2024 - HRSoftware.comFatema Valibhai
 
Asset Management Software - Infographic
Asset Management Software - InfographicAsset Management Software - Infographic
Asset Management Software - InfographicHr365.us smith
 
Steps To Getting Up And Running Quickly With MyTimeClock Employee Scheduling ...
Steps To Getting Up And Running Quickly With MyTimeClock Employee Scheduling ...Steps To Getting Up And Running Quickly With MyTimeClock Employee Scheduling ...
Steps To Getting Up And Running Quickly With MyTimeClock Employee Scheduling ...MyIntelliSource, Inc.
 
Optimizing AI for immediate response in Smart CCTV
Optimizing AI for immediate response in Smart CCTVOptimizing AI for immediate response in Smart CCTV
Optimizing AI for immediate response in Smart CCTVshikhaohhpro
 
Der Spagat zwischen BIAS und FAIRNESS (2024)
Der Spagat zwischen BIAS und FAIRNESS (2024)Der Spagat zwischen BIAS und FAIRNESS (2024)
Der Spagat zwischen BIAS und FAIRNESS (2024)OPEN KNOWLEDGE GmbH
 
Building Real-Time Data Pipelines: Stream & Batch Processing workshop Slide
Building Real-Time Data Pipelines: Stream & Batch Processing workshop SlideBuilding Real-Time Data Pipelines: Stream & Batch Processing workshop Slide
Building Real-Time Data Pipelines: Stream & Batch Processing workshop SlideChristina Lin
 
Try MyIntelliAccount Cloud Accounting Software As A Service Solution Risk Fre...
Try MyIntelliAccount Cloud Accounting Software As A Service Solution Risk Fre...Try MyIntelliAccount Cloud Accounting Software As A Service Solution Risk Fre...
Try MyIntelliAccount Cloud Accounting Software As A Service Solution Risk Fre...MyIntelliSource, Inc.
 
ODSC - Batch to Stream workshop - integration of Apache Spark, Cassandra, Pos...
ODSC - Batch to Stream workshop - integration of Apache Spark, Cassandra, Pos...ODSC - Batch to Stream workshop - integration of Apache Spark, Cassandra, Pos...
ODSC - Batch to Stream workshop - integration of Apache Spark, Cassandra, Pos...Christina Lin
 
Advancing Engineering with AI through the Next Generation of Strategic Projec...
Advancing Engineering with AI through the Next Generation of Strategic Projec...Advancing Engineering with AI through the Next Generation of Strategic Projec...
Advancing Engineering with AI through the Next Generation of Strategic Projec...OnePlan Solutions
 
Salesforce Certified Field Service Consultant
Salesforce Certified Field Service ConsultantSalesforce Certified Field Service Consultant
Salesforce Certified Field Service ConsultantAxelRicardoTrocheRiq
 
Building a General PDE Solving Framework with Symbolic-Numeric Scientific Mac...
Building a General PDE Solving Framework with Symbolic-Numeric Scientific Mac...Building a General PDE Solving Framework with Symbolic-Numeric Scientific Mac...
Building a General PDE Solving Framework with Symbolic-Numeric Scientific Mac...stazi3110
 
EY_Graph Database Powered Sustainability
EY_Graph Database Powered SustainabilityEY_Graph Database Powered Sustainability
EY_Graph Database Powered SustainabilityNeo4j
 
Cloud Management Software Platforms: OpenStack
Cloud Management Software Platforms: OpenStackCloud Management Software Platforms: OpenStack
Cloud Management Software Platforms: OpenStackVICTOR MAESTRE RAMIREZ
 
Adobe Marketo Engage Deep Dives: Using Webhooks to Transfer Data
Adobe Marketo Engage Deep Dives: Using Webhooks to Transfer DataAdobe Marketo Engage Deep Dives: Using Webhooks to Transfer Data
Adobe Marketo Engage Deep Dives: Using Webhooks to Transfer DataBradBedford3
 
Alluxio Monthly Webinar | Cloud-Native Model Training on Distributed Data
Alluxio Monthly Webinar | Cloud-Native Model Training on Distributed DataAlluxio Monthly Webinar | Cloud-Native Model Training on Distributed Data
Alluxio Monthly Webinar | Cloud-Native Model Training on Distributed DataAlluxio, Inc.
 
Engage Usergroup 2024 - The Good The Bad_The Ugly
Engage Usergroup 2024 - The Good The Bad_The UglyEngage Usergroup 2024 - The Good The Bad_The Ugly
Engage Usergroup 2024 - The Good The Bad_The UglyFrank van der Linden
 
Project Based Learning (A.I).pptx detail explanation
Project Based Learning (A.I).pptx detail explanationProject Based Learning (A.I).pptx detail explanation
Project Based Learning (A.I).pptx detail explanationkaushalgiri8080
 

Recently uploaded (20)

Call Girls in Naraina Delhi 💯Call Us 🔝8264348440🔝
Call Girls in Naraina Delhi 💯Call Us 🔝8264348440🔝Call Girls in Naraina Delhi 💯Call Us 🔝8264348440🔝
Call Girls in Naraina Delhi 💯Call Us 🔝8264348440🔝
 
(Genuine) Escort Service Lucknow | Starting ₹,5K To @25k with A/C 🧑🏽‍❤️‍🧑🏻 89...
(Genuine) Escort Service Lucknow | Starting ₹,5K To @25k with A/C 🧑🏽‍❤️‍🧑🏻 89...(Genuine) Escort Service Lucknow | Starting ₹,5K To @25k with A/C 🧑🏽‍❤️‍🧑🏻 89...
(Genuine) Escort Service Lucknow | Starting ₹,5K To @25k with A/C 🧑🏽‍❤️‍🧑🏻 89...
 
HR Software Buyers Guide in 2024 - HRSoftware.com
HR Software Buyers Guide in 2024 - HRSoftware.comHR Software Buyers Guide in 2024 - HRSoftware.com
HR Software Buyers Guide in 2024 - HRSoftware.com
 
Asset Management Software - Infographic
Asset Management Software - InfographicAsset Management Software - Infographic
Asset Management Software - Infographic
 
Steps To Getting Up And Running Quickly With MyTimeClock Employee Scheduling ...
Steps To Getting Up And Running Quickly With MyTimeClock Employee Scheduling ...Steps To Getting Up And Running Quickly With MyTimeClock Employee Scheduling ...
Steps To Getting Up And Running Quickly With MyTimeClock Employee Scheduling ...
 
Optimizing AI for immediate response in Smart CCTV
Optimizing AI for immediate response in Smart CCTVOptimizing AI for immediate response in Smart CCTV
Optimizing AI for immediate response in Smart CCTV
 
Der Spagat zwischen BIAS und FAIRNESS (2024)
Der Spagat zwischen BIAS und FAIRNESS (2024)Der Spagat zwischen BIAS und FAIRNESS (2024)
Der Spagat zwischen BIAS und FAIRNESS (2024)
 
Building Real-Time Data Pipelines: Stream & Batch Processing workshop Slide
Building Real-Time Data Pipelines: Stream & Batch Processing workshop SlideBuilding Real-Time Data Pipelines: Stream & Batch Processing workshop Slide
Building Real-Time Data Pipelines: Stream & Batch Processing workshop Slide
 
Try MyIntelliAccount Cloud Accounting Software As A Service Solution Risk Fre...
Try MyIntelliAccount Cloud Accounting Software As A Service Solution Risk Fre...Try MyIntelliAccount Cloud Accounting Software As A Service Solution Risk Fre...
Try MyIntelliAccount Cloud Accounting Software As A Service Solution Risk Fre...
 
ODSC - Batch to Stream workshop - integration of Apache Spark, Cassandra, Pos...
ODSC - Batch to Stream workshop - integration of Apache Spark, Cassandra, Pos...ODSC - Batch to Stream workshop - integration of Apache Spark, Cassandra, Pos...
ODSC - Batch to Stream workshop - integration of Apache Spark, Cassandra, Pos...
 
Advancing Engineering with AI through the Next Generation of Strategic Projec...
Advancing Engineering with AI through the Next Generation of Strategic Projec...Advancing Engineering with AI through the Next Generation of Strategic Projec...
Advancing Engineering with AI through the Next Generation of Strategic Projec...
 
Salesforce Certified Field Service Consultant
Salesforce Certified Field Service ConsultantSalesforce Certified Field Service Consultant
Salesforce Certified Field Service Consultant
 
Building a General PDE Solving Framework with Symbolic-Numeric Scientific Mac...
Building a General PDE Solving Framework with Symbolic-Numeric Scientific Mac...Building a General PDE Solving Framework with Symbolic-Numeric Scientific Mac...
Building a General PDE Solving Framework with Symbolic-Numeric Scientific Mac...
 
Call Girls In Mukherjee Nagar 📱 9999965857 🤩 Delhi 🫦 HOT AND SEXY VVIP 🍎 SE...
Call Girls In Mukherjee Nagar 📱  9999965857  🤩 Delhi 🫦 HOT AND SEXY VVIP 🍎 SE...Call Girls In Mukherjee Nagar 📱  9999965857  🤩 Delhi 🫦 HOT AND SEXY VVIP 🍎 SE...
Call Girls In Mukherjee Nagar 📱 9999965857 🤩 Delhi 🫦 HOT AND SEXY VVIP 🍎 SE...
 
EY_Graph Database Powered Sustainability
EY_Graph Database Powered SustainabilityEY_Graph Database Powered Sustainability
EY_Graph Database Powered Sustainability
 
Cloud Management Software Platforms: OpenStack
Cloud Management Software Platforms: OpenStackCloud Management Software Platforms: OpenStack
Cloud Management Software Platforms: OpenStack
 
Adobe Marketo Engage Deep Dives: Using Webhooks to Transfer Data
Adobe Marketo Engage Deep Dives: Using Webhooks to Transfer DataAdobe Marketo Engage Deep Dives: Using Webhooks to Transfer Data
Adobe Marketo Engage Deep Dives: Using Webhooks to Transfer Data
 
Alluxio Monthly Webinar | Cloud-Native Model Training on Distributed Data
Alluxio Monthly Webinar | Cloud-Native Model Training on Distributed DataAlluxio Monthly Webinar | Cloud-Native Model Training on Distributed Data
Alluxio Monthly Webinar | Cloud-Native Model Training on Distributed Data
 
Engage Usergroup 2024 - The Good The Bad_The Ugly
Engage Usergroup 2024 - The Good The Bad_The UglyEngage Usergroup 2024 - The Good The Bad_The Ugly
Engage Usergroup 2024 - The Good The Bad_The Ugly
 
Project Based Learning (A.I).pptx detail explanation
Project Based Learning (A.I).pptx detail explanationProject Based Learning (A.I).pptx detail explanation
Project Based Learning (A.I).pptx detail explanation
 

Quality Function Deployment Explained

  • 1. Quality Function Deployment PPrreeeettii MMiisshhrraa CCoouurrssee IInnssttrruuccttoorr
  • 2. Quality Function Deployment  Is a structured method that is intended to transmit and translate customer requirements, that is, the  Voice of the Customer  through each stage of the product development and production process, that is, through the product realization cycle.  These requirements are the collection of customer needs, including all satisfiers, exciters/delighters, and dissatisfiers.
  • 3. When is QFD Appropriate?  Poor communications and expectations get lost in the complexity of product development.  Lack of structure or logic to the allocation of product development resources.  Lack of efficient and / or effective product / process development teamwork.  Extended development time caused by excessive redesign, problem solving, or fire fighting.
  • 4. Return on Investment from Using QFD Companies using QFD to reflect "The Voice of the Customer" in defining quality have a competitive advantage because there is/are: 1. Fewer and Earlier Design Changes 2. Fewer Start-up Problems 3. Shorter Development Time 4. Lower Start-up Costs 5. Warranty Cost Reductions 6. Knowledge Transfer to the Next Product 7. Customer Satisfaction
  • 5. Brief History of QFD Origin - Mitsubishi Kobe Shipyard 1972  Developed By Toyota and Its Suppliers  Expanded To Other Japanese Manufacturers  Consumer Electronics, Home Appliances, Clothing, Integrated Circuits, Apartment Layout Planning  Adopted By Ford and GM in 1980s  Digital Equipment, Hewlett-Packard, AT&T, ITT Foundation - Belief That Products Should Be Designed Foundation - Belief That Products Should Be Designed To Reflect Customer Desires and Tastes To Reflect Customer Desires and Tastes
  • 6. Quality Function Deployment’s The House of Quality House of Quality Customer Perceptions Correlation Matrix Relationships between Customer Needs and Design Attributes Importance Rankings Customer Needs Design Attributes Costs/Feasibility Engineering Measures 1 2 3 4 5 6 7 8  Establishes the Flowdown  Relates WHAT'S & HOW'S  Ranks The Importance
  • 7.  Key Elements  Informational Elements The House of Quality TTwwoo TTyyppeess ooff EElleemmeennttss iinn EEaacchh HHoouussee
  • 8. QFD Flowdown Manufacturing Environment Manufacturing Environment GGrraannuullaarriittyy Customer Wants Technical Requirements Part Characteristics OOff Levels Manufacturing Process Production Requirements Flowdown Relates The Houses To Each Other Software Environment Software Environment Customer Wants Product Functionality System Characteristics Design Alternatives Service Service Environment Environment Customer Wants Service Requirements Service Processes Process Controls Flowdown Relates The Houses To Each Other
  • 9. Building the House of Quality 1. Identify Customer Attributes 2. Identify Design Attributes / Requirements 3. Relate the customer attributes to the design attributes. 4. Conduct an Evaluation of Competing Products. 5. Evaluate Design Attributes and Develop Targets. 6. Determine which Design Attributes to Deploy in the Remainder of the Process.
  • 10. 1. Identify Customer Attributes  These are product or service requirements IN THE CUSTOMER’S TERMS.  Market Research;  Surveys;  Focus Groups.  “What does the customer expect from the product?”  “Why does the customer buy the product?”  Salespeople and Technicians can be important sources of information – both in terms of these two questions and in terms of product failure and repair.  OFTEN THESE ARE EXPANDED INTO Secondary and Tertiary Needs / Requirements.
  • 11.  What Does The Customer Want  Customer Needs  CTQs  Ys Need 1 Need 2 Need 3 Need 4 Need 5 Need 6 Need 7 Key Elements - “Whats” Voice of the Customer Whats
  • 12. What’s TO THE CUSTOMER 5534241 Key Elements: Customer Requirements  How Important Are The  Customer Ranking of their Needs Voice of the Customer Customer Importance Need 1 Need 2 Need 3 Need 4 Need 5 Need 6 Need 7
  • 13. 2. Identify Design Attributes.  Design Attributes are Expressed in the Language of the Designer / Engineer and Represent the TECHNICAL Characteristics (Attributes) that must be Deployed throughout the DESIGN, MANUFACTURING, and SERVICE PROCESSES.  These must be MEASURABLE since the Output will be Controlled and Compared to Objective Targets.  The ROOF of the HOUSE OF QUALITY shows, symbolically, the Interrelationships between Design Attributes.
  • 14.  How Do You Satisfy the Customer What’s  Product Requirements  Translation For Action  X’s HHoowwss Key Elements - “How’s” Satisfy the Customer Needs HOW 1 HOW 2 HOW 3 HOW 4 HOW 5 HOW 6 HOW 7 WHAT'S HOW'S Need 1 Need 2 Need 3 Need 4 Need 5 Need 6 Need 7 5534241
  • 15. Information – Correlation Matrix Correlation Matrix HOW 1 HOW 2 HOW 3 HOW 4 HOW 5 HOW 6 HOW 7 L L Conflict Resolution  Impact Of The How’s On Each Other Strong Positive Positive Negative Strong Negative Correlation Matrix Need 1 Need 2 Need 3 Need 4 Need 5 Need 6 Need 7 5534241 H H H H L M M M M M M L L L 57 41 48 13 50 6 21 65 45 21 36 8 52 4 3 lbs 12 in. 3 mils 40 psi 3 8 atm 1 mm
  • 16. 3.Relating Customer & Design Attributes  Symbolically we determine whether there is NO relationship, a WEAK one, MODERATE one, or STRONG relationship between each Customer Attribute and each Design Attribute.  The PURPOSE it to determine whether the final Design Attributes adequately cover Customer Attributes.  LACK of a strong relationship between A customer attribute and any design attribute shows that the attribute is not adequately addressed or that the final product will have difficulty in meeting the expressed customer need.  Similarly, if a design attribute DOES NOT affect any customer attribute, then it may be redundant or the designers may have missed some important customer attribute.
  • 17. Key Elements: Relationship  Strength of the Interrelation Between the What’s and the How’s  H Strong 9  M Medium 3  L Weak 1  Transfer Function  Y = f(X) Untangling The Web L L H H H H L M M M M M M L L LRelationship Need 1 Need 2 Need 3 Need 4 Need 5 Need 6 Need 7 5534241 HOW 1 HOW 2 HOW 3 HOW 4 HOW 5 HOW 6 HOW 7
  • 18. 4. Add Market Evaluation & Key Selling Points  This step includes identifying importance ratings for each customer attribute AND evaluating existing products / services for each of the attributes.  Customer importance ratings represent the areas of greatest interest and highest expectations AS EXPRESSED BY THE CUSTOMER.  Competitive evaluation helps to highlight the absolute strengths and weaknesses in competing products.  This step enables designers to seek opportunities for improvement and links QFD to a company’s strategic vision and allows priorities to be set in the design process.
  • 19. 5. Evaluate Design Attributes of Competitive Products & Set Targets.  This is USUALLY accomplished through in-house testing and then translated into MEASURABLE TERMS.  The evaluations are compared with the competitive evaluation of customer attributes to determine inconsistency between customer evaluations and technical evaluations.  For example, if a competing product is found to best satisfy a customer attribute, but the evaluation of the related design attribute indicates otherwise, then EITHER the measures used are faulty, OR else the product has an image difference that is affecting customer perceptions.  On the basis of customer importance ratings and existing product strengths and weaknesses, TARGETS and DIRECTIONS for each design attribute are set.
  • 20. Information: How Much HOW 1 HOW 2 HOW 3 HOW 4 HOW 5 HOW 6 HOW 7 M L L 3 lbs 12 in. 3 mils 40 psi 3 8 atm 1 mm  Target Values for the CCoonnssiisstteenntt CCoommppaarriissoonn How’s  Note the Units HHooww MMuucchh Need 1 Need 2 Need 3 Need 4 Need 5 Need 6 Need 7 5534241 H H H H L M M M M M L L L 57 41 48 13 50 6 21 65 45 21 36 8 52 4
  • 21. Information :  Information On The HOW'S Target Direction TThhee BBeesstt DDiirreeccttiioonn  More Is Better  Less Is Better  Specific Amount Target Direction HOW 1 HOW 2 HOW 3 HOW 4 HOW 5 HOW 6 HOW 7 Need 1 Need 2 Need 3 Need 4 Need 5 Need 6 Need 7 5534241 L L H H H H L M M M M M M L L L 57 41 48 13 50 6 21 65 45 21 36 8 52 4
  • 22. 6. Select Design Attributes to be Deployed in the Remainder of the Process  This means identifying the design attributes that:  have a strong relationship to customer needs,  have poor competitive performance,  or are strong selling points.  These attributes will need to be DEPLOYED or TRANSLATED into the language of each function in the design and production process so that proper actions and controls are taken to ensure that the voice of the customer is maintained.  Those attributes not identified as critical do not need such rigorous attention.
  • 23. 5 5 36 45 36 45 1 15 6 M 9 9 12 4 3 2 57 41 48 13 50 6 21 Key Elements: Technical Importance  Which How’s are Key  Where Should The Focus Lie  “CI” = “Customer Importance”  “Strength” is measured on a 9, 3, 1, 0 RRaannkkiinngg TThhee HHOOWW''SS Scale Technical Importance TI = Scolumn (CI *Strength) CI Need 1 Need 2 Need 3 Need 4 Need 5 Need 6 Need 7 534241 HOW 1 HOW 2 HOW 3 HOW 4 HOW 5 HOW 6 HOW 7
  • 24. L L H H H H L M M M M M M L L L 65 45 21 36 8 52 4 Key Elements : Completeness Have We Captured the HOW'S  Are All The How’s Captured  Is A What Really A How Completeness Criteria CC = S row (CI *Strength) CI Need 1 Need 2 Need 3 Need 4 Need 5 Need 6 Need 7 5 3 4 2 4 1 HOW 1 HOW 2 HOW 3 HOW 4 HOW 5 HOW 6 HOW 7 57 41 48 13 50 6 21
  • 25. Using the House of Quality The voice of the customer MUST be carried THROUGHOUT the production process. Three other “houses of quality” are used to do this and, together with the first, these carry the customer’s voice from its initial expression, through design attributes, on to component attributes, to process operations, and eventually to a quality control and improvement plans. In Japan, all four are used. The tendency in the West is to use only the first one or two.
  • 26. 1 Design Attributes Customer Attributes 2 3 Process Operations 4 Design Attributes Component Attributes Component Attributes Quality Control Plan Process Operations The How’s at One Level Become the The How’s at One Level Become the What’s at the Next Level What’s at the Next Level
  • 27. The Cascading Voice of the Customer The Four Houses of Quality NOTES: “Design Attributes” are also called “Functional Requirements” “Component Attributes” are also called “Part Characteristics” “Process Operations” are also called “Manufacturing Processes” and the “Quality Control Plan” refers to “Key Process Variables. WHATS HOWS X Y Critical to Quality Characteristics (CTQs) Key Manufacturing Processes Key Process Variables
  • 28. Common QFD Pitfalls  QFD On Everything Set the “Right” Granularity Don’t Apply To Every Last Project  Inadequate Priorities  Lack of Teamwork Wrong Participants Lack of Team Skills Lack of Support or Commitment  Too Much “Chart Focus”  “Hurry up and Get Done”  Failure to Integrate and Implement QFD
  • 29.  Review Current Status  Review Current Status  At Least Quarterly  Monthly on 1 Yr Project  Weekly on Small Projects  At Least Quarterly  Monthly on 1 Yr Project  Weekly on Small Projects The “Static” QFD Need 1 Need 2 Need 3 Need 4 Need 5 Need 6 Need 7 5534241 HOW 1 HOW 2 HOW 3 HOW 4 HOW 5 HOW 6 HOW 7 L L 65 H 45 21 H 36 8 H 52 4 lbs 3 H L M M M M M M L L L 12 in. 3 mils 40 psi 3 8 atm 1 mm 57 41 48 13 50 6 21 65 45 21 36 8 52 4
  • 30. Points to Remember  The process may look simple, but requires effort.  Many entries look obvious—after they’re written down.  If there are NO “tough spots” the first time: It Probably Isn’t  The process may look simple, but requires effort.  Many entries look obvious—after they’re written down.  If there are NO “tough spots” the first time: It Probably Isn’t Being Done Right!!!! Being Done Right!!!!  Focus on the end-user customer.  Focus on the end-user customer.  Charts are not the objective. Charts are the means for  Charts are not the objective. Charts are the means for achieving the objective. achieving the objective.  Find reasons to succeed, not excuses for failure.  Find reasons to succeed, not excuses for failure.  Remember to follow-up afterward  Remember to follow-up afterward