Downloaded 102 times


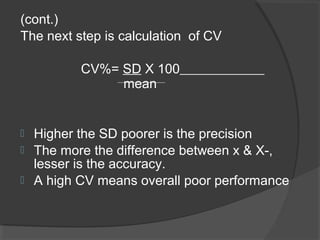
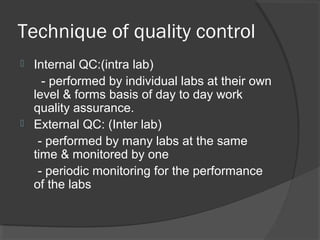


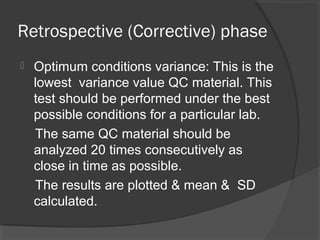
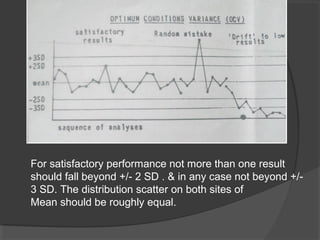


This document discusses quality assurance and quality control in clinical laboratories. It defines quality assurance as ensuring a specified quality is achieved and maintained through all steps of laboratory testing. Quality control specifically monitors analytical accuracy and precision. Laboratories should implement both internal quality control methods like Levey-Jennings charts to monitor daily performance, as well as participate in external quality assurance programs for benchmarking and improvement. The goal is reliable test results that can be correctly interpreted for patient care.


