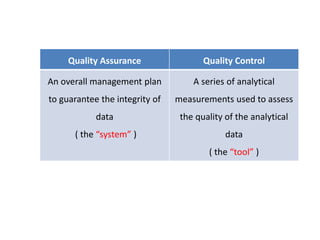
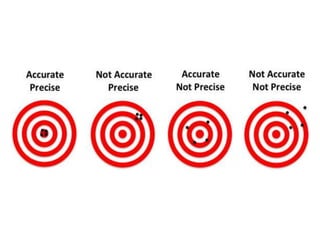
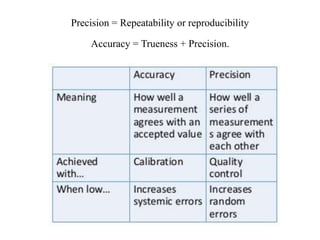
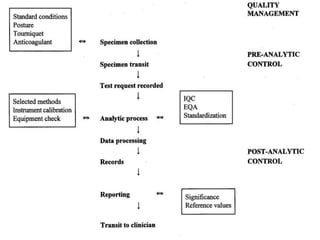
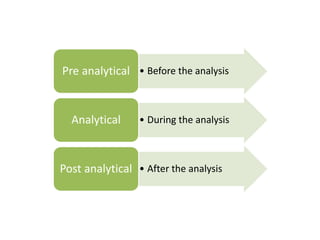
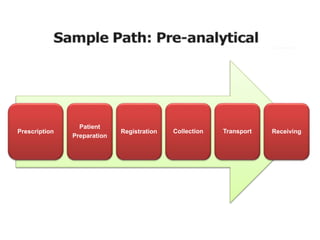
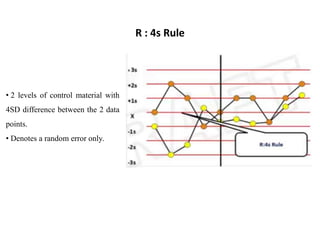
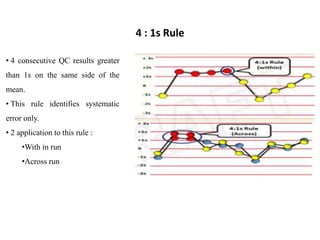
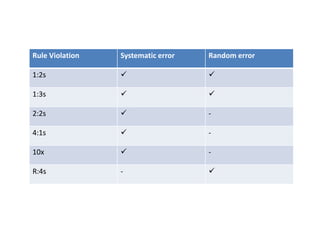
This document discusses quality control in hematology. It defines quality as meeting specifications and quality control as measures taken during testing to ensure tests are working properly. Quality assurance ensures the correct test is performed and the right result is delivered. Quality control involves analytical measurements to assess data quality while quality assurance is an overall management plan. The key activities of quality assurance are preventive, assessment and corrective measures. The document outlines the importance of accuracy, precision, internal quality control, external quality control and corrective actions when errors are found.
Quality control, or QC for short, is a process by which entities review the quality of all factors involved in the production. ISO 9000 defines quality control as "A part of quality management focused on fulfilling quality requirements"
This presentation gives a brief idea of Quality control and how to execute it.
Quality control lecture CPath master 2014 Ain ShamsAdel Elazab Elged
Basics of quality management or assurance program detailing values of internal quality control material analysis and interpretation and external quality control or proficiency testing programs in medical laboratories
In the continuous quality journey, Controlling laboratory Errors is an integral part & focusing on analytical, post-analytical process is the first step. Developing a reporting culture followed by thorough analysis and implementation of appropriate corrective, preventive actions is required.
Overview of analytical method validationprarkash_dra
Validation is an important feature in any method of measurement because it is closely related to the quality of the results. A method of analysis is characterized by its performance parameters, which have to be assessed if they are to provide the correct performance values. These performance values must be in accordance with previously defined requirements that the method of analysis should satisfy. But above all, the performance parameters depend on the type of method and its intrinsic characteristics. So depending on what is needed, the user must choose which method of analysis will best solve the analytical problem.
Quality Assurance of Laboratory Test Results based on ISO/IEC 17025PECB
The webinar covers:
• Introduction to QA in Laboratories
• Internal Quality Control Techniques
• External Quality Control Techniques
Presenter:
This webinar was presented by Hamidreza Dehnad, PECB Certified Trainer and CEO of Pasargad Quality Pioneers (PQP).
Link of the recorded session published on YouTube: https://youtu.be/IbWcJQDULYA
Quality in clinical laboratory is a continuous journey of improving processes through team work, innovative solutions, regulatory compliance with final objective to meet the evolving needs of clinicians & patients.
Quality control (QC) is a procedure or set of procedures intended to ensure that a manufactured product or performed service adheres to a defined set of quality criteria or meets the requirements of the client or customer. QC is similar to, but not identical with, quality assurance (QA).
QC IN clinical biochemistry labs and hospitals
Basic QC Statistics - Improving Laboratory Performance Through Quality Contro...Randox
Randox Quality Control's latest educational guide examines Internal Quality Control, External Quality Assessment, Why laboratories should run QC, How often laboratories should run QC, Basic QC statistics and the quality control process.
QUALITY
Conformance to the requirements of users or customers satisfaction of their needs and expectations.
Total Quality Management
A management approach that focuses on processes and their improvement.
In manufacturing operations, production management includes responsibility for product and process design, planning and control issues involving capacity and ...
This content is suitable for medical technologists/technicians/lab assistants/scientists writing the SMLTSA board exam. The content is also suitable for biomedical technology students and people also interested in learning about test methodologies used in medical technology. This chapter describes test quality assurance (QA) and quality control (QC). Please note that these notes are a collection I used to study for my board exam and train others who got distinctions using these.
Disclaimer: Credit goes to those who wrote the notes and the examiners of each exam question. Please use only as a reference guide and use your prescribed textbook for the latest and most accurate notes and ranges. The material here is not referenced as it is a collection of pieces of study notes from multiple people, and thus will not be held viable for any misinterpretations. Please use at your own discretion.
Explore natural remedies for syphilis treatment in Singapore. Discover alternative therapies, herbal remedies, and lifestyle changes that may complement conventional treatments. Learn about holistic approaches to managing syphilis symptoms and supporting overall health.
Title: Sense of Smell
Presenter: Dr. Faiza, Assistant Professor of Physiology
Qualifications:
MBBS (Best Graduate, AIMC Lahore)
FCPS Physiology
ICMT, CHPE, DHPE (STMU)
MPH (GC University, Faisalabad)
MBA (Virtual University of Pakistan)
Learning Objectives:
Describe the primary categories of smells and the concept of odor blindness.
Explain the structure and location of the olfactory membrane and mucosa, including the types and roles of cells involved in olfaction.
Describe the pathway and mechanisms of olfactory signal transmission from the olfactory receptors to the brain.
Illustrate the biochemical cascade triggered by odorant binding to olfactory receptors, including the role of G-proteins and second messengers in generating an action potential.
Identify different types of olfactory disorders such as anosmia, hyposmia, hyperosmia, and dysosmia, including their potential causes.
Key Topics:
Olfactory Genes:
3% of the human genome accounts for olfactory genes.
400 genes for odorant receptors.
Olfactory Membrane:
Located in the superior part of the nasal cavity.
Medially: Folds downward along the superior septum.
Laterally: Folds over the superior turbinate and upper surface of the middle turbinate.
Total surface area: 5-10 square centimeters.
Olfactory Mucosa:
Olfactory Cells: Bipolar nerve cells derived from the CNS (100 million), with 4-25 olfactory cilia per cell.
Sustentacular Cells: Produce mucus and maintain ionic and molecular environment.
Basal Cells: Replace worn-out olfactory cells with an average lifespan of 1-2 months.
Bowman’s Gland: Secretes mucus.
Stimulation of Olfactory Cells:
Odorant dissolves in mucus and attaches to receptors on olfactory cilia.
Involves a cascade effect through G-proteins and second messengers, leading to depolarization and action potential generation in the olfactory nerve.
Quality of a Good Odorant:
Small (3-20 Carbon atoms), volatile, water-soluble, and lipid-soluble.
Facilitated by odorant-binding proteins in mucus.
Membrane Potential and Action Potential:
Resting membrane potential: -55mV.
Action potential frequency in the olfactory nerve increases with odorant strength.
Adaptation Towards the Sense of Smell:
Rapid adaptation within the first second, with further slow adaptation.
Psychological adaptation greater than receptor adaptation, involving feedback inhibition from the central nervous system.
Primary Sensations of Smell:
Camphoraceous, Musky, Floral, Pepperminty, Ethereal, Pungent, Putrid.
Odor Detection Threshold:
Examples: Hydrogen sulfide (0.0005 ppm), Methyl-mercaptan (0.002 ppm).
Some toxic substances are odorless at lethal concentrations.
Characteristics of Smell:
Odor blindness for single substances due to lack of appropriate receptor protein.
Behavioral and emotional influences of smell.
Transmission of Olfactory Signals:
From olfactory cells to glomeruli in the olfactory bulb, involving lateral inhibition.
Primitive, less old, and new olfactory systems with different path
Tom Selleck Health: A Comprehensive Look at the Iconic Actor’s Wellness Journeygreendigital
Tom Selleck, an enduring figure in Hollywood. has captivated audiences for decades with his rugged charm, iconic moustache. and memorable roles in television and film. From his breakout role as Thomas Magnum in Magnum P.I. to his current portrayal of Frank Reagan in Blue Bloods. Selleck's career has spanned over 50 years. But beyond his professional achievements. fans have often been curious about Tom Selleck Health. especially as he has aged in the public eye.
Follow us on: Pinterest
Introduction
Many have been interested in Tom Selleck health. not only because of his enduring presence on screen but also because of the challenges. and lifestyle choices he has faced and made over the years. This article delves into the various aspects of Tom Selleck health. exploring his fitness regimen, diet, mental health. and the challenges he has encountered as he ages. We'll look at how he maintains his well-being. the health issues he has faced, and his approach to ageing .
Early Life and Career
Childhood and Athletic Beginnings
Tom Selleck was born on January 29, 1945, in Detroit, Michigan, and grew up in Sherman Oaks, California. From an early age, he was involved in sports, particularly basketball. which played a significant role in his physical development. His athletic pursuits continued into college. where he attended the University of Southern California (USC) on a basketball scholarship. This early involvement in sports laid a strong foundation for his physical health and disciplined lifestyle.
Transition to Acting
Selleck's transition from an athlete to an actor came with its physical demands. His first significant role in "Magnum P.I." required him to perform various stunts and maintain a fit appearance. This role, which he played from 1980 to 1988. necessitated a rigorous fitness routine to meet the show's demands. setting the stage for his long-term commitment to health and wellness.
Fitness Regimen
Workout Routine
Tom Selleck health and fitness regimen has evolved. adapting to his changing roles and age. During his "Magnum, P.I." days. Selleck's workouts were intense and focused on building and maintaining muscle mass. His routine included weightlifting, cardiovascular exercises. and specific training for the stunts he performed on the show.
Selleck adjusted his fitness routine as he aged to suit his body's needs. Today, his workouts focus on maintaining flexibility, strength, and cardiovascular health. He incorporates low-impact exercises such as swimming, walking, and light weightlifting. This balanced approach helps him stay fit without putting undue strain on his joints and muscles.
Importance of Flexibility and Mobility
In recent years, Selleck has emphasized the importance of flexibility and mobility in his fitness regimen. Understanding the natural decline in muscle mass and joint flexibility with age. he includes stretching and yoga in his routine. These practices help prevent injuries, improve posture, and maintain mobilit
Title: Sense of Taste
Presenter: Dr. Faiza, Assistant Professor of Physiology
Qualifications:
MBBS (Best Graduate, AIMC Lahore)
FCPS Physiology
ICMT, CHPE, DHPE (STMU)
MPH (GC University, Faisalabad)
MBA (Virtual University of Pakistan)
Learning Objectives:
Describe the structure and function of taste buds.
Describe the relationship between the taste threshold and taste index of common substances.
Explain the chemical basis and signal transduction of taste perception for each type of primary taste sensation.
Recognize different abnormalities of taste perception and their causes.
Key Topics:
Significance of Taste Sensation:
Differentiation between pleasant and harmful food
Influence on behavior
Selection of food based on metabolic needs
Receptors of Taste:
Taste buds on the tongue
Influence of sense of smell, texture of food, and pain stimulation (e.g., by pepper)
Primary and Secondary Taste Sensations:
Primary taste sensations: Sweet, Sour, Salty, Bitter, Umami
Chemical basis and signal transduction mechanisms for each taste
Taste Threshold and Index:
Taste threshold values for Sweet (sucrose), Salty (NaCl), Sour (HCl), and Bitter (Quinine)
Taste index relationship: Inversely proportional to taste threshold
Taste Blindness:
Inability to taste certain substances, particularly thiourea compounds
Example: Phenylthiocarbamide
Structure and Function of Taste Buds:
Composition: Epithelial cells, Sustentacular/Supporting cells, Taste cells, Basal cells
Features: Taste pores, Taste hairs/microvilli, and Taste nerve fibers
Location of Taste Buds:
Found in papillae of the tongue (Fungiform, Circumvallate, Foliate)
Also present on the palate, tonsillar pillars, epiglottis, and proximal esophagus
Mechanism of Taste Stimulation:
Interaction of taste substances with receptors on microvilli
Signal transduction pathways for Umami, Sweet, Bitter, Sour, and Salty tastes
Taste Sensitivity and Adaptation:
Decrease in sensitivity with age
Rapid adaptation of taste sensation
Role of Saliva in Taste:
Dissolution of tastants to reach receptors
Washing away the stimulus
Taste Preferences and Aversions:
Mechanisms behind taste preference and aversion
Influence of receptors and neural pathways
Impact of Sensory Nerve Damage:
Degeneration of taste buds if the sensory nerve fiber is cut
Abnormalities of Taste Detection:
Conditions: Ageusia, Hypogeusia, Dysgeusia (parageusia)
Causes: Nerve damage, neurological disorders, infections, poor oral hygiene, adverse drug effects, deficiencies, aging, tobacco use, altered neurotransmitter levels
Neurotransmitters and Taste Threshold:
Effects of serotonin (5-HT) and norepinephrine (NE) on taste sensitivity
Supertasters:
25% of the population with heightened sensitivity to taste, especially bitterness
Increased number of fungiform papillae
Couples presenting to the infertility clinic- Do they really have infertility...Sujoy Dasgupta
Dr Sujoy Dasgupta presented the study on "Couples presenting to the infertility clinic- Do they really have infertility? – The unexplored stories of non-consummation" in the 13th Congress of the Asia Pacific Initiative on Reproduction (ASPIRE 2024) at Manila on 24 May, 2024.
Pulmonary Thromboembolism - etilogy, types, medical- Surgical and nursing man...VarunMahajani
Disruption of blood supply to lung alveoli due to blockage of one or more pulmonary blood vessels is called as Pulmonary thromboembolism. In this presentation we will discuss its causes, types and its management in depth.
Ethanol (CH3CH2OH), or beverage alcohol, is a two-carbon alcohol
that is rapidly distributed in the body and brain. Ethanol alters many
neurochemical systems and has rewarding and addictive properties. It
is the oldest recreational drug and likely contributes to more morbidity,
mortality, and public health costs than all illicit drugs combined. The
5th edition of the Diagnostic and Statistical Manual of Mental Disorders
(DSM-5) integrates alcohol abuse and alcohol dependence into a single
disorder called alcohol use disorder (AUD), with mild, moderate,
and severe subclassifications (American Psychiatric Association, 2013).
In the DSM-5, all types of substance abuse and dependence have been
combined into a single substance use disorder (SUD) on a continuum
from mild to severe. A diagnosis of AUD requires that at least two of
the 11 DSM-5 behaviors be present within a 12-month period (mild
AUD: 2–3 criteria; moderate AUD: 4–5 criteria; severe AUD: 6–11 criteria).
The four main behavioral effects of AUD are impaired control over
drinking, negative social consequences, risky use, and altered physiological
effects (tolerance, withdrawal). This chapter presents an overview
of the prevalence and harmful consequences of AUD in the U.S.,
the systemic nature of the disease, neurocircuitry and stages of AUD,
comorbidities, fetal alcohol spectrum disorders, genetic risk factors, and
pharmacotherapies for AUD.
The prostate is an exocrine gland of the male mammalian reproductive system
It is a walnut-sized gland that forms part of the male reproductive system and is located in front of the rectum and just below the urinary bladder
Function is to store and secrete a clear, slightly alkaline fluid that constitutes 10-30% of the volume of the seminal fluid that along with the spermatozoa, constitutes semen
A healthy human prostate measures (4cm-vertical, by 3cm-horizontal, 2cm ant-post ).
It surrounds the urethra just below the urinary bladder. It has anterior, median, posterior and two lateral lobes
It’s work is regulated by androgens which are responsible for male sex characteristics
Generalised disease of the prostate due to hormonal derangement which leads to non malignant enlargement of the gland (increase in the number of epithelial cells and stromal tissue)to cause compression of the urethra leading to symptoms (LUTS
Factory Supply Best Quality Pmk Oil CAS 28578–16–7 PMK Powder in Stockrebeccabio
Factory Supply Best Quality Pmk Oil CAS 28578–16–7 PMK Powder in Stock
Telegram: bmksupplier
signal: +85264872720
threema: TUD4A6YC
You can contact me on Telegram or Threema
Communicate promptly and reply
Free of customs clearance, Double Clearance 100% pass delivery to USA, Canada, Spain, Germany, Netherland, Poland, Italy, Sweden, UK, Czech Republic, Australia, Mexico, Russia, Ukraine, Kazakhstan.Door to door service
Hot Selling Organic intermediates
Ozempic: Preoperative Management of Patients on GLP-1 Receptor Agonists Saeid Safari
Preoperative Management of Patients on GLP-1 Receptor Agonists like Ozempic and Semiglutide
ASA GUIDELINE
NYSORA Guideline
2 Case Reports of Gastric Ultrasound
Ozempic: Preoperative Management of Patients on GLP-1 Receptor Agonists
Quality control.pptx
1. QUALITY CONTROL IN HEMATOLOGY
N. Madhumidha
I yr PG
Department of Pathology
2. • What is quality ?
– Means that a product should meet its specification.
• Quality Control
– Refers to the measure that must be included during each assay run to verify
that the test is working properly, according to pre established
specifications.
3. • Quality Assurance
– Defined as the overall program that ensures that the final results
reported by the laboratory are correct.
– Concerned with that the “ right test is carried out on the right
specimen and the right result and right interpretation is delivered
to the right person at the right time.”
4. Quality Assurance Quality Control
An overall management plan
to guarantee the integrity of
data
( the “system” )
A series of analytical
measurements used to assess
the quality of the analytical
data
( the “tool” )
6. • 3 major activities of quality assurance
– Preventive – activities that are done prior to the examination of the
specimen eg. Preventive maintainance and calibration of instruments,
orientation and training of personnel.
– Assessment – those activities that are done during testing to determine
whether the test system are performing correctly eg. The use of standard
and controls, maintainance of control charts.
– Corrective – those activities that are done, when error is detected to correct
the system. Eg. Equipment troubleshooting, recalibration of instruments.
7. • Objective
• Accuracy
– It is the closeness of the estimated value to the true mean.
– It can be checked by the use of reference materials which have been
assayed by independent methods of known precicion.
• Precision
– It is the closeness of repeated measures to each other.
20. Examination components
Test method/procedure
Reagents
Internal quality control
External quality control (proficiency testing)
Instrument maintenance
21. Internal quality control is a set of procedures for continuously assessing laboratory
work and emergent results .
It is primarily a check of precision.
It includes
Control charts with tests on control materials
Duplicate tests on all specimens or on a proportion of the specimens
Delta check, comparing current test results with previous results
Consistency of mean values of patient data;
Correlation check (e.g., blood film features or sensibility of interrelated
parameters)
INTERNAL QUALITY CONTROL
22. Control charts with tests on control materials
Samples of the control specimen are included in every batch of the
patient’s specimens and the results are checked on a control chart.
To check precision, it is not necessary to know the exact value of
the control specimen.
23. Control material
A control is a “ patient like ” sample composed of one or many
constituents whose concentration are known.
Controls are device or material for checking that the performance of a
test is constant.
Preferably one should have controls of high, normal and low values.
Two different concentrations are necessary for adequate statistical QC.
The same material can be used for external QC or also a calibrator.
Control specimen may be three types
Pure solutions
Liquid serum preparation
Lyophilized control specimen
24. Minimum of one level QC atleast once a day
Patient samples >25 per day – Employ 2 levels of QC atleast
once a day
Patient samples >75 per day – Employ 2 levels of QC atleast
twice a day
Control must be treated exactly like the patient’s
specimens
25. Calibrators
Solutions with specified defined concentration that are used to
set or calibrate an instrument.
Cannot be used as a control.
When used control to check the precision of a test, it is not
necessary to know the true concentration of the substance to be
measured.
But when the material is intended for use as a calibrator, it must
have an assigned value
26. Controls Calibrators
• Used to check calibration of a test
system
• Controls are pools of serum or
plasma
• Less expensive
• Add analytes to get normal and
abnormal controls
• Used to calibrate a test system
• Calibrators are extremely accurate
• Expensive
27. Duplicate test on patient’s specimen
It provide another way of checking the precision of routine
work.
Ten consecutive specimens are tested in duplicate under careful
condition.
Difference between the pairs of results are calculated and
standard deviation is derived.
Subsequent duplicate tests should not differ from each other by
more than 2SD
This method will detect random errors but it is not sensitive
It is impractical for routine blood counts in busy lab.
28. Delta Check
It rely on consecutive testing of a particular patient.
Comparison of current hematology results to the most recently
reported previous result for a given patient
29. Correlation Check
It implies that any unexpected result of a test must be checked to see whether
it can be explained on clinical ground or whether it correlates with other tests.
Eg. 1. Low MCHC confirmed by hypochromic red cells on peripheral smear.
2. High MCV must correlate with macrocytosis.
3. Marked leukocytosis, thrombocytopenia and thrombocytosis needs
peripheral smear examinations.
30. Bull’s Algorithm
Brain Bull ( an American hematologist) establish a new quality
control method to detect systematic error in erythrocyte indexes.
A Moving average is calculated instead of mean value
Its main idea is to estimate the mean value of the last twenty
patient’s value, including in them the mean of the batch of the
previous twenty value.
31. Since 1960s, many laboratories have participated in proficiency testing surveys
such as CAP survey program.
CLIA’88 mandated that all clinical laboratories should participate in a proficiency
testing survey atleast three times a year.
It consists of unknown samples of whole blood or lypholized serum/plasma
representing the values that would be expected in patients sample.
Samples sent to the laboratory and test with the normal sample batch with no
special treatment.
Result are sent to the sample provider for statistical analysis.
The survey provider determine the target value for each test result through
comparison studies with peer laboratories and establish the acceptable performance
ranges.
EXTERNAL QUALITY CONTROL
32.
33. Analysis of EQA data
Deviation index for CBC
Mean, SD are calculated by EQA lab comparing the
participating lab’s performance with peer laboratories and
with true value.
Performance is measured by DI
DI = ( actual result – mean) / SD
35. Random error
An error which varies in an unpredictable manner, in magnitude
and sign, when a large number of measurements of the same
quality are made under identical condition.
Systematic error
An error which, in the course of a number of measurements of
the same value of a given quantity, remains constant when
measurements are made under the same condition
ERRORS IN MEASUREMENTS
36.
37.
38.
39. Systematic error Random error
Errors within the test
system/method
Caused by incorrect calibration,
malfunction of components,
failure of some path of testing
process, change in reagents,
expired, improper storage
It affects accuracy
Errors occuring without
prediction/regularity
Caused by poor calibration,
instrument instability, operator
and temperature variabilty
It affects accuracy and precision
41. Mean – is the total score of all measurements divided by the number of
measurements.
STATISTICS OF QC - Mean
42. Standard deviation – is a measure of how much the data varies around the mean
Used to measure dispersion / scattering of a group of values around a mean
Primary indicator of precision
Measure of random error.
Standard deviation
43. Coefficient of variation – is SD expressed as a proportion of mean
It gives the relation of SD to the actual measurement
Comparison of overall precison, since the standard deviation typically
increases as the concentration of the analyte increases.
Coefficient of variation
44. Ranges of Control Charts
Once the mean and the SD derived, the range of acceptability can be assigned.
Using the SD, a chart can be developed to monitor the daily control values.
Usually the range of acceptability is + 3SD.
45. How to calculate control limits?
20-30 successive measurements from any control levels
SD and mean calculated
The range mean + 3SD is considered as trial limit
If the measurments exceeds the range mean + 3SD then the
outliner is rejected.
50. • A graphical method for displaying control results and evaluating whether a
procedure is in - control or out - of – control.
• The first step is to calculate the control limits. Standard deviation is commonly
used to set the limits.
• The chart is created for each test and level of control.
• Daily control values should be plotted against time.
• Lines are drawn from point to point.
Levey – Jennings ( L J ) chart
51.
52.
53.
54.
55. • Rules of how to use LJ chart correctly described by Dr. JAMES WESTGARD.
• Westgard has formulated rules to decide whether an analytical run is in – control or
out – of – control.
•These rules can be applied as single rules and as a group of rules ( multi rules )
•These rules can be applied only if your QCs are plotted with the range of 3SD.
WESTGARD RULES
56. •Have to understand 2 sets of nomenclatures
1. N and L
2. Within / across of run / material.
57. • N = Number of control measurements involved
• L = Limit exceeded.
OR
58. • Within run / Across material : At one day ( within one run ) all the levels of QC
are violated.
• Across run / Within material : Same level of QC will violate but in 2 or more
consecutive runs
Date QC levels
Day 1 Level 1 Level 2 Level 3
Day 2 Level 1 Level 2 Level 3
Day 3 Level 1 Level 2 Level 3
Date QC levels
Day 1 Level 1 Level 2 Level 3
Day 2 Level 1 Level 2 Level 3
Day 3 Level 1 Level 2 Level 3
59. • QC lies between mean and
1SD – no particular
nomenclature
• When going beyond 2SD –
called 2S violation
• When going beyond 3SD –
called 3S violation
60. • 1 control exceeding the 2SD limit
• Denotes a Random error or the
beginning of a systematic error.
• Even in the absence of any
analytical errors 4.5% of data
points in the region of 1:2S region.
• It can be considered as a warning
rule.
1 : 2S Rule
61. • 1 run exceeding the 3SD limit
• Denotes a Random error or the
beginning of a large systematic
error.
• A run is rejected when a single
control measurement exceeds the
3SD limit.
1 : 3S Rule
62. • 2 consecutive QC results greater
than 2s on the same side of the
mean.
• This rule identifies systematic
error only.
• 2 application to this rule :
•With in run ( in the 2 levels
of QC in the same run )
•Across run ( in the same QC
in 2 consecutive runs )
2 : 2s Rule
63. • 2 levels of control material with
4SD difference between the 2 data
points.
• Denotes a random error only.
R : 4s Rule
64. • 4 consecutive QC results greater
than 1s on the same side of the
mean.
• This rule identifies systematic
error only.
• 2 application to this rule :
•With in run
•Across run
4 : 1s Rule
65. • 10 consecutive QC results for one
level of control are on the side of
the mean or both levels of control
have five consecutive results are
on the same side of the mean.
• This rule identifies systematic
error.
•There are 6x, 8x, 10x, 12x
violations. All denotes systematic
errors.
10x Rule
67. It implies critical supervision of all aspects of laboratory tests.
Also includes maintenance and control of equipments and apparatus
It is necessary for correct interpretation of test results, for the lab to
establish normal reference values that are valid for their test methods.
PROFICIENCY SURVEILLANCE
68. Should have instruction manuals regarding proper use and
maintenance.
Should be monitored and recorded for quality control procedures,
function checks.
Date of last and next due maintenance as well as calibrations must
be clearly mentioned in the machine records.
QC - EQUIPMENT
69. • Either done in laboratory using calibrator materials
or done at the manufacturing site and a verification is done in
laboratory.
• Caibrator materials are specific.
CALIBRATION
70. • with a new instrument.
• when a specified time period is elapsed.
• when an instrument has had a shock or vibration which potentially
may have put it out of calibration.
• whenever observations appear questionable.
Need for calibration
71. To implement a QC program…
Establish written policies and procedures
Assign responsibility for monitoring and reviewing
Train staff
Obtain control material
Collect QC data
Set target values
Establish LJ chart
Routinely plot control data
Establish and implement troubleshooting and corrective action
protocols
Establish and maintain system for documentation.
73. LABORATORY QUALITY SYSTEM DOCUMENTS
Quality manual
Safety manual
Policies, procedures and processes
Management records
Technical records
Customer care and query / complaint resolution records.