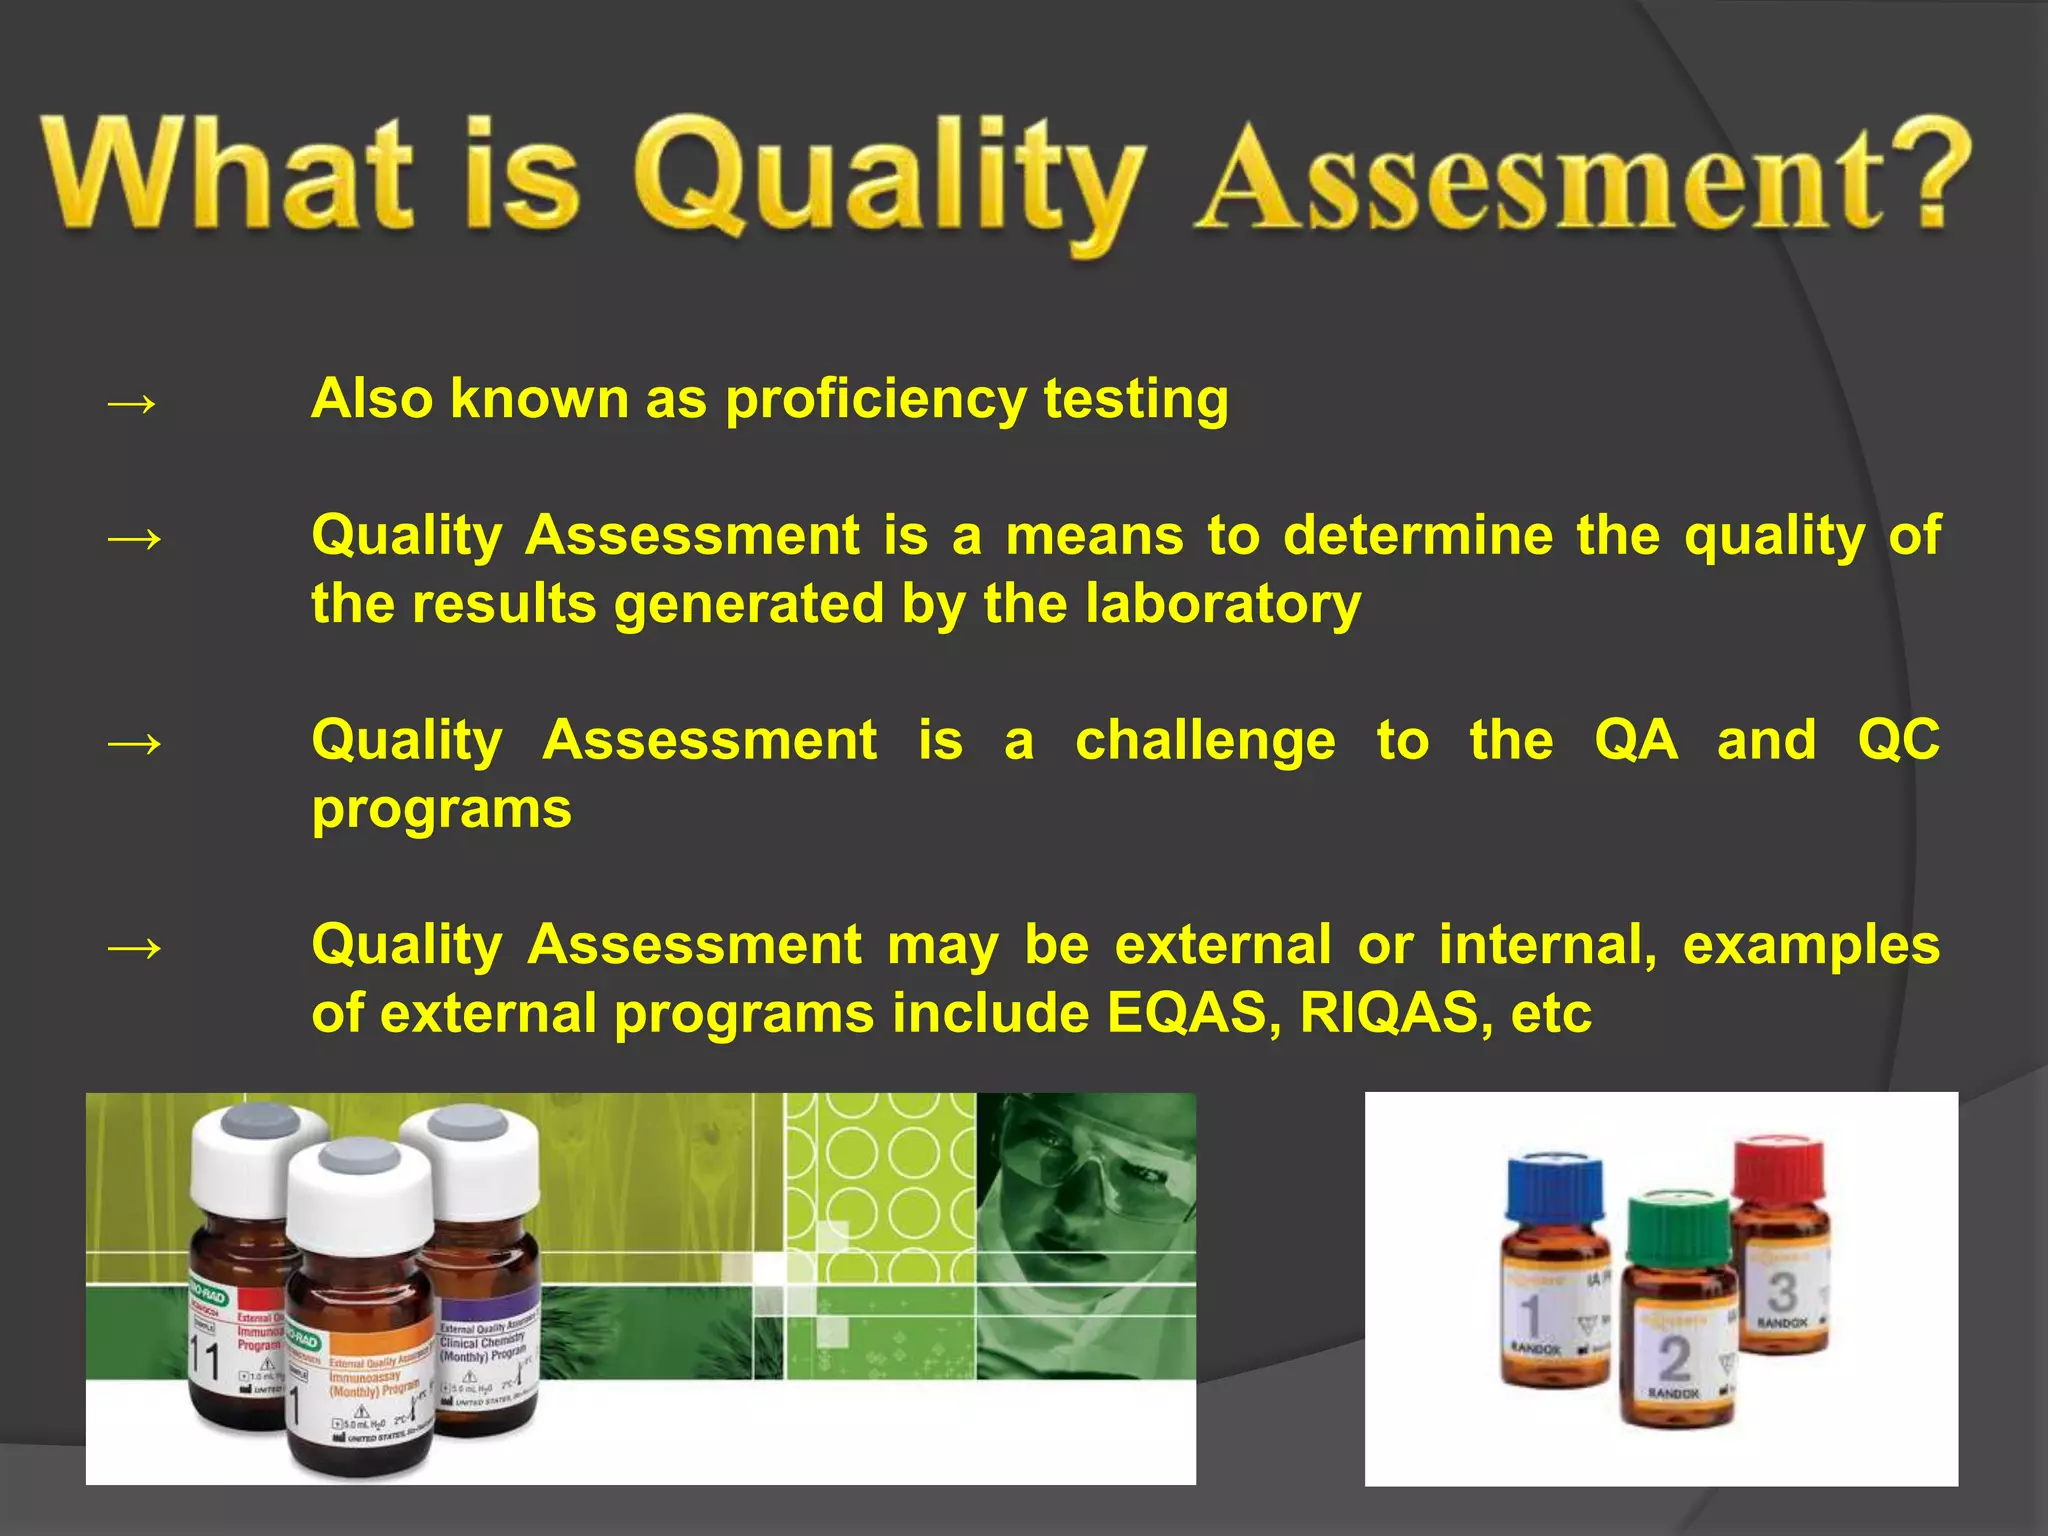
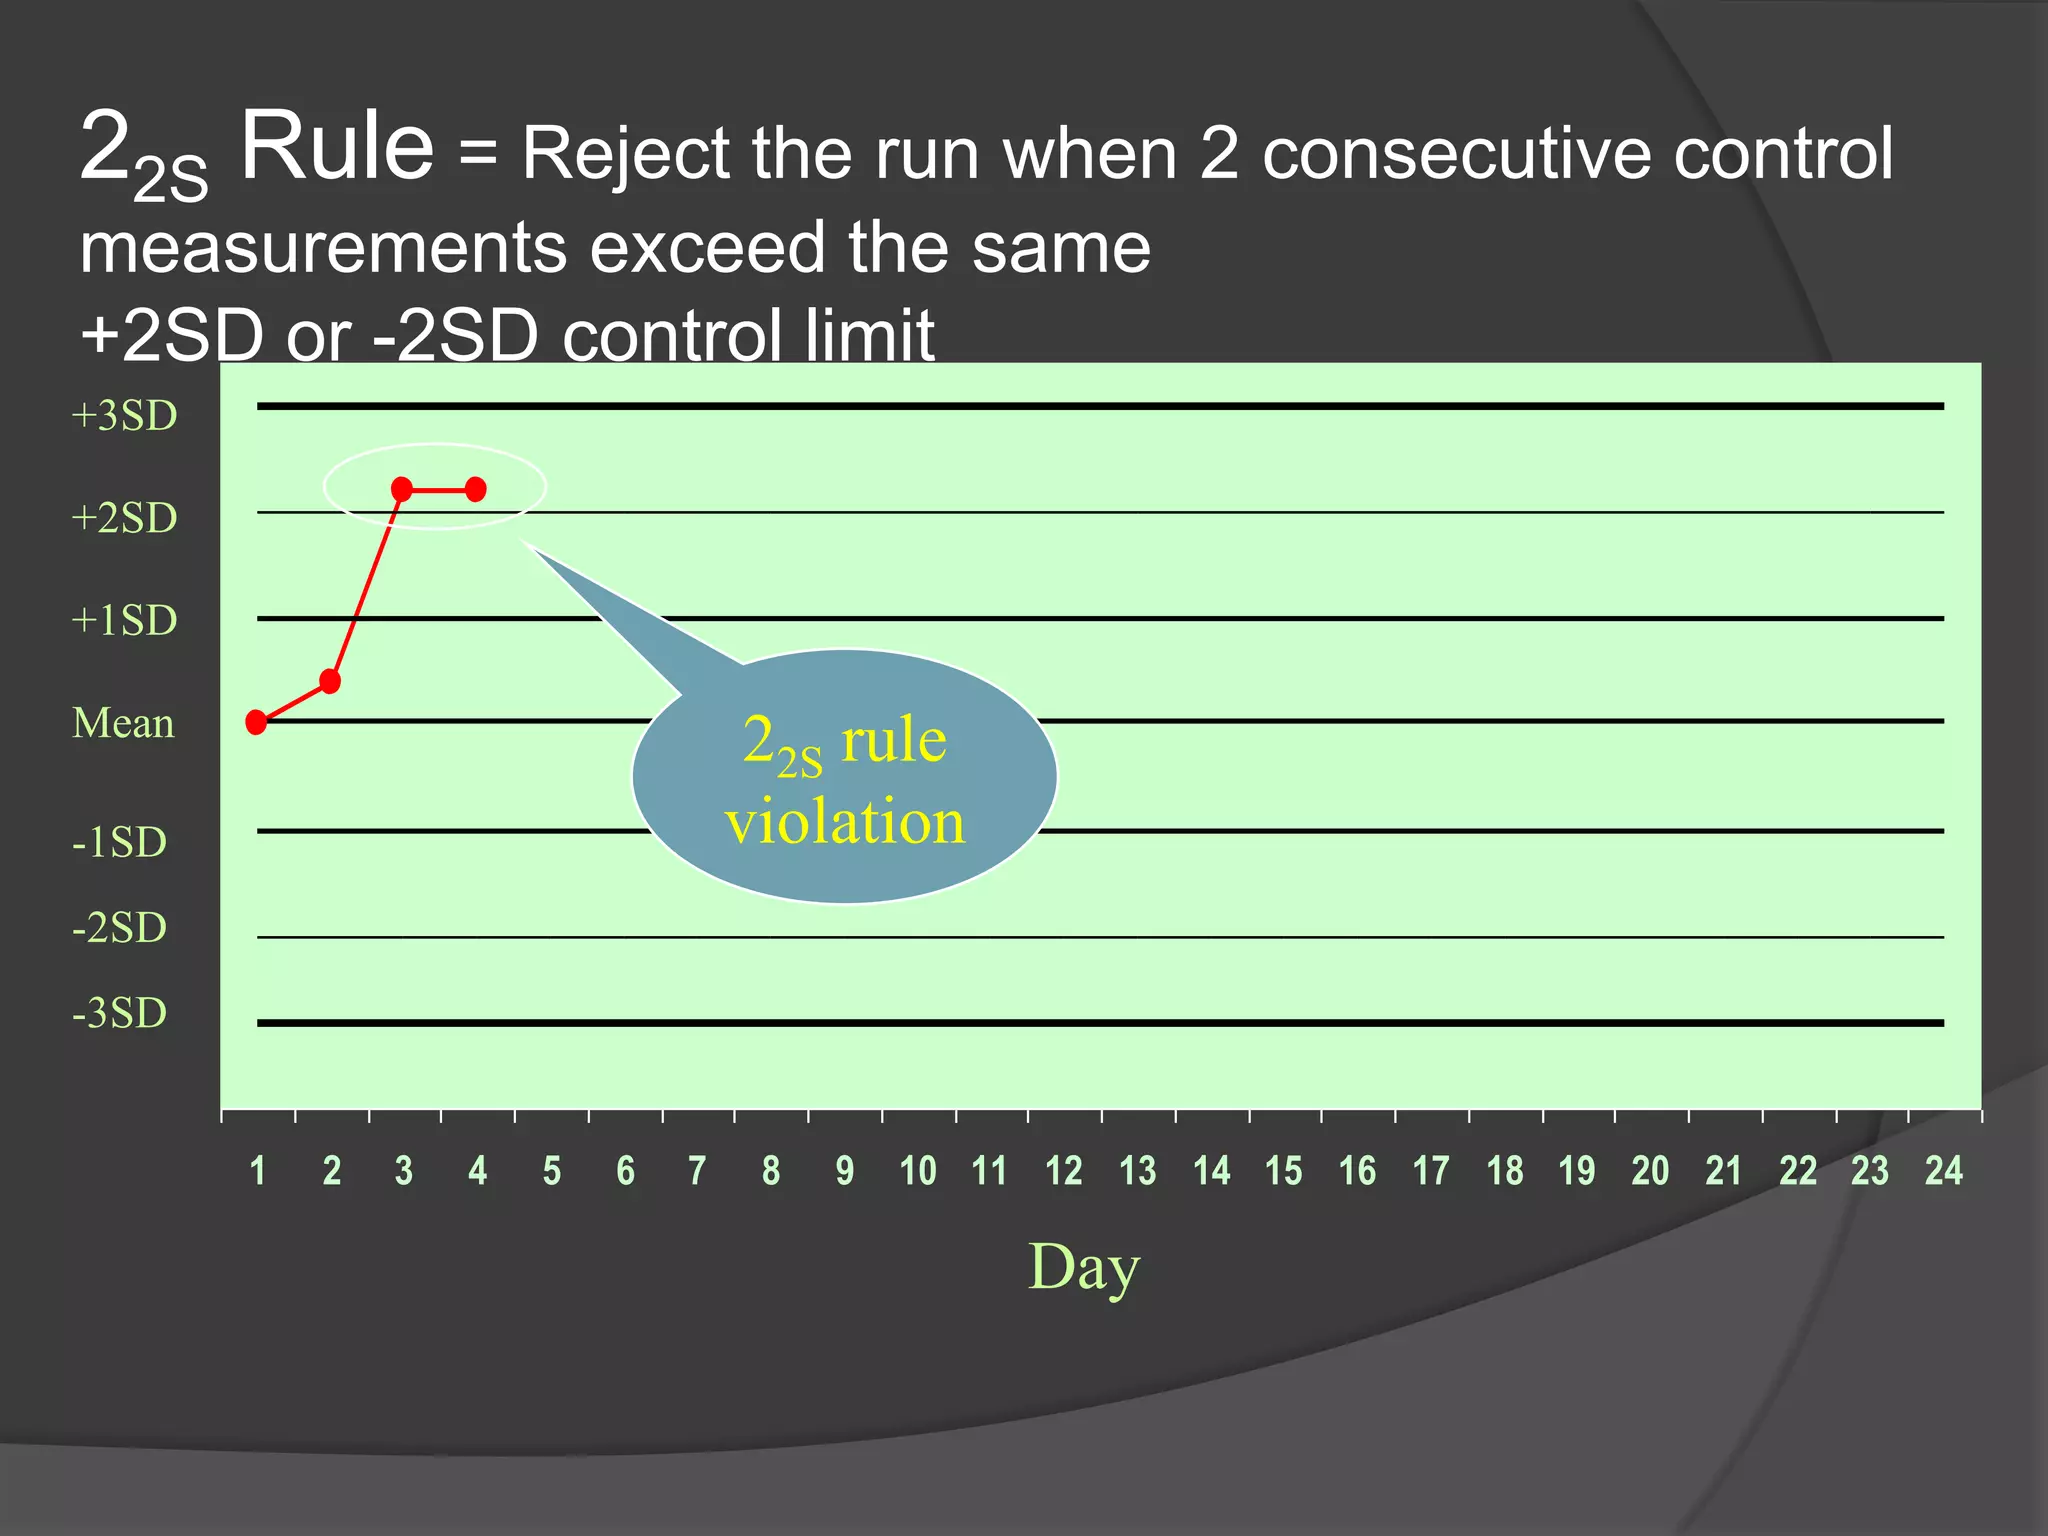
1.Quality Control
2.Quality Assurance
3.Quality Assessment
→ Quality control in the medical laboratory is a statistical
process used to monitor and evaluate the analytical process that
produces patient results.
→ Quality control refers to the measures that must be included
during each assay run to verify that the test is working properly
→ Quality Assurance is defined as the overall program that
ensures that the final results reported by the laboratory are
correct.
i. Quality assurance means quality enhancement
ii. Quality assurance aims at ensuring that the data provided are reliable
and relevant
iii. Quality assurance involves all measures that can be taken to improve
laboratory efficiency and effectiveness.
iv. It ensures laboratory performance with minimum risk for laboratory
workers and gives maximum benefit to the individual and community
The Quality Assurance Cycle
•Data and Lab
Management
•Safety
•Customer
Service
Patient/Client Prep
Sample Collection
Sample Receipt
and Accessioning
Sample Transport
Quality Control
Record Keeping
Reporting
Personnel Competency
Test Evaluations
Testing
Quality Assurance vs. Quality
Control
Quality Assurance Quality Control
An overall
management plan to
guarantee the
integrity of data
(The “system”)
A series of
analytical
measurements used
to assess the
quality of the
analytical data (The
“tools”)
“The aim of quality control is simply to ensure that the results
generated by the test are correct. However, quality assurance is
concerned with much more: that the right test is carried out on the
right specimen, and that the right result and right interpretation is
delivered to the right person at the right time”
→ Also known as proficiency testing
→ Quality Assessment is a means to determine the quality of
the results generated by the laboratory
→ Quality Assessment is a challenge to the QA and QC
programs
→ Quality Assessment may be external or internal, examples
of external programs include EQAS, RIQAS, etc
• Support provision of high
quality health-care
→ Reduce morbidity
→ Reduce mortality
→ Reduce economic loss
• Ensure credibility of lab
• Generate confidence in
lab results
Outside laboratory
Within laboratory
Sample
handling
Patient
preparation
Requisition
Sample
receiving
Sample
Collection
Sample
Transport
Patient
Doctor
Analysis
Reports
Results
→ Specimen
→ Collection technique
→ Storage and transportation
→ Quantity
→ Labeling
→ Mismatch of sample
→ Laboratory : No necessary
test capacity
EQUIPMENT RELIABILITY:
Meet technical needs, Compatible,
User & maintenance friendly, Cost
effective, Validated
Procedural
reliability using
Standard
Operating
Procedures
REAGENTS
STABILITY, INTEGRITY AND
EFFICIENCY:
Stable, Efficient, Desired
quality, Continuously
available, Validated SPECIFICITY & SENSITIVITY
OF SELECTED TEST:
Adequate ST, Sufficient
SP, cost effective, compatible
with, available infrastructure
and
expertise, interpretable, meets
the needs/
objectives, validated
PROFICIENCY OF
PERSONNEL:
Education, Training, Aptitu
de, Competence, Commitm
ent, Adequate
number, CME, Supervision,
Motivation
USE OF APPROPRIATE
CONTROLS:
• Internal: Labs, Calibrated
against national
• External: Supplied by
manufacturer, National,
International
DOCUMENTATION:
All the written
policies, plans, procedures, inst
ructions and records, quality
control procedures and recorded
test results involved in providing
a service or the manufacture of a
product
Assessment
 If you have not documented it,
you have NOT done it …
 If you have not documented,
it is a RUMOUR !!!
• Ensures processes and outcomes are traceable
• Processes can be audited, thus external
assessments can take place
• Tool for training
• Reminds you what to do next
 It is a comprehensively
written document that
describes the laboratory
procedure and all other
related issues
 Essential for ensuring
uniformity in laboratory
procedures
 Right recording
and reporting
 Right interpretation
 Range of normal values
 Right turnaround
time
 Report to right user
True Value
The known,
accepted value
of a
quantifiable
property
Measured Value
The result of an
individual’s
measurement of
a quantifiable
property
Accuracy
How well a
measurement
agrees with an
accepted value
Precision
How well a
series of
measurements
agree with each
other
• The degree of fluctuation in the measurements is
indicative of the “precision” of the assay.
• The closeness of measurements to the true
value is indicative of the “accuracy” of the assay.
• Quality Control is used to monitor both the
precision and the accuracy of the assay in order
to provide reliable results.
 True value - The known, accepted value of a
quantifiable property
 Accepted true value - the value approximating the
true value, the difference between the two values is
negligible.
 Error - the discrepancy between the result of a
measurement and the true (or accepted true value).
• Input data required - such as standards used, calibration values, and
values of physical constants.
• Inherent characteristics of the quantity being measured
• Instruments used - accuracy, repeatability.
• Observer fallibility - reading errors, blunders, equipment
selection, analysis and computation errors.
• Environment - any external influences affecting the measurement.
• Theory assumed - validity of mathematical methods and
approximations.
Systematic Error
Avoidable error
due to
controllable
variables in a
measurement.
Random Errors
Unavoidable errors
that are always
present in any
measurement.
Impossible to
eliminate
• An error which, in the course of a number of measurements of the
same value of a given quantity, remains constant when
measurements are made under the same conditions, or varies
according to a definite law when conditions change.
• Systematic errors create a characteristic bias in the test results and
can be accounted for by applying a correction.
• Systematic errors may be induced by factors such as variations in
incubation temperature, blockage of plate washer, change in the
reagent batch or modifications in testing method.
• The standard deviation (SD) is the square root of the variance
• it is the square root of the average squared deviation from
the mean
• SD is commonly used (rather than the variance) since it has the
same units as the mean and the original observations
• SD is the principle calculation used in the laboratory to
measure dispersion of a group of values around a mean
mg/dl
S 1
N
)
x
(x 2
1
variance
• For a set of data with a
normal distribution, a
value will fall within a
range of:
• +/- 1 SD 68.2% of
the time
• +/- 2 SD 95.5% of
the time
• +/- 3 SD 99.7% of
the time
68.2%
95.5%
99.7%
Frequency
-3s- 2s -1s Mean +1s +2s +3s
X
• In general, laboratories use the +/- 2 SD criteria
for the limits of the acceptable range for a test
• When the QC measurement falls within that
range, there is 95.5% confidence that the
measurement is correct
• Only 4.5% of the time will a value fall outside of
that range due to chance; more likely it will be
due to error
80
85
90
95
100
105
110
115
1 2 3 4 5 6 7 8 9 10 11 12 13 14 15 16 17 18 19 20 21 22 23 24
Mean
Day
+1SD
+2SD
+3SD
-1SD
-2SD
-3SD
• Ideally should have control values clustered about the mean
(+/-2 SD) with little variation in the upward or downward
direction
• Imprecision = large amount of scatter about the mean.
Usually caused by errors in technique
• Inaccuracy = may see as a trend or a shift, usually caused
by change in the testing process
• Random error = no pattern. Usually poor
technique, malfunctioning equipment
• Use Levey-Jennings chart
• Plot control values each run, make decision
regarding acceptability of run
• Monitor over time to evaluate the precision and
accuracy of repeated measurements
• Review charts at defined intervals, take necessary
action, and document
• Consider using Westgard Control Rules
• Uses premise that 95.5% of control values should fall
within ±2SD
• Commonly applied when two levels of control are
used
• Use in a sequential fashion
• “Multirule Quality Control” developed by Dr. James O. Westgard
based on statistical concepts
• Uses a combination of decision criteria or control rules
• Allows determination of whether an analytical run is “in-control”
or “out-of-control”
Dr. Westgard
 12S rule
13S rule
 22S rule
R4S rule
 41S rule
10X rule
Used when 2 levels of
control material are
analyzed per run.
• “warning rule”
• One of two control results falls outside ±2SD
• Alerts tech to possible problems
• Not cause for rejecting a run
• Must then evaluate the 13S rule
1 2 3 4 5 6 7 8 9 10 11 12 13 14 15 16 17 18 19 20 21 22 23 24
Mean
Day
+1SD
+2SD
+3SD
-1SD
-2SD
-3SD
12S rule
violation
• If either of the two control
results falls outside of
±3SD, rule is violated
• Run must be rejected
• If 13S not violated, check 22S
1 2 3 4 5 6 7 8 9 10 11 12 13 14 15 16 17 18 19 20 21 22 23 24
Mean
Day
+1SD
+2SD
+3SD
-1SD
-2SD
-3SD
13S rule
violation
• 2 consecutive control values for the same
level fall outside of ±2SD in the same
direction, or
• Both controls in the same run exceed ±2SD
• Patient results cannot be reported
• Requires corrective action
22S Rule = Reject the run when 2 consecutive control
measurements exceed the same
+2SD or -2SD control limit
1 2 3 4 5 6 7 8 9 10 11 12 13 14 15 16 17 18 19 20 21 22 23 24
Mean
Day
+1SD
+2SD
+3SD
-1SD
-2SD
-3SD
22S rule
violation
• One control exceeds the mean by –2SD,
and the other control exceeds the mean by
+2SD
• The range between the two results will
therefore exceed 4 SD
• Random error has occurred, test run must
be rejected
1 2 3 4 5 6 7 8 9 10 11 12 13 14 15 16 17 18 19 20 21 22 23 24
Mean
Day
+1SD
+2SD
+3SD
-1SD
-2SD
-3SD
R4S rule
violation
• Requires control data from previous
runs
• Four consecutive QC results for one
level of control are outside ±1SD, or
• Both levels of control have consecutive
results that are outside ±1SD
1 2 3 4 5 6 7 8 9 10 11 12 13 14 15 16 17 18 19 20 21 22 23 24
Mean
Day
+1SD
+2SD
+3SD
-1SD
-2SD
-3SD
10x rule
violation
• Warning rule = use other rules to inspect the control points
• Rejection rule = “out of control”
• Stop testing
• Identify and correct problem
• Repeat testing on patient samples and controls
• Do not report patient results until problem is solved and controls
indicate proper performance
• Solving “out-of-control” problems
 Policies and procedures for remedial action
 Troubleshooting
 Alternatives to run rejection
 It is a process of inspection of laboratories and their licensing by a
third party to ensure conformity to pre-defined criteria
 Very very long task (it may take around 2-3 years to follow the
roadmap)
 Last step of the entire process
 Quality assurance (procedures, way of working)
 IQC
 EQC
 Networking of the laboratories
 … and then only accreditation if 1-4 completed
• Quality is a lousy idea …if its only an Idea
• Quality assurance measures what a lab can do to
improve reliability
• Validate all test accuracy and reliability
• ALWAYS, ALWAYS, ALWAYS: DOCUMENT THE
PROBLEM AND CORRECTIVE ACTIONS
TAKEN!!!!!
quality control in clinical laboratory

quality control in clinical laboratory

  • 4.
  • 5.
    → Quality controlin the medical laboratory is a statistical process used to monitor and evaluate the analytical process that produces patient results. → Quality control refers to the measures that must be included during each assay run to verify that the test is working properly
  • 6.
    → Quality Assuranceis defined as the overall program that ensures that the final results reported by the laboratory are correct. i. Quality assurance means quality enhancement ii. Quality assurance aims at ensuring that the data provided are reliable and relevant iii. Quality assurance involves all measures that can be taken to improve laboratory efficiency and effectiveness. iv. It ensures laboratory performance with minimum risk for laboratory workers and gives maximum benefit to the individual and community
  • 7.
    The Quality AssuranceCycle •Data and Lab Management •Safety •Customer Service Patient/Client Prep Sample Collection Sample Receipt and Accessioning Sample Transport Quality Control Record Keeping Reporting Personnel Competency Test Evaluations Testing
  • 8.
    Quality Assurance vs.Quality Control Quality Assurance Quality Control An overall management plan to guarantee the integrity of data (The “system”) A series of analytical measurements used to assess the quality of the analytical data (The “tools”) “The aim of quality control is simply to ensure that the results generated by the test are correct. However, quality assurance is concerned with much more: that the right test is carried out on the right specimen, and that the right result and right interpretation is delivered to the right person at the right time”
  • 9.
    → Also knownas proficiency testing → Quality Assessment is a means to determine the quality of the results generated by the laboratory → Quality Assessment is a challenge to the QA and QC programs → Quality Assessment may be external or internal, examples of external programs include EQAS, RIQAS, etc
  • 10.
    • Support provisionof high quality health-care → Reduce morbidity → Reduce mortality → Reduce economic loss • Ensure credibility of lab • Generate confidence in lab results
  • 13.
  • 14.
    → Specimen → Collectiontechnique → Storage and transportation → Quantity → Labeling → Mismatch of sample → Laboratory : No necessary test capacity
  • 15.
    EQUIPMENT RELIABILITY: Meet technicalneeds, Compatible, User & maintenance friendly, Cost effective, Validated Procedural reliability using Standard Operating Procedures REAGENTS STABILITY, INTEGRITY AND EFFICIENCY: Stable, Efficient, Desired quality, Continuously available, Validated SPECIFICITY & SENSITIVITY OF SELECTED TEST: Adequate ST, Sufficient SP, cost effective, compatible with, available infrastructure and expertise, interpretable, meets the needs/ objectives, validated PROFICIENCY OF PERSONNEL: Education, Training, Aptitu de, Competence, Commitm ent, Adequate number, CME, Supervision, Motivation USE OF APPROPRIATE CONTROLS: • Internal: Labs, Calibrated against national • External: Supplied by manufacturer, National, International DOCUMENTATION: All the written policies, plans, procedures, inst ructions and records, quality control procedures and recorded test results involved in providing a service or the manufacture of a product Assessment
  • 16.
     If youhave not documented it, you have NOT done it …  If you have not documented, it is a RUMOUR !!!
  • 17.
    • Ensures processesand outcomes are traceable • Processes can be audited, thus external assessments can take place • Tool for training • Reminds you what to do next
  • 18.
     It isa comprehensively written document that describes the laboratory procedure and all other related issues  Essential for ensuring uniformity in laboratory procedures
  • 19.
     Right recording andreporting  Right interpretation  Range of normal values  Right turnaround time  Report to right user
  • 20.
    True Value The known, acceptedvalue of a quantifiable property Measured Value The result of an individual’s measurement of a quantifiable property
  • 21.
    Accuracy How well a measurement agreeswith an accepted value Precision How well a series of measurements agree with each other
  • 22.
    • The degreeof fluctuation in the measurements is indicative of the “precision” of the assay. • The closeness of measurements to the true value is indicative of the “accuracy” of the assay. • Quality Control is used to monitor both the precision and the accuracy of the assay in order to provide reliable results.
  • 25.
     True value- The known, accepted value of a quantifiable property  Accepted true value - the value approximating the true value, the difference between the two values is negligible.  Error - the discrepancy between the result of a measurement and the true (or accepted true value).
  • 26.
    • Input datarequired - such as standards used, calibration values, and values of physical constants. • Inherent characteristics of the quantity being measured • Instruments used - accuracy, repeatability. • Observer fallibility - reading errors, blunders, equipment selection, analysis and computation errors. • Environment - any external influences affecting the measurement. • Theory assumed - validity of mathematical methods and approximations.
  • 27.
    Systematic Error Avoidable error dueto controllable variables in a measurement. Random Errors Unavoidable errors that are always present in any measurement. Impossible to eliminate
  • 29.
    • An errorwhich, in the course of a number of measurements of the same value of a given quantity, remains constant when measurements are made under the same conditions, or varies according to a definite law when conditions change. • Systematic errors create a characteristic bias in the test results and can be accounted for by applying a correction. • Systematic errors may be induced by factors such as variations in incubation temperature, blockage of plate washer, change in the reagent batch or modifications in testing method.
  • 33.
    • The standarddeviation (SD) is the square root of the variance • it is the square root of the average squared deviation from the mean • SD is commonly used (rather than the variance) since it has the same units as the mean and the original observations • SD is the principle calculation used in the laboratory to measure dispersion of a group of values around a mean
  • 34.
  • 35.
    • For aset of data with a normal distribution, a value will fall within a range of: • +/- 1 SD 68.2% of the time • +/- 2 SD 95.5% of the time • +/- 3 SD 99.7% of the time 68.2% 95.5% 99.7% Frequency -3s- 2s -1s Mean +1s +2s +3s X
  • 36.
    • In general,laboratories use the +/- 2 SD criteria for the limits of the acceptable range for a test • When the QC measurement falls within that range, there is 95.5% confidence that the measurement is correct • Only 4.5% of the time will a value fall outside of that range due to chance; more likely it will be due to error
  • 38.
    80 85 90 95 100 105 110 115 1 2 34 5 6 7 8 9 10 11 12 13 14 15 16 17 18 19 20 21 22 23 24 Mean Day +1SD +2SD +3SD -1SD -2SD -3SD
  • 39.
    • Ideally shouldhave control values clustered about the mean (+/-2 SD) with little variation in the upward or downward direction • Imprecision = large amount of scatter about the mean. Usually caused by errors in technique • Inaccuracy = may see as a trend or a shift, usually caused by change in the testing process • Random error = no pattern. Usually poor technique, malfunctioning equipment
  • 40.
    • Use Levey-Jenningschart • Plot control values each run, make decision regarding acceptability of run • Monitor over time to evaluate the precision and accuracy of repeated measurements • Review charts at defined intervals, take necessary action, and document
  • 41.
    • Consider usingWestgard Control Rules • Uses premise that 95.5% of control values should fall within ±2SD • Commonly applied when two levels of control are used • Use in a sequential fashion
  • 42.
    • “Multirule QualityControl” developed by Dr. James O. Westgard based on statistical concepts • Uses a combination of decision criteria or control rules • Allows determination of whether an analytical run is “in-control” or “out-of-control” Dr. Westgard
  • 43.
     12S rule 13Srule  22S rule R4S rule  41S rule 10X rule Used when 2 levels of control material are analyzed per run.
  • 44.
    • “warning rule” •One of two control results falls outside ±2SD • Alerts tech to possible problems • Not cause for rejecting a run • Must then evaluate the 13S rule
  • 45.
    1 2 34 5 6 7 8 9 10 11 12 13 14 15 16 17 18 19 20 21 22 23 24 Mean Day +1SD +2SD +3SD -1SD -2SD -3SD 12S rule violation
  • 46.
    • If eitherof the two control results falls outside of ±3SD, rule is violated • Run must be rejected • If 13S not violated, check 22S
  • 47.
    1 2 34 5 6 7 8 9 10 11 12 13 14 15 16 17 18 19 20 21 22 23 24 Mean Day +1SD +2SD +3SD -1SD -2SD -3SD 13S rule violation
  • 48.
    • 2 consecutivecontrol values for the same level fall outside of ±2SD in the same direction, or • Both controls in the same run exceed ±2SD • Patient results cannot be reported • Requires corrective action
  • 49.
    22S Rule =Reject the run when 2 consecutive control measurements exceed the same +2SD or -2SD control limit 1 2 3 4 5 6 7 8 9 10 11 12 13 14 15 16 17 18 19 20 21 22 23 24 Mean Day +1SD +2SD +3SD -1SD -2SD -3SD 22S rule violation
  • 50.
    • One controlexceeds the mean by –2SD, and the other control exceeds the mean by +2SD • The range between the two results will therefore exceed 4 SD • Random error has occurred, test run must be rejected
  • 51.
    1 2 34 5 6 7 8 9 10 11 12 13 14 15 16 17 18 19 20 21 22 23 24 Mean Day +1SD +2SD +3SD -1SD -2SD -3SD R4S rule violation
  • 52.
    • Requires controldata from previous runs • Four consecutive QC results for one level of control are outside ±1SD, or • Both levels of control have consecutive results that are outside ±1SD
  • 54.
    1 2 34 5 6 7 8 9 10 11 12 13 14 15 16 17 18 19 20 21 22 23 24 Mean Day +1SD +2SD +3SD -1SD -2SD -3SD 10x rule violation
  • 55.
    • Warning rule= use other rules to inspect the control points • Rejection rule = “out of control” • Stop testing • Identify and correct problem • Repeat testing on patient samples and controls • Do not report patient results until problem is solved and controls indicate proper performance • Solving “out-of-control” problems  Policies and procedures for remedial action  Troubleshooting  Alternatives to run rejection
  • 60.
     It isa process of inspection of laboratories and their licensing by a third party to ensure conformity to pre-defined criteria  Very very long task (it may take around 2-3 years to follow the roadmap)  Last step of the entire process  Quality assurance (procedures, way of working)  IQC  EQC  Networking of the laboratories  … and then only accreditation if 1-4 completed
  • 62.
    • Quality isa lousy idea …if its only an Idea • Quality assurance measures what a lab can do to improve reliability • Validate all test accuracy and reliability • ALWAYS, ALWAYS, ALWAYS: DOCUMENT THE PROBLEM AND CORRECTIVE ACTIONS TAKEN!!!!!