2
Introduction – somethoughts
When evaluating laboratory results, how do we
determine that is normal or acceptable? That is:
What is “normal” or “OK”?
When does a laboratory test result become
“weird” or “abnormal” ? When do be become
uncomfortable with a result?
At some point we have to draw a “line in the
sand” … on this side of the line you’re normal
… on the other side of the line you’re abnormal.
4
Introduction – somethoughts
Where and how do we “draw the line” ?
Statistics are used to determine the
lines of ‘normal’ and ‘acceptable’.
5.
5
Introduction – somethoughts
Statistics is used to draw “lines in the sand” for patient
specimens, control specimens and calibrators
If the results are “normal” we ‘re comfortable about them
and don’t worry
But if they’re abnormal, we’re uncomfortable and we
fear that there is something wrong with the patient
or just as bad, something is wrong with the test
procedure .
6.
6
Statistical Concepts
Statistics is a (science of )branch of mathematics that
collects, analyzes, summarizes and presents
information about “observations.”
In the clinical lab, these “observations” are usually
numerical test results
A statistical analysis of lab test data can help us to
define normal ranges for patient’s ( normal and
abnormal ) and acceptable ranges for control
specimens ( “in” and “out” of control )
7.
7
Review ofStatistical concepts.
Measures of Central tendency
( how numerical values can be expressed as
a central value )
Dispersal about the central value
( how spread out are the numbers ? )
Using these two main ideas we can begin to
understand how basic statistics are used in
clinical chemistry to define normal values and
when our instruments are ( or are not )
generating expected numerical results
8.
8
Common Descriptivetechniques;
expressions of central tendency
Mean - Average value
Median - Middle observation
Mode - Most frequent observation
9.
9
Common Descriptivetechniques;
expressions of central tendency
Mean - Average value
The sum of all the observations
the number of observations
10.
10
Common Descriptivetechniques;
expressions of central tendency
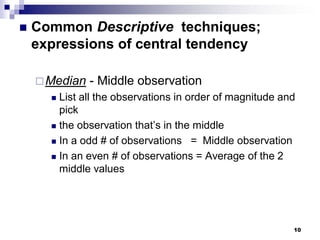
Median - Middle observation
List all the observations in order of magnitude and
pick
the observation that’s in the middle
In a odd # of observations = Middle observation
In an even # of observations = Average of the 2
middle values
11.
11
Common Descriptivetechniques;
expressions of central tendency
Mode - Most frequent observation The
observation that occurs most frequently
…
There may be more than one mode, or none
at all!
12.
12
Common Descriptivetechniques;
expressions of central tendency
All three (mean, median and mode) are
expressions of a “central” observation,
but they don’t say anything about the
observations as a whole – such as “Are they
close together?”
Although we can look at all the individual
observations, the mean, median and modes by
themselves do not give us any indication about
the dispersion of the observations.
13.
13
Common Descriptivetechniques;
expressions of central tendency
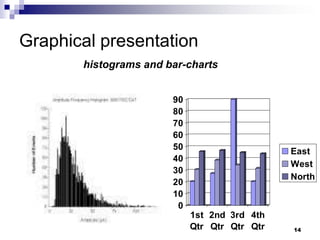
So we use additional methods to view
data, such as graphical presentations &
additional statistical / mathematical
manipulation of the data.
16
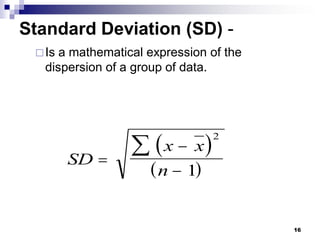
Standard Deviation (SD)-
Is a mathematical expression of the
dispersion of a group of data.
SD
x x
n
2
1
17.
17
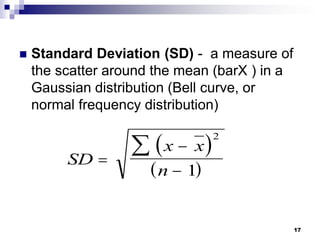
Standard Deviation(SD) - a measure of
the scatter around the mean (barX ) in a
Gaussian distribution (Bell curve, or
normal frequency distribution)
SD
x x
n
2
1
18.
18
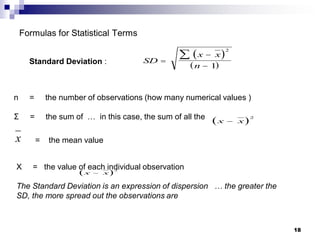
Formulas for StatisticalTerms
SD
x x
n
2
1
x
x x
2
Standard Deviation :
n = the number of observations (how many numerical values )
Σ = the sum of … in this case, the sum of all the
= the mean value
X = the value of each individual observation
The Standard Deviation is an expression of dispersion … the greater the
SD, the more spread out the observations are
x x
2
19.
19
Use of StandardDeviation in
QC
Clinical laboratories establish the
standard deviation for each laboratory
test or analysis
A common choice is plus or minus 2 s or
SD, most often written as ± 2 s or ± 2
SD
20.
20
Coefficient of Variation(CV) -
a way of expressing standard deviation in
terms of average value of the observations
used in the calculation
CV% =
Sandard Deviation
Mean
100
21.
21
Coefficient of Variation(CV) % =
Sandard Deviation
Mean
100
Again: The CV allows us to compare different sets of observations relative to
their means
You can’t use the SD to compare different groups of data because they
are measuring different observations - you can’t compare apples to
oranges. The CV can turn all groups of observations into a percentage of
their relative means - everything gets turned into “oranges.”
The smaller the CV, the more reproducible the
results: more values are closer to the mean.
22.
22
Quality Assurance &Quality Control
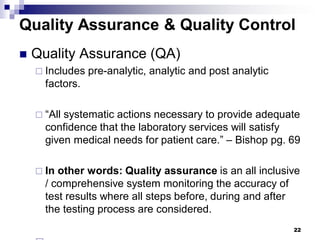
Quality Assurance (QA)
Includes pre-analytic, analytic and post analytic
factors.
“All systematic actions necessary to provide adequate
confidence that the laboratory services will satisfy
given medical needs for patient care.” – Bishop pg. 69
In other words: Quality assurance is an all inclusive
/ comprehensive system monitoring the accuracy of
test results where all steps before, during and after
the testing process are considered.
23.
23
Quality Assurance &Quality Control
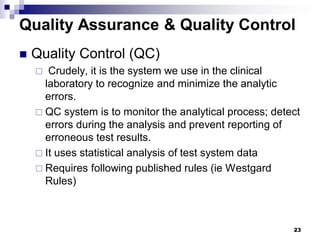
Quality Control (QC)
Crudely, it is the system we use in the clinical
laboratory to recognize and minimize the analytic
errors.
QC system is to monitor the analytical process; detect
errors during the analysis and prevent reporting of
erroneous test results.
It uses statistical analysis of test system data
Requires following published rules (ie Westgard
Rules)
24.
24
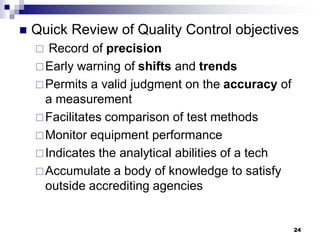
Quick Reviewof Quality Control objectives
Record of precision
Early warning of shifts and trends
Permits a valid judgment on the accuracy of
a measurement
Facilitates comparison of test methods
Monitor equipment performance
Indicates the analytical abilities of a tech
Accumulate a body of knowledge to satisfy
outside accrediting agencies
25.
25
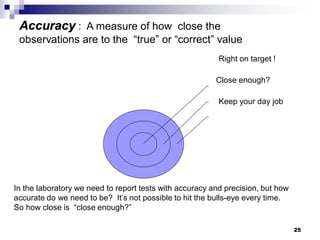
Right on target!
Close enough?
Keep your day job
In the laboratory we need to report tests with accuracy and precision, but how
accurate do we need to be? It’s not possible to hit the bulls-eye every time.
So how close is “close enough?”
Accuracy : A measure of how close the
observations are to the “true” or “correct” value
26.
26
Accuracy - anotherdefinition:
The relationship between the expected /
true result and the result actually achieved
from the procedure / analysis.
27.
27
Precision :
Observations thatare reproducible or
repeatable.
If you repeatedly test / assay a sample and
get wide variation in the assayed results,
you have low precision.
28.
Accuracy -closeness of a result
to the actual value
Precision – “reproducibility” or
closeness of values to each other
28
29.
29
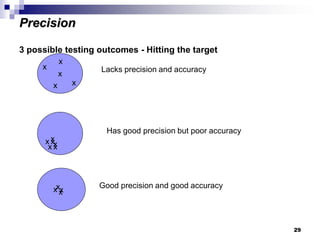
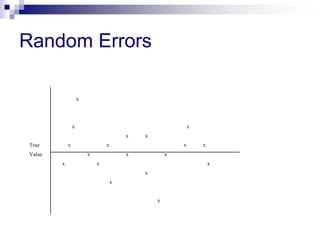
3 possible testingoutcomes - Hitting the target
x
x
x
x
x
x
Lacks precision and accuracy
x
x x
x
x
x
Has good precision but poor accuracy
x
x
x Good precision and good accuracy
Precision
30.
30
Accuracy versusPrecision
The laboratory must produce results that are
both accurate and reproducible.
31.
31
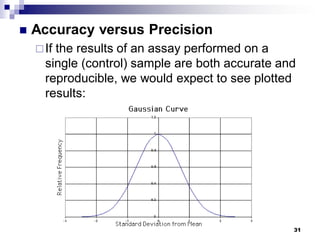
Accuracy versusPrecision
If the results of an assay performed on a
single (control) sample are both accurate and
reproducible, we would expect to see plotted
results:
32.
32
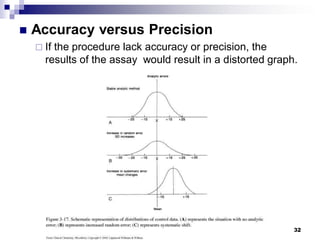
Accuracy versusPrecision
If the procedure lack accuracy or precision, the
results of the assay would result in a distorted graph.
33.
33
Classification ofError
***The variables:
Pre-analytical variables,
right specimen from right patient and in right condition
Analytical variables
all parts of testing procedure performed properly, controls in
range
Post analytical variables
Correct report to correct person, interpreted correct
All the phases of the testing process are subject to
errors and must be closely monitored, to maintain
Quality Assurance.
34.
Bias
Bias –the amount by which an analysis
varies from the correct result.
Example, If the Expected Value is 50 units,
and the result of an analysis is 47, the bias is
3 units.
34
35.
35
Classification of error
identifyexamples of:
Pre-analytical error -
Clerical
Poor collection
Analytical error
Random or indeterminate
Systematic or determinate
Post-analytical error
Clerical
Misinterpreted, etc….
36.
Errors inLaboratory Testing
Random or Systematic
Random Errors – cannot be absolutely identified
(Ex. Differences in techniques between workers,
specimen characteristics, etc.)
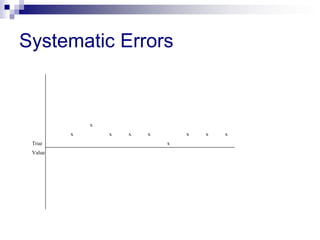
Systematic Errors – variation that may make
results consistently higher or lower than the mean
value for a control (Ex. Trouble with the instrument,
deteriorated reagents, etc.)
36
37.
Random Error
Anerror which varies in an unpredictable manner, in
magnitude and sign, when a large number of
measurements of the same quantity are made under
effectively identical conditions.
Random errors create a characteristic spread of results for
any test method and cannot be accounted for by applying
corrections. Random errors are difficult to eliminate but
repetition reduces the influences of random errors.
Examples of random errors include errors in pipetting and
changes in incubation period. Random errors can be
minimized by training, supervision and adherence to
standard operating procedures.
Systematic Error
Anerror which, in the course of a number of
measurements of the same value of a given quantity,
remains constant when measurements are made under the
same conditions, or varies according to a definite law
when conditions change.
Systematic errors create a characteristic bias in the test
results and can be accounted for by applying a
correction.
Systematic errors may be induced by factors such as
variations in incubation temperature, blockage of plate
washer, change in the reagent batch or modifications in
testing method.
Errors inLaboratory
Testing (cont’d)
Our goal is to identify
systematic errors and
eliminate them!
My control results are
“out of control”! Now
what?
41
42.
The followingsteps should be taken in order
when the control results are “out of control”
1. Look at the procedure and evaluate your technique
(Ex. Did I use the right lot #? Are my reagents in
date? Did I make an error in the procedure?)
2. Re-run the procedure, including controls
3. If results are still out of control, clean/perform
maintenance on equipment and/or open a new
batch of reagents
4. Contact supervisor
42
So the betterapproach is…
A systemic approach of
organization, plan, review, and
action gives you the
best chance of success.
47
48.
- Basic QualityControl for the
Clinical Laboratory
Introduction
The results obtained from laboratory
analyses are used to diagnose,
prescribe treatment, and/or monitor the
health or progress of the patient. Since
such importance is placed upon test
results, they must be as reliable and
accurate as possible.
48
49.
Elements ofa Total Quality Control
Program
Current procedure manual
Documentation
Qualified personnel
Fire and safety program
Use of appropriate standards and
controls
External proficiency testing
49
50.
Standards andControls
Standard
A substance that has an exact known value
and that, when accurately weighed or
measured, can produce a solution of an
exact concentration
Also called “reference materials”
Not usually used on a daily basis
Used to calibrate new instruments,
recalibrate instruments after repair, at
manufacturer’s recommended intervals, or
if a method is out of control
50
51.
Control
A solutionthat contains the same constituents
as those being analyzed in the patient sample
Most are commercially produced from pooled
sera
The manufacturer has analyzed each lot of
serum for a variety of test components and
the expected range of assay values for each
component is provided to the laboratory when
shipped
51
52.
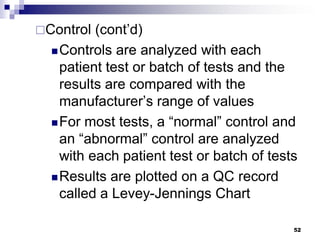
Control (cont’d)
Controls areanalyzed with each
patient test or batch of tests and the
results are compared with the
manufacturer’s range of values
For most tests, a “normal” control and
an “abnormal” control are analyzed
with each patient test or batch of tests
Results are plotted on a QC record
called a Levey-Jennings Chart
52
53.
Basic Quality Controlfor the
Clinical Laboratory
The use of a single control is for very basic
laboratory testing in waived CLIA laboratories
In moderately and highly complex CLIA testing
laboratories two controls (usually a “normal” and
an “abnormal”) must be run with each test or
batch of tests and Westgard Rules apply
53
54.
Basic Quality Controlfor the
Clinical Laboratory
Whenever a patient’s test or a batch of tests are
performed and the control(s) is “in control”, the
values obtained for the patient test(s) are
determined to be “acceptable” and can be
released to the doctor as accurate.
Whenever a patient’s test or a batch of tests are
performed and the control(s) is “out of control”,
the values obtained for the patient test(s) are
determined to be “not acceptable” and
CANNNOT be released to the doctor as
accurate until the problem is identified and
resolved.
54
55.
55
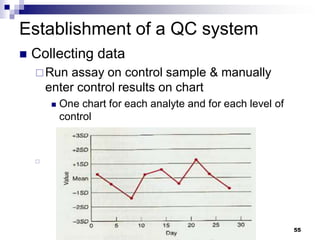
Establishment of aQC system
Collecting data
Run assay on control sample & manually
enter control results on chart
One chart for each analyte and for each level of
control
56.
56
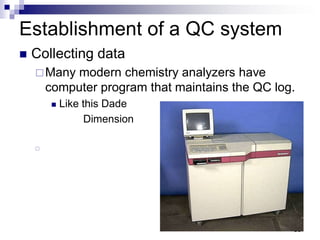
Establishment of aQC system
Collecting data
Many modern chemistry analyzers have
computer program that maintains the QC log.
Like this Dade
Dimension
57.
57
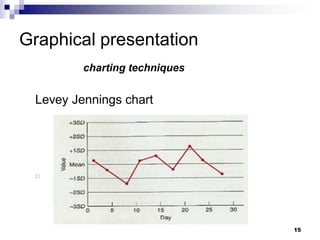
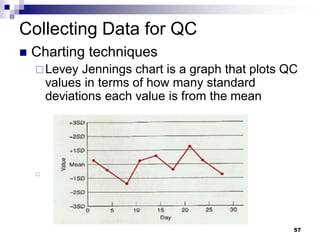
Collecting Data forQC
Charting techniques
Levey Jennings chart is a graph that plots QC
values in terms of how many standard
deviations each value is from the mean
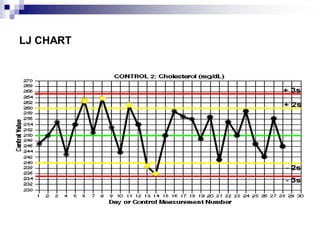
58.
58
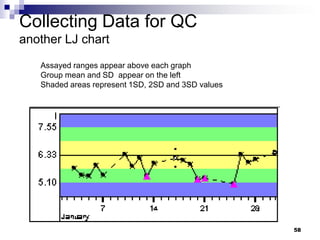
Collecting Data forQC
another LJ chart
Assayed ranges appear above each graph
Group mean and SD appear on the left
Shaded areas represent 1SD, 2SD and 3SD values
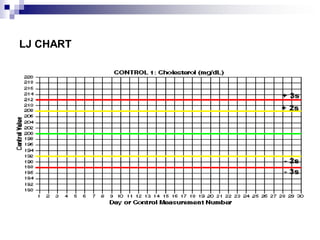
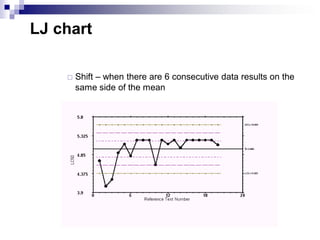
LJ chart
Shift– when there are 6 consecutive data results on the
same side of the mean
62.
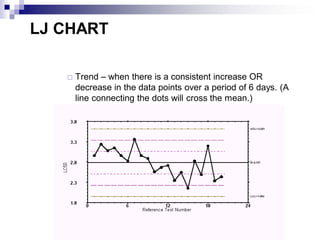
LJ CHART
Trend– when there is a consistent increase OR
decrease in the data points over a period of 6 days. (A
line connecting the dots will cross the mean.)
63.
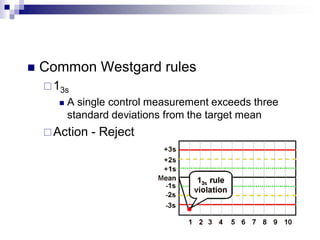
Common Westgardrules
13s
A single control measurement exceeds three
standard deviations from the target mean
Action - Reject
64.
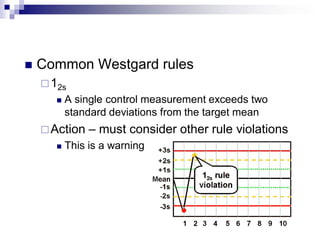
Common Westgardrules
12s
A single control measurement exceeds two
standard deviations from the target mean
Action – must consider other rule violations
This is a warning
65.
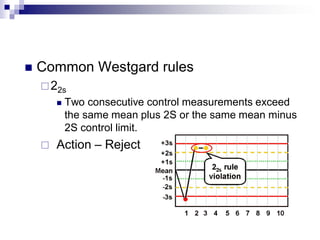
Common Westgardrules
22s
Two consecutive control measurements exceed
the same mean plus 2S or the same mean minus
2S control limit.
Action – Reject
66.
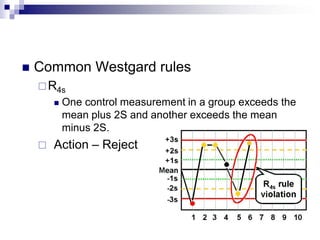
Common Westgardrules
R4s
One control measurement in a group exceeds the
mean plus 2S and another exceeds the mean
minus 2S.
Action – Reject
67.
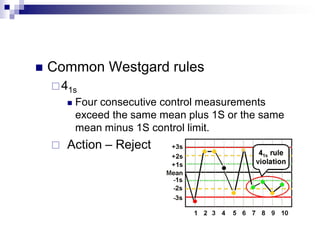
Common Westgardrules
41s
Four consecutive control measurements
exceed the same mean plus 1S or the same
mean minus 1S control limit.
Action – Reject
68.
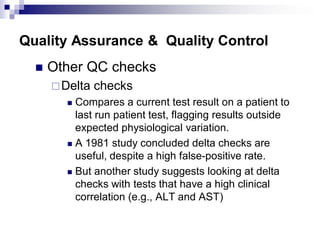
Quality Assurance &Quality Control
Other QC checks
Delta checks
Compares a current test result on a patient to
last run patient test, flagging results outside
expected physiological variation.
A 1981 study concluded delta checks are
useful, despite a high false-positive rate.
But another study suggests looking at delta
checks with tests that have a high clinical
correlation (e.g., ALT and AST)
70
Collecting Data forQC
Minimum number of determinations
Statistically should have at least 20
determinations to establish acceptable mean
and practical standard deviation.
71.
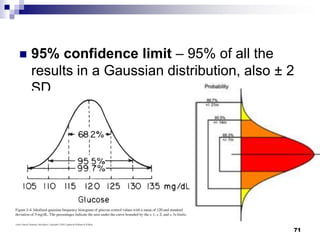
71
95% confidencelimit – 95% of all the
results in a Gaussian distribution, also ± 2
SD
72.
72
Using 95%confidence limits, how often will a control be
out of range (statistically)?
5% of the time,
That is 1 out of every 20 times!
73.
73
But what ifyour control specimen is “out of control?”
“Out of control” means that there is too much dispersion in
your result compared with the rest of the results – it’s
“weird”
This suggests that something is wrong with the process
that generated that observation
Patient test results cannot be reported to physicians when
there is something wrong with the testing process that is
generating inaccurate reports
Remember … No information is better than wrong
information
74.
74
But what ifyour control specimen is “out of control?”
Things that can go wrong and what to do: ie.
Corrective methods
Instrumentation malfunction ( fix the machine)
Reagents deteriorated, contaminated,
improperly prepared or simply used up (get
new reagents)
Tech error (identify error and repeat the test)
Control specimen is deteriorated or improperly
prepared (get new control)