


![Critical-size error
• ∆SEcrit = [(TEa - biasmeas) / smeas] - z
= Sigma – z
∆SEcrit = 2, means that a systematic shift equivalent to 2 times of the CV of the method
needs to be detected by the QC procedure.
• ∆REcrit = (TEa - biasmeas) / z smeas
= Sigma / z
∆REcrit = 2, means a 2-fold increase in the CV needs to be detected by the QC procedure.
z defines the tail of the distribution that is allowed to exceed the quality requirement
and is often chosen as 1.65 to set a maximum defect rate of 0.05 or 5%.](https://image.slidesharecdn.com/ddqcpresentation-210723064608/75/Quality-Control-in-Clinical-Chemistry-63-2048.jpg)


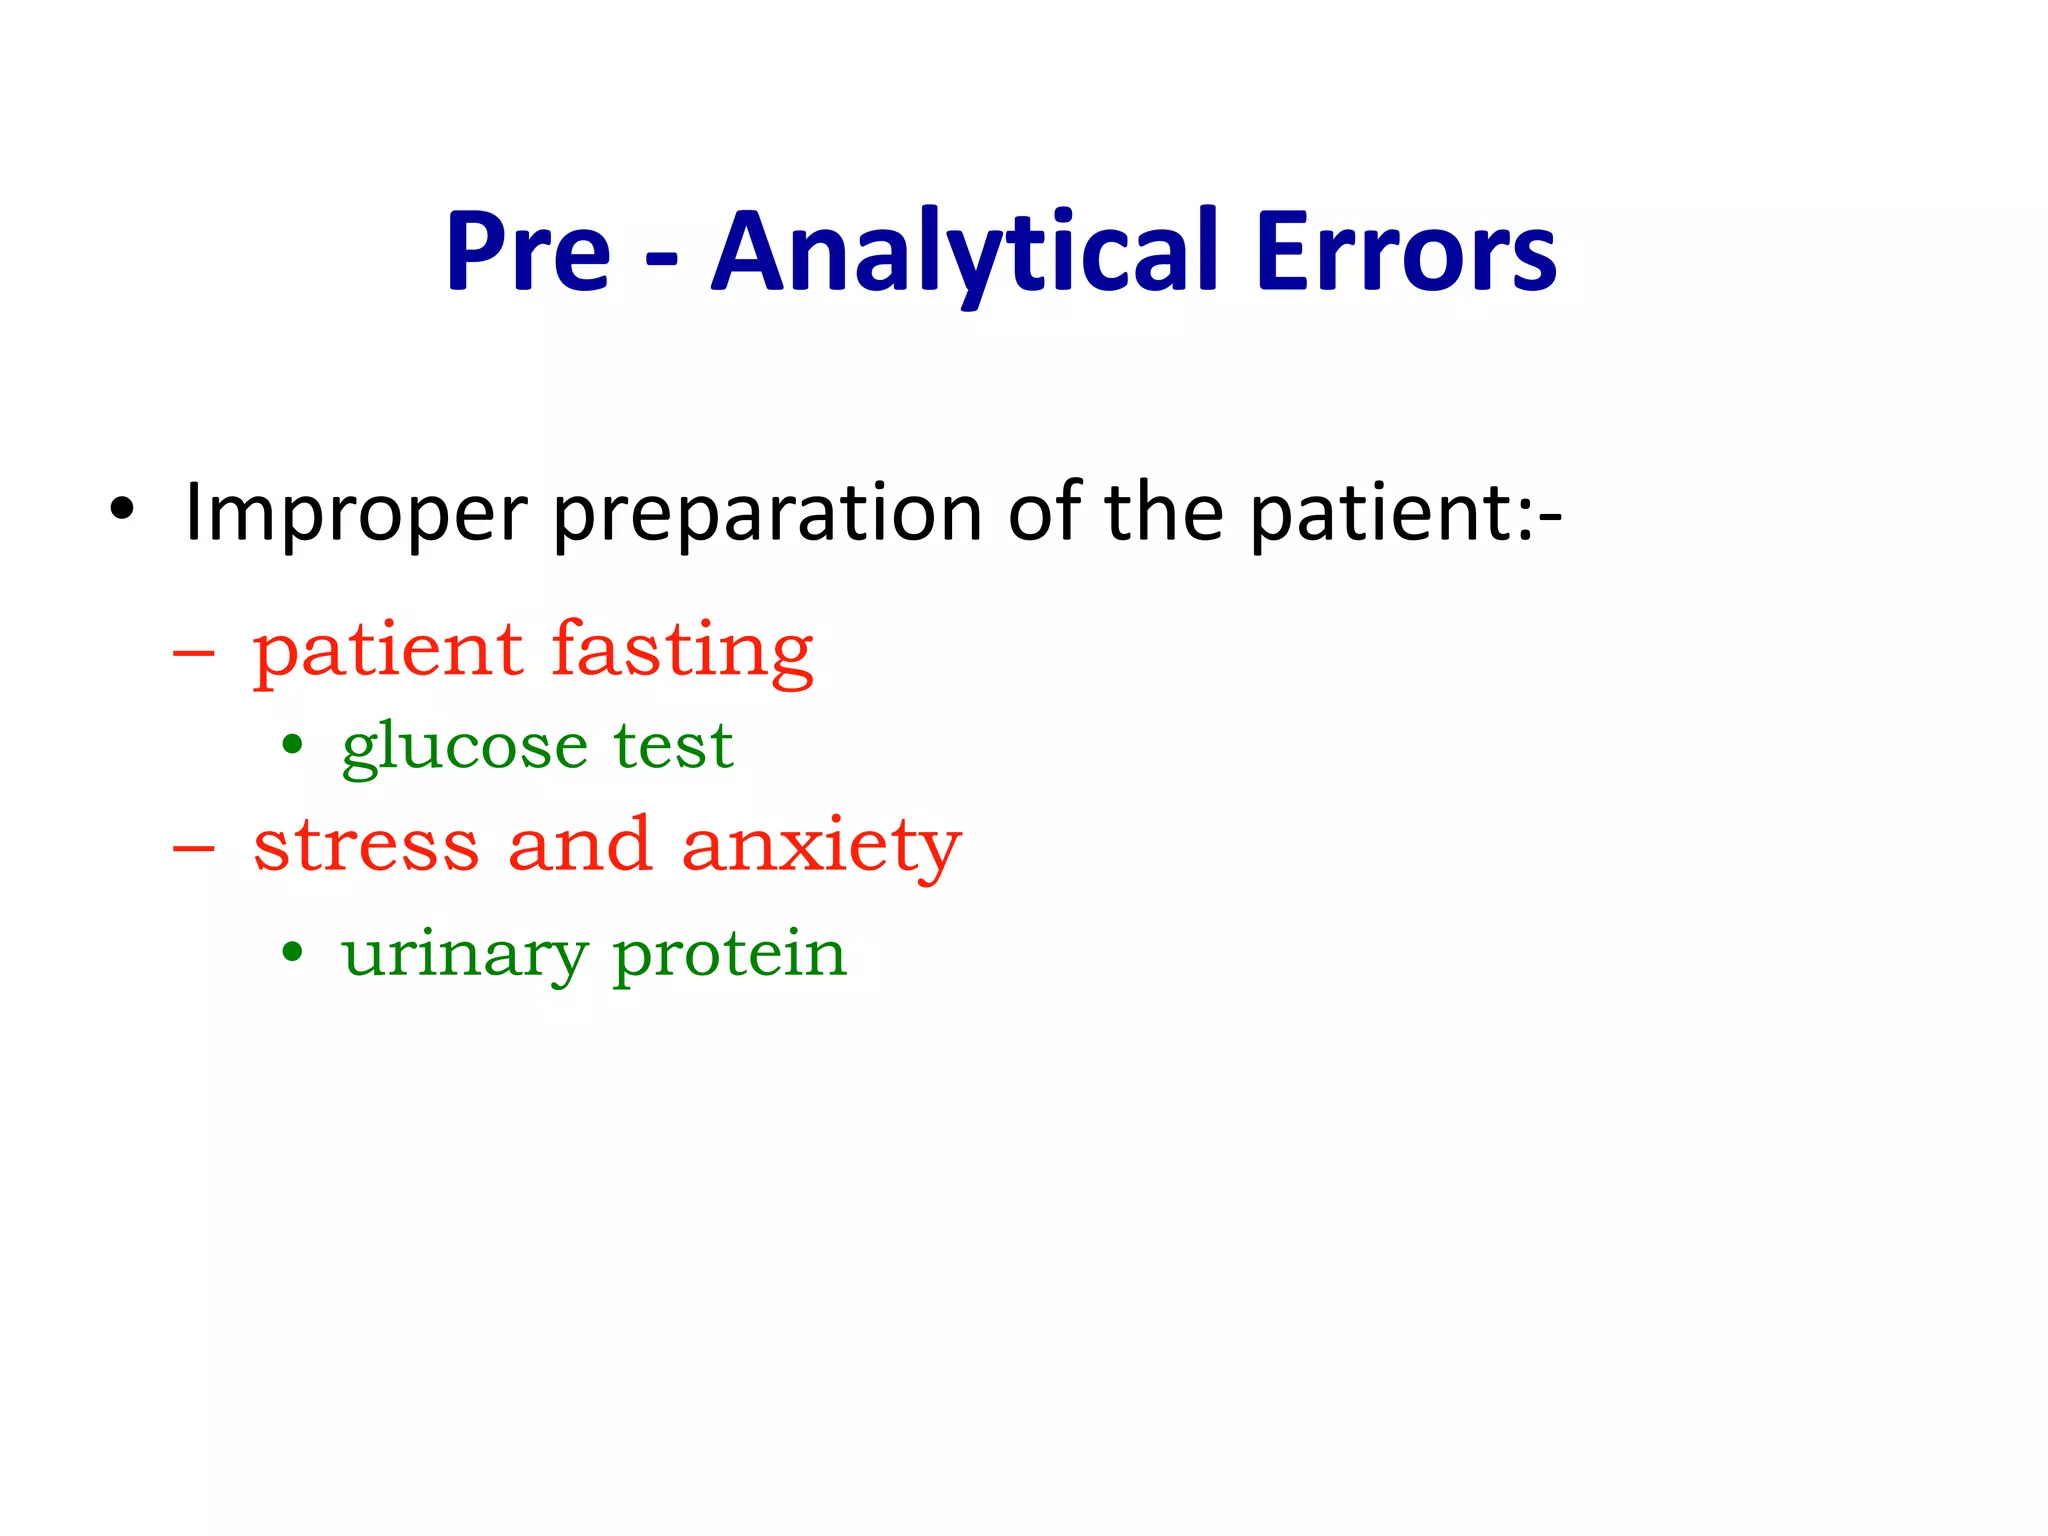
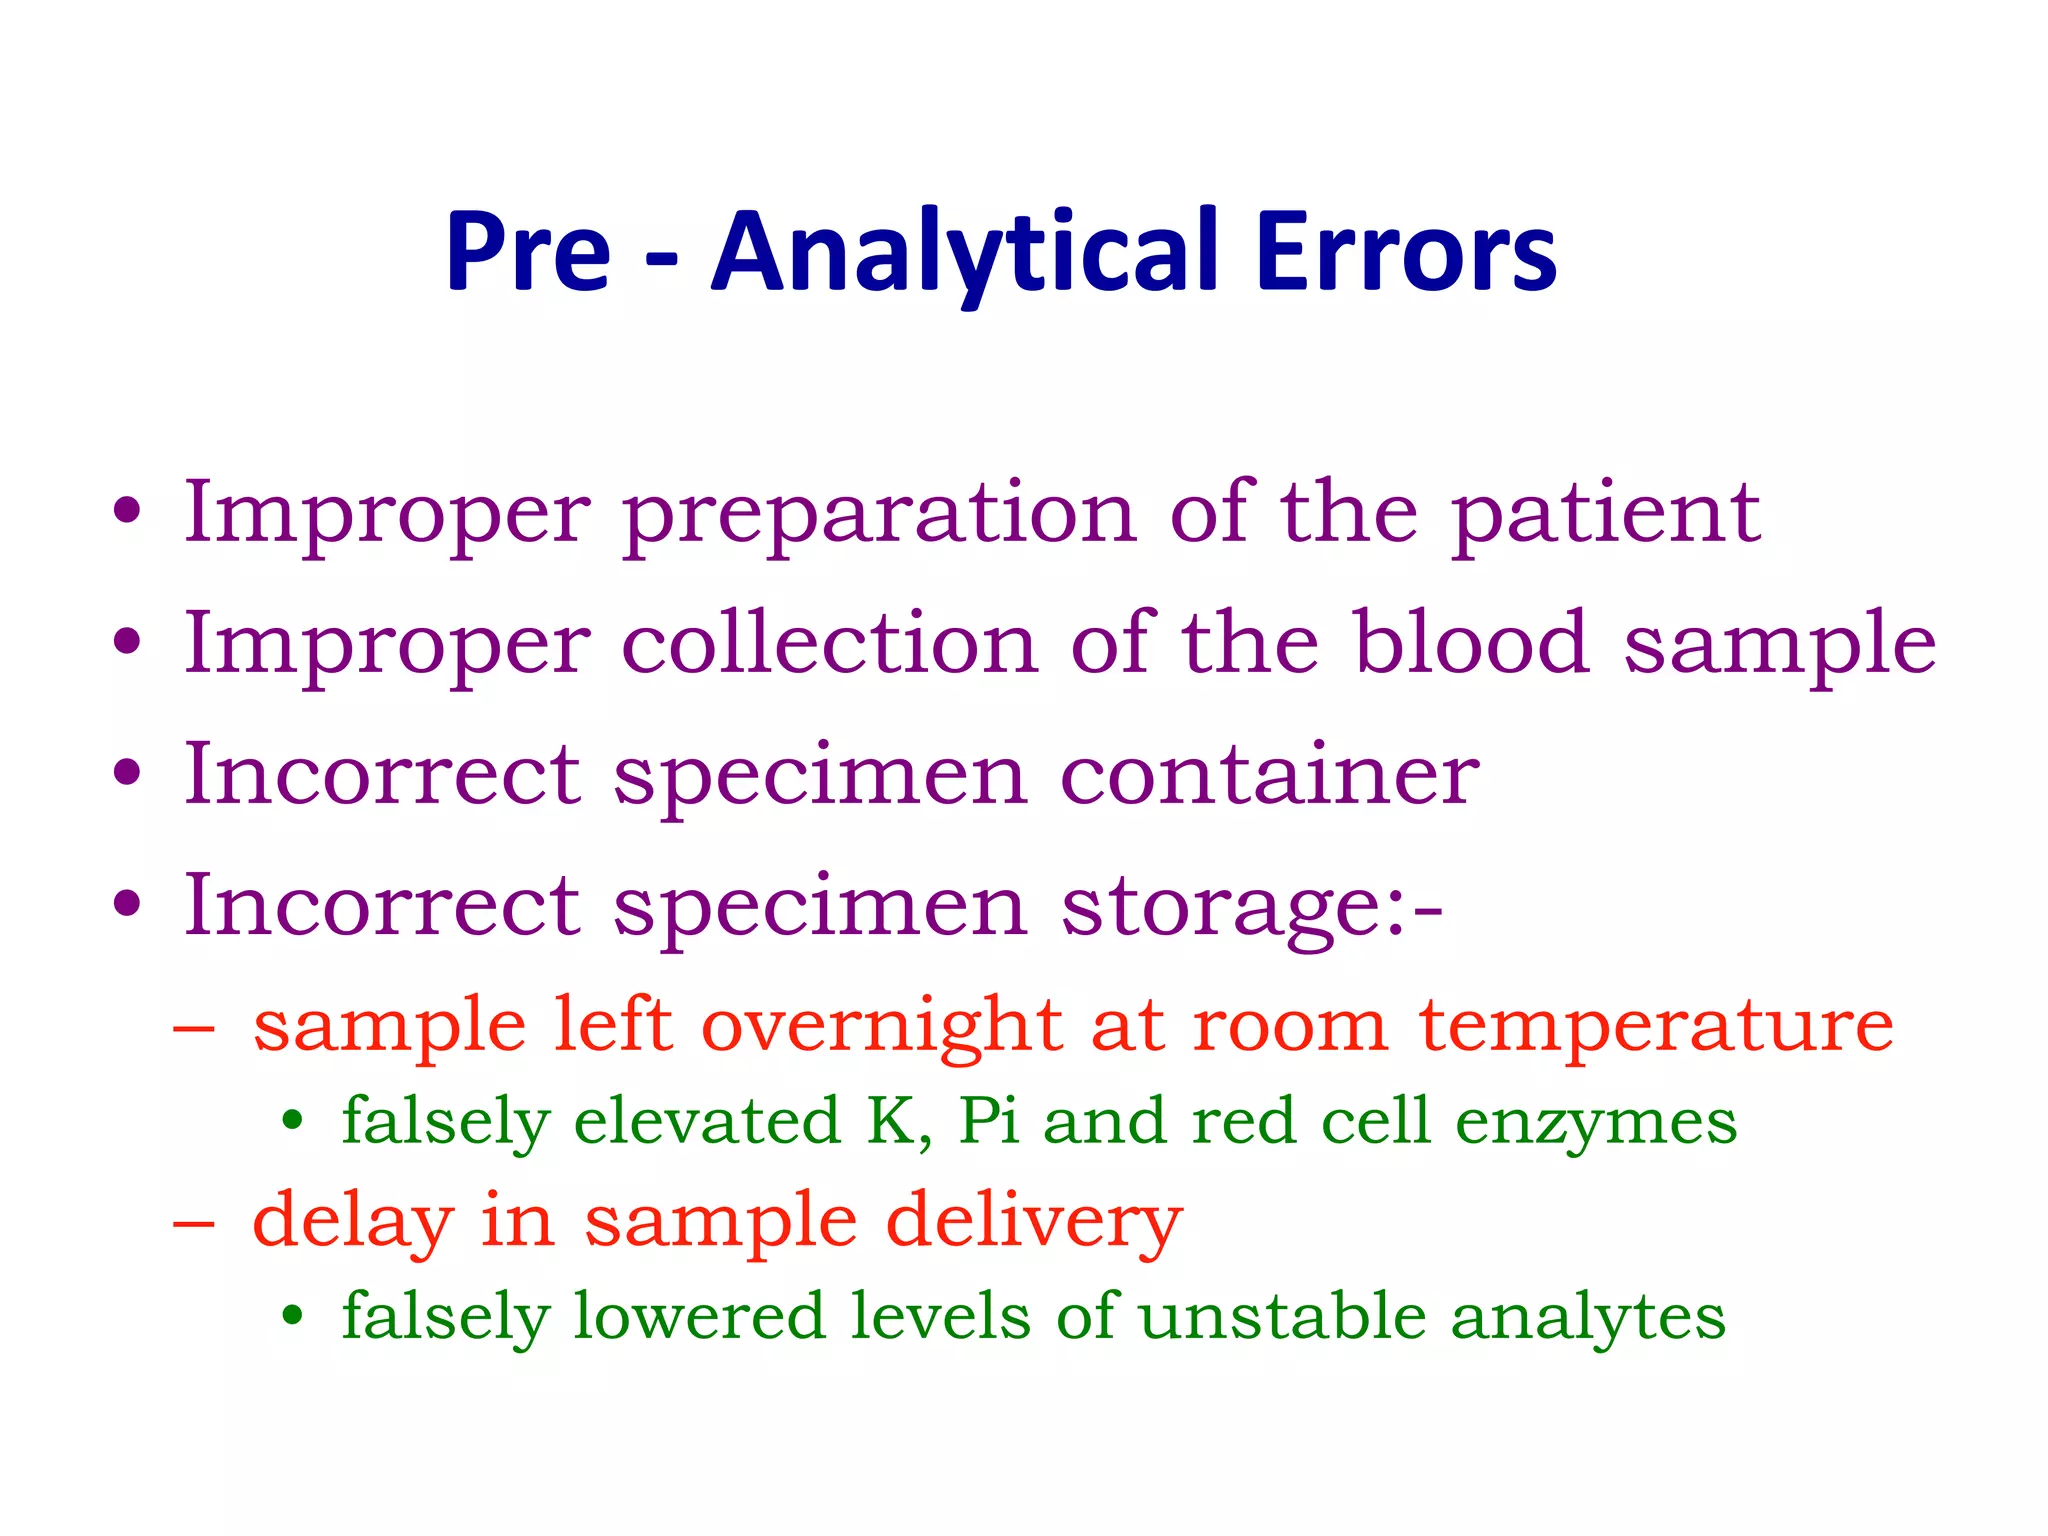
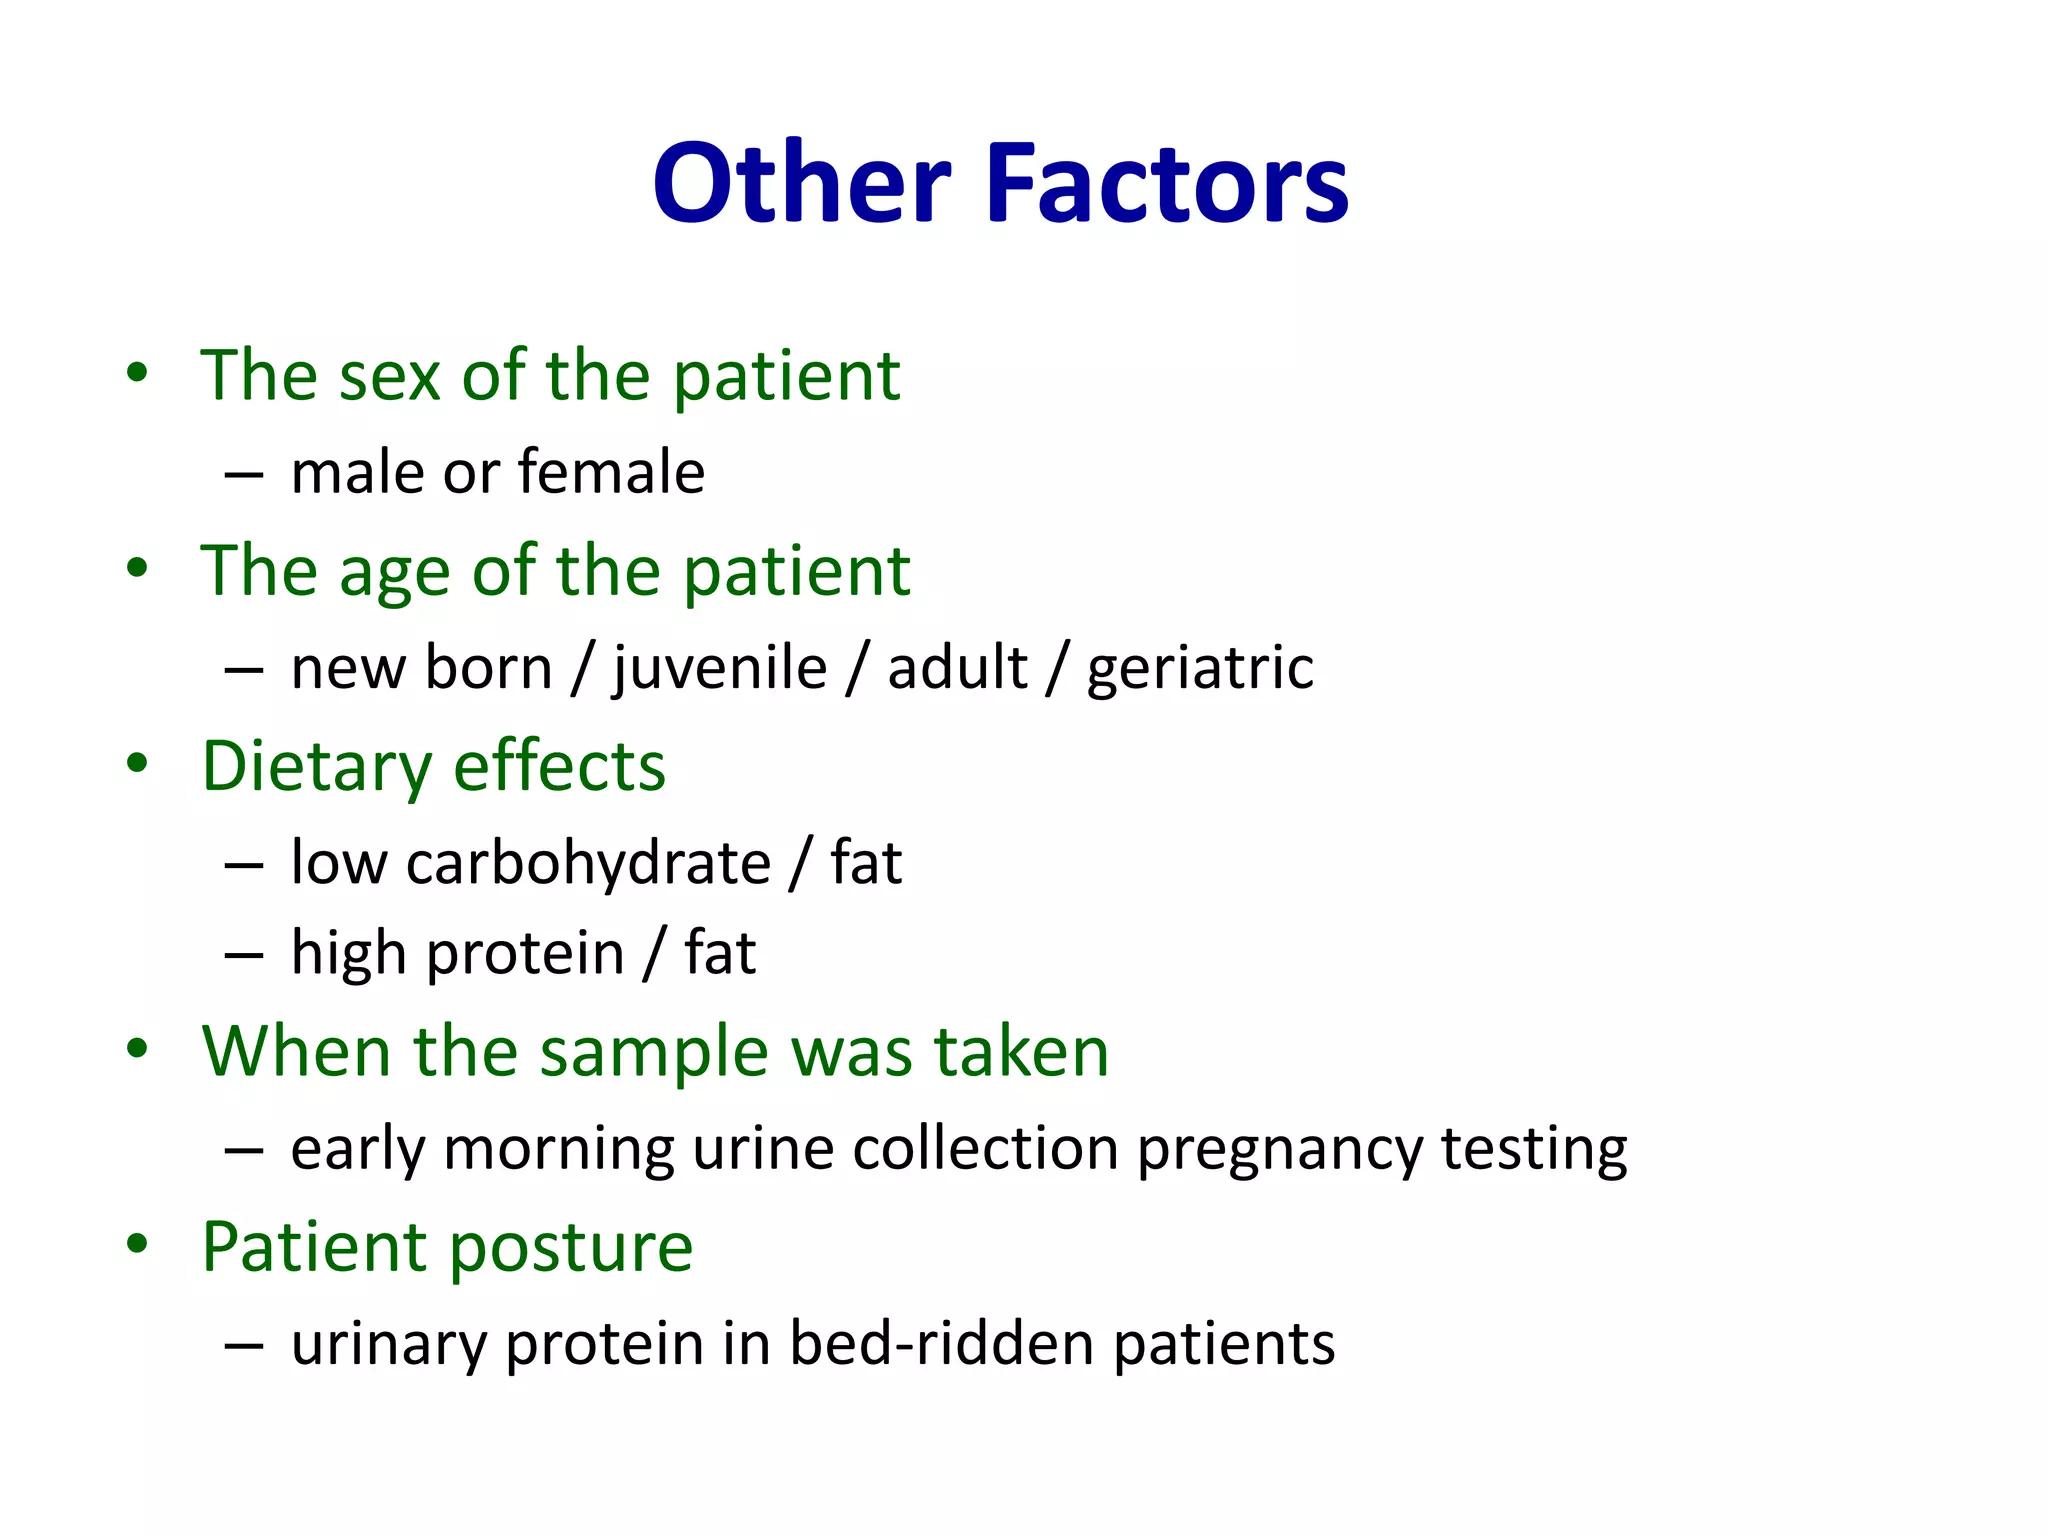
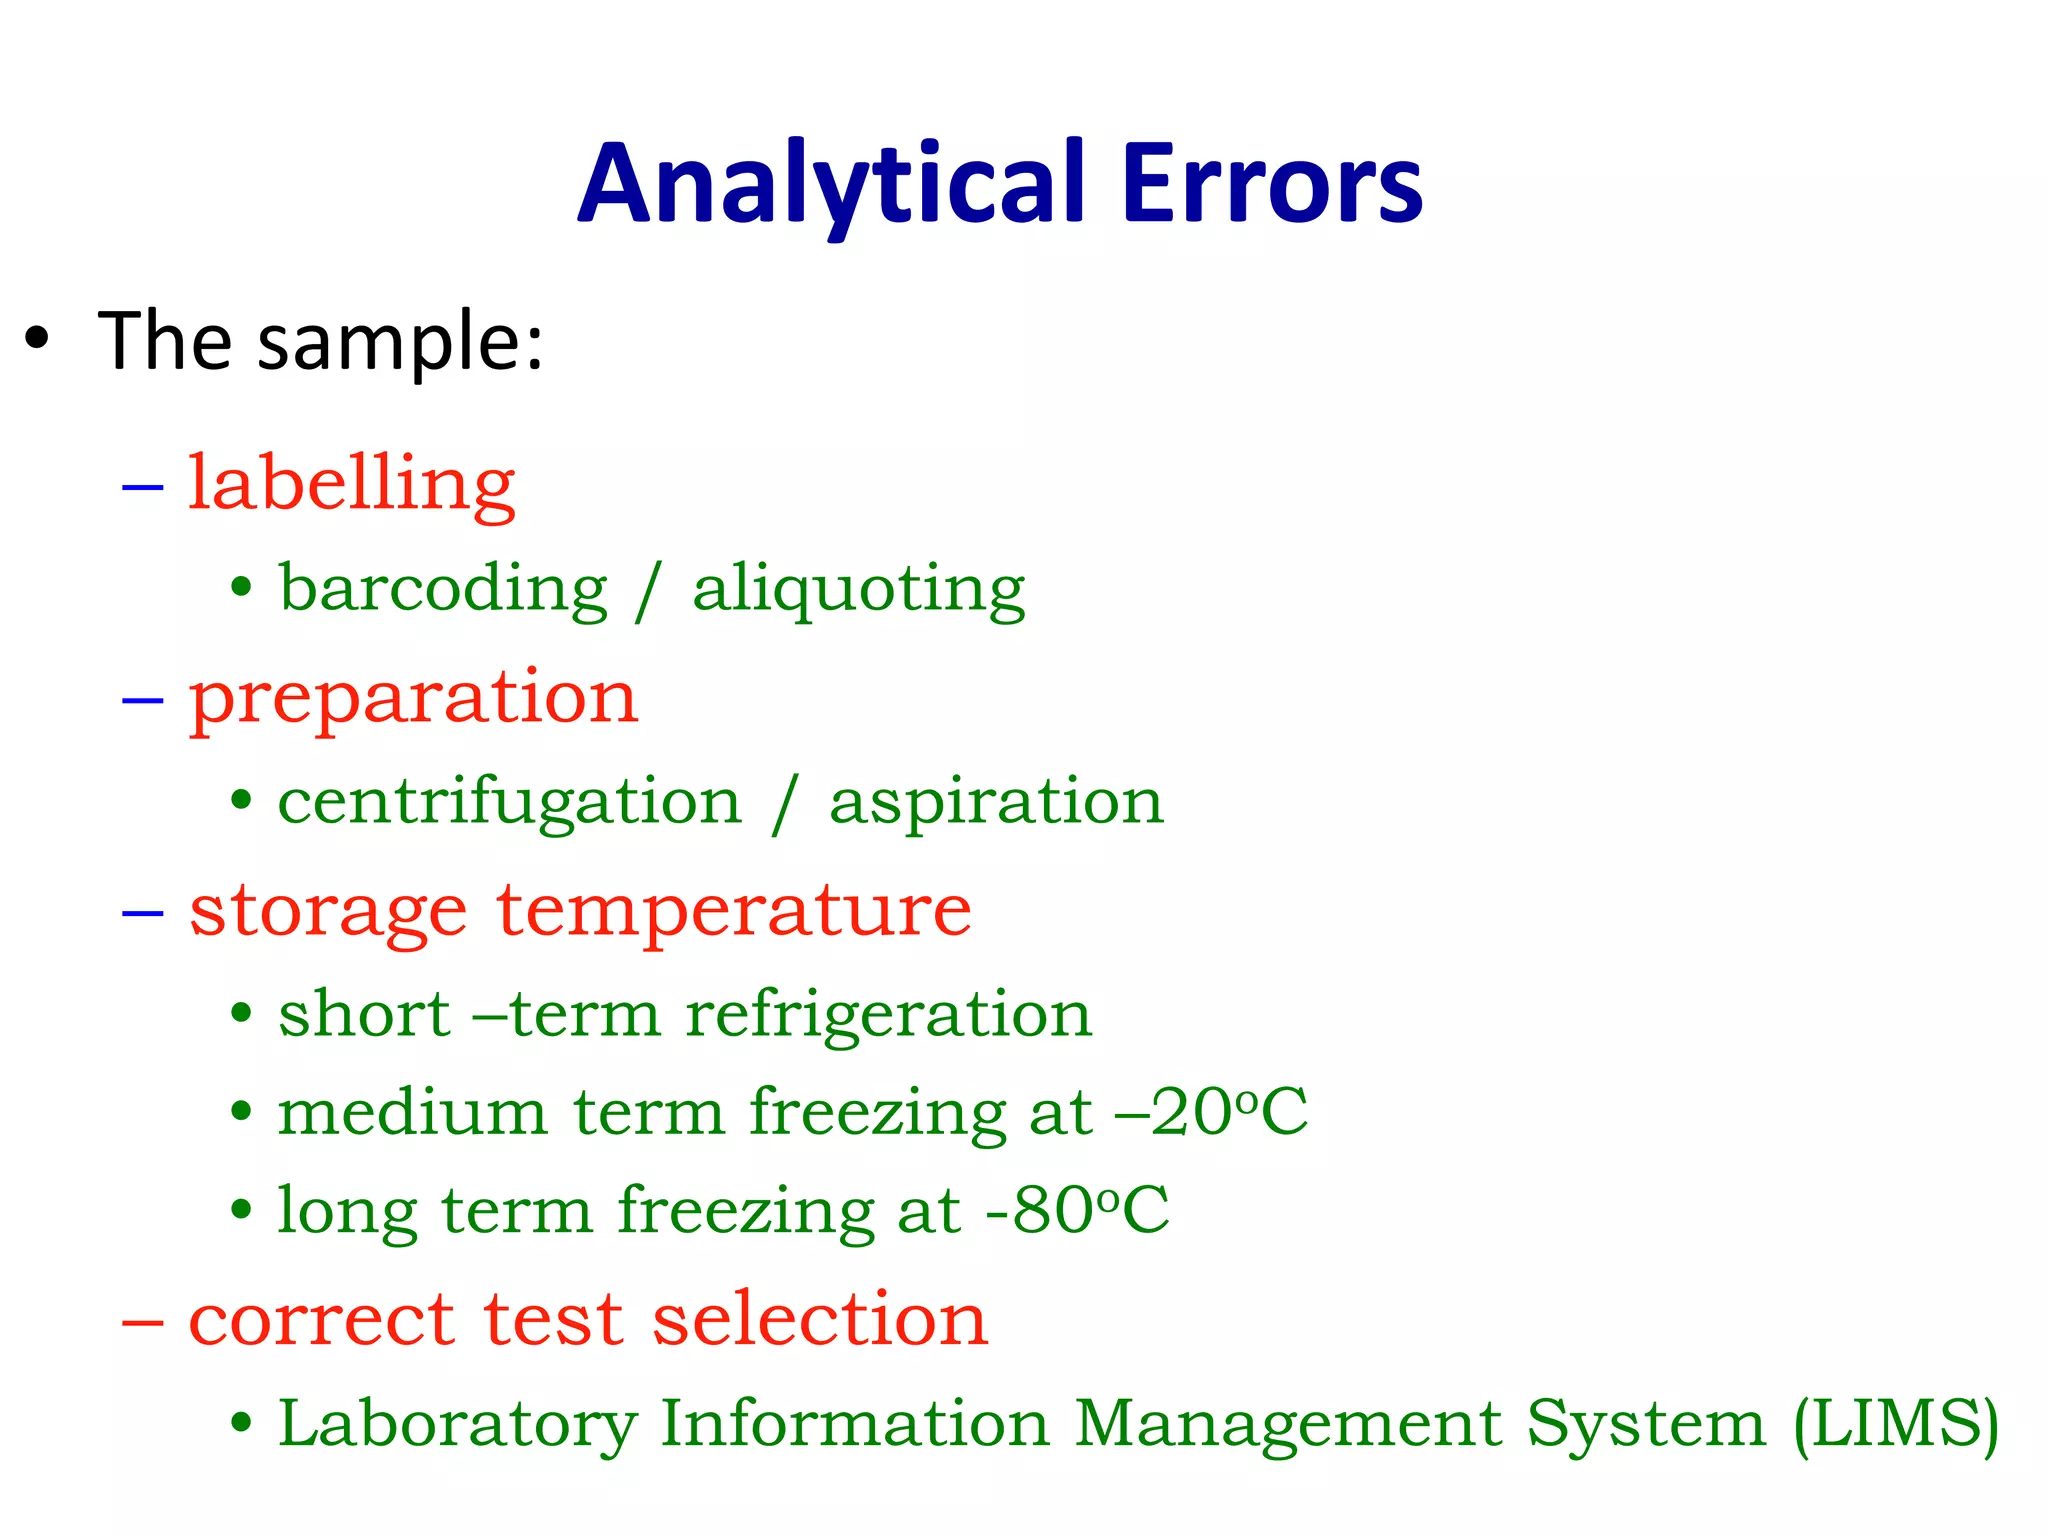
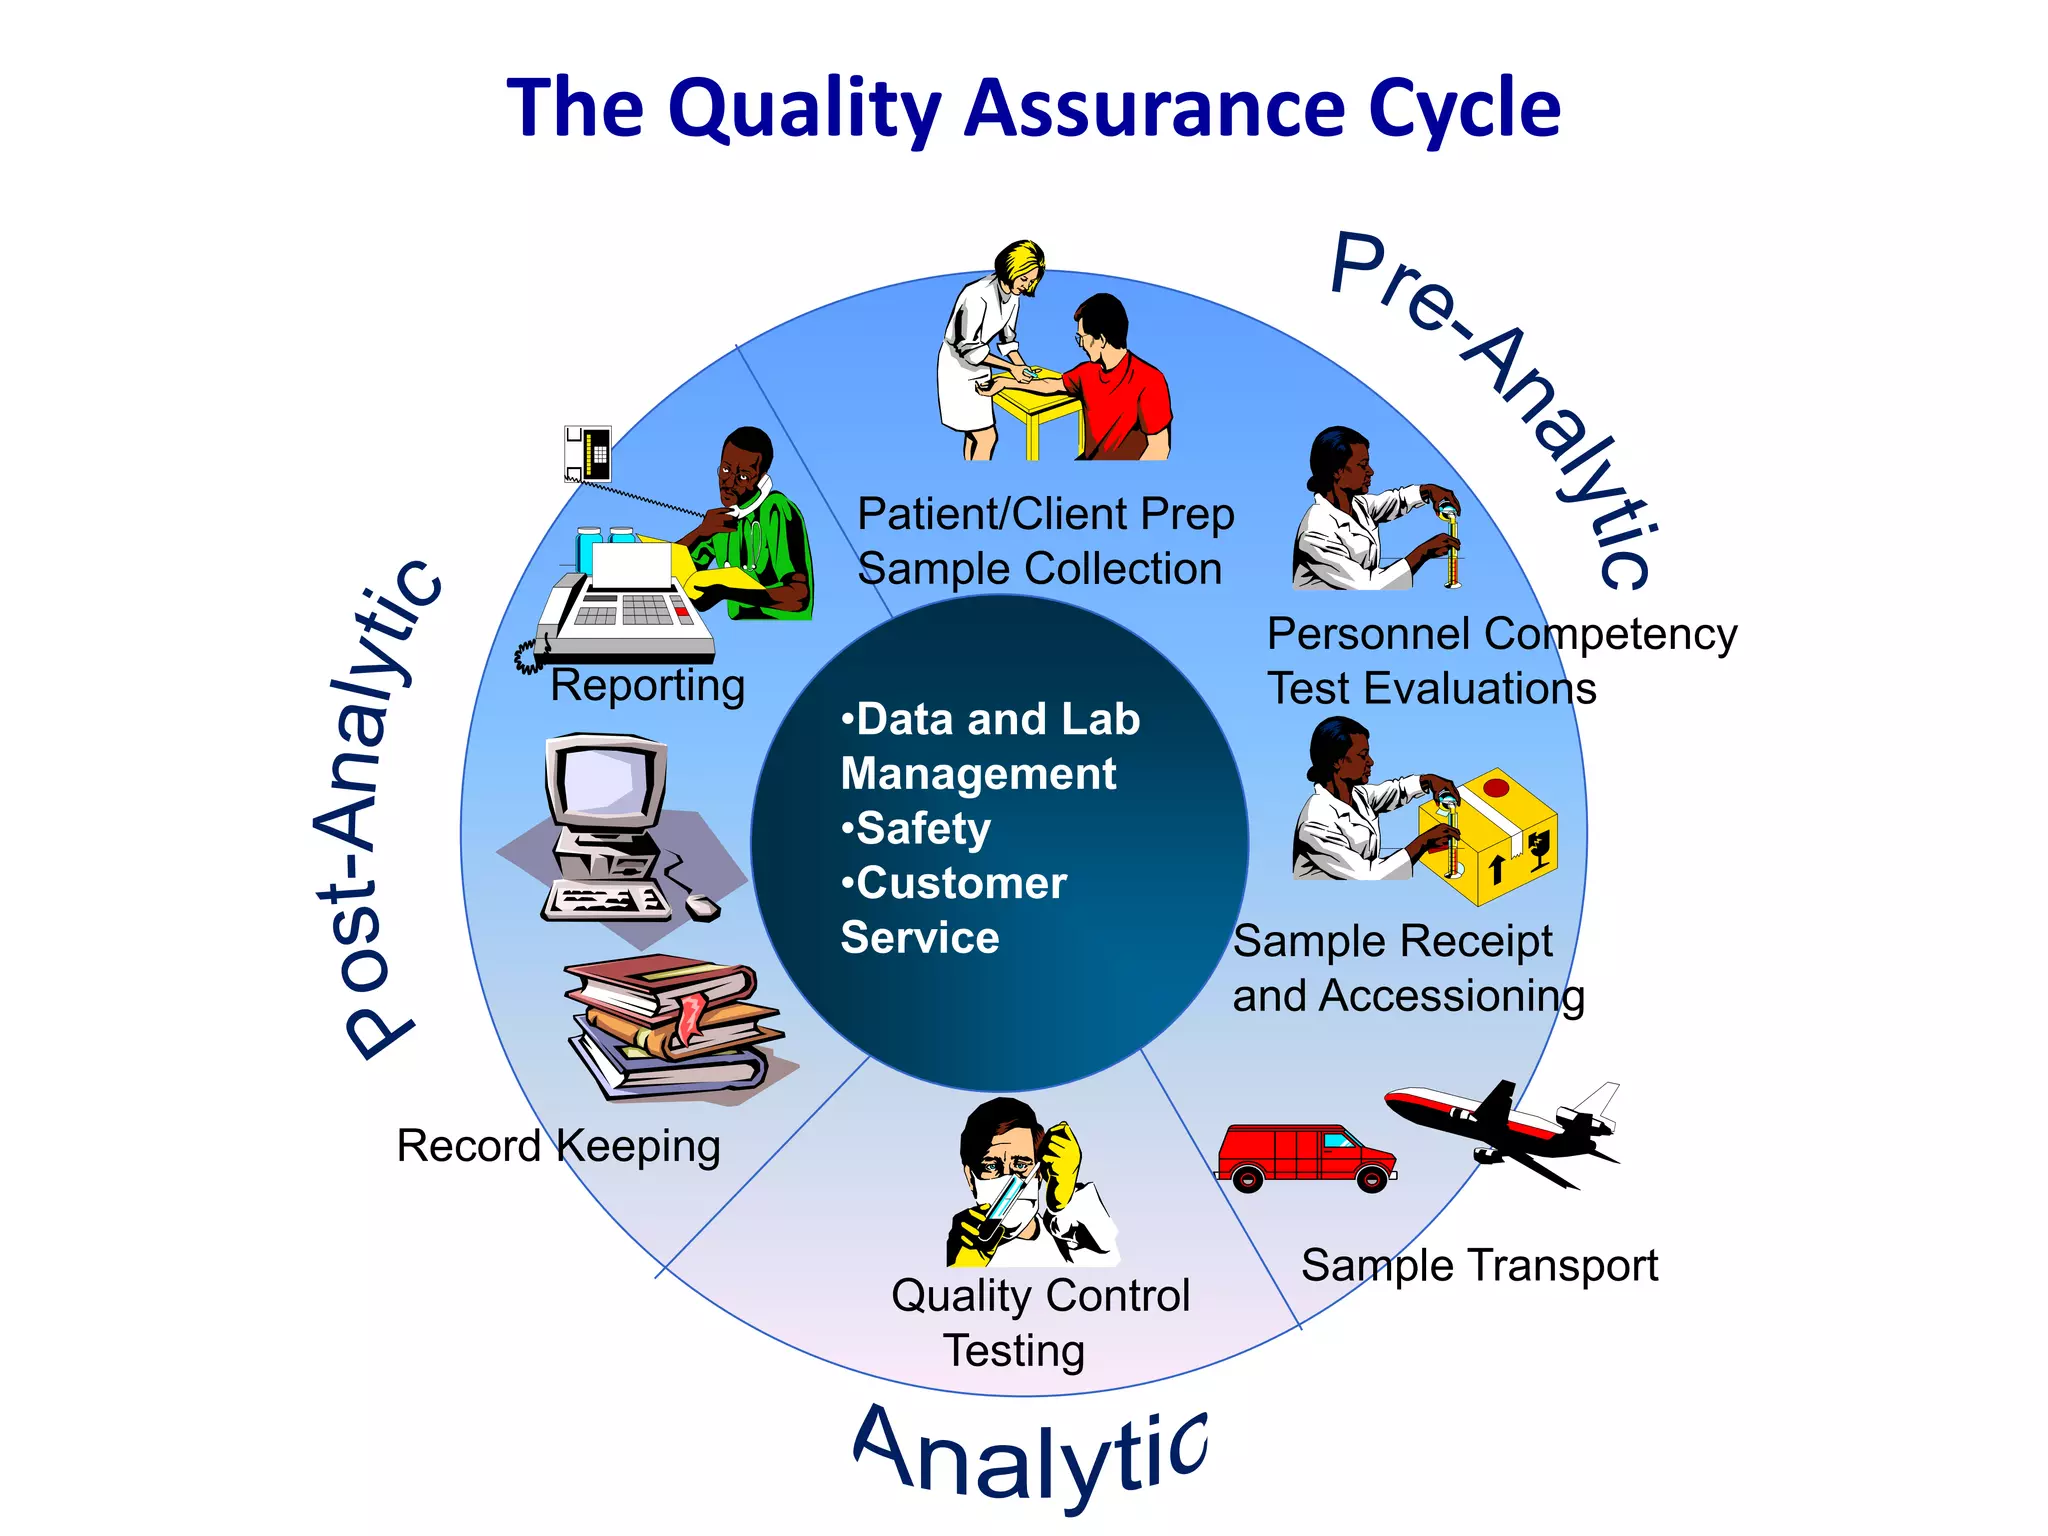
This document discusses laboratory errors and quality control in clinical testing. It describes three types of errors - pre-analytical, analytical, and post-analytical. Pre-analytical errors can occur before the sample reaches the lab due to improper patient preparation, collection, storage, or transport. Analytical errors occur during testing and can be due to issues with samples, equipment, reagents, or operator technique. Post-analytical errors involve improper result reporting. The document emphasizes the importance of quality control, calibration, and statistical analysis to monitor performance and identify errors. Quality control charts can reveal random errors or systematic shifts and trends.


