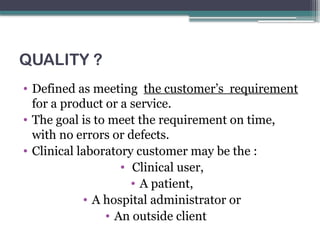
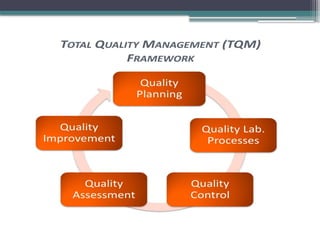
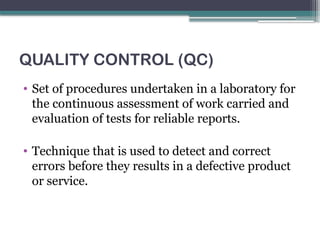
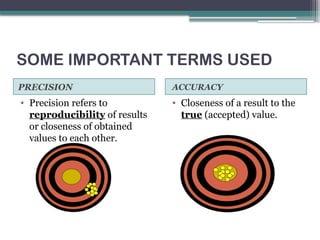
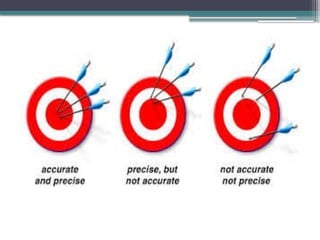
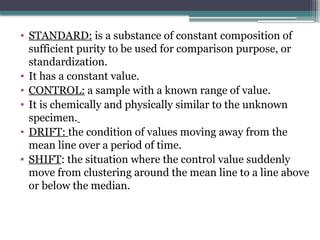
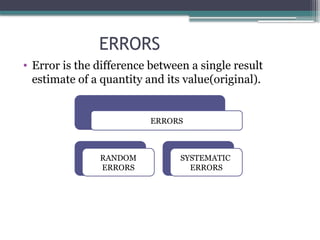
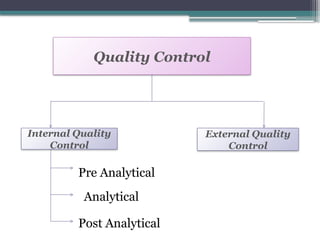
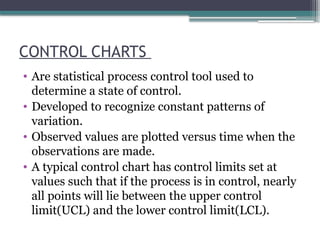
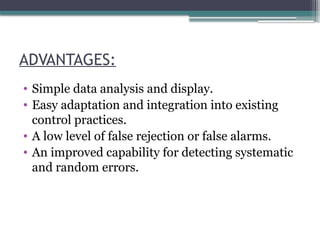
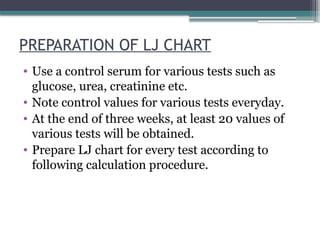
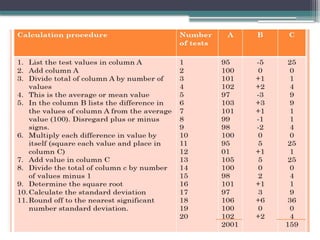
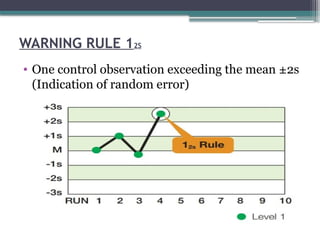
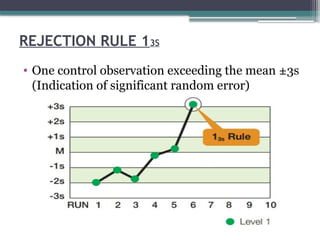
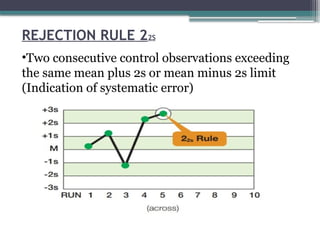
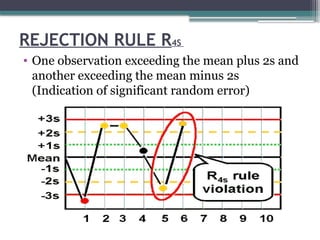
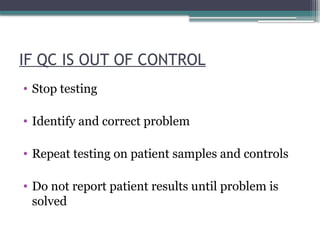
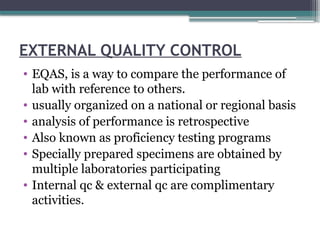
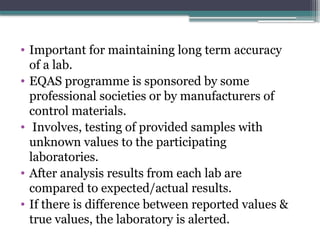
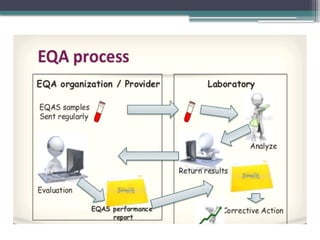
QUALITY CONTROL
Presented By: Arun Kumar Yadav
B.SC MLT 3rd
YEAR
Moderator: Dr. M.C Meitei
QUALITY ?
• Defined as meeting the customer’s requirement
for a product or a service.
• The goal is to meet the requirement on time,
with no errors or defects.
• Clinical laboratory customer may be the :
• Clinical user,
• A patient,
• A hospital administrator or
• An outside client
QUALITY CONTROL (QC)
• Set of procedures undertaken in a laboratory for
the continuous assessment of work carried and
evaluation of tests for reliable reports.
• Technique that is used to detect and correct
errors before they results in a defective product
or service.
QUALITY CONTROL
Must be:- Practical
Achievable
Affordable
SOME IMPORTANT TERMS USED
PRECISION ACCURACY
• Precision refers to
reproducibility of results
or closeness of obtained
values to each other.
• Closeness of a result to the
true (accepted) value.
• STANDARD: is a substance of constant composition of
sufficient purity to be used for comparison purpose, or
standardization.
• It has a constant value.
• CONTROL: a sample with a known range of value.
• It is chemically and physically similar to the unknown
specimen.
• DRIFT: the condition of values moving away from the
mean line over a period of time.
• SHIFT: the situation where the control value suddenly
move from clustering around the mean line to a line above
or below the median.
• MEAN: The mean is calculated by findings the sum
of all the values in the set and dividing this by the
number of values in the set.
• STANDARD DEVIATION: that is a statistical
expression of the scatter or dispersion of values
around a central average value.
ERRORS
• Error is the difference between a single result
estimate of a quantity and its value(original).
ERRORS
RANDOM
ERRORS
SYSTEMATIC
ERRORS
RANDOM ERRORS
• Error that occur by chance.
• Indicates poor precision.
• SOURCES:
Sample variability
Error in calculation
Wrong sample numbering and labeling
Air bubbles in a reagent line
• They can be reduced by repeating the experiment.
SYSTEMATIC ERRORS
• It is variation that can make results consistently
higher or consistently lower than the actual value.
• Indicate poor accuracy.
• SOURCES:
Mechanical trouble in an instrument
Incorrect standard
Contaminated or out of date reagents
• It can be reduced by good study design and conduct
of experiment.
Quality Control
Internal Quality
Control
External Quality
Control
Pre Analytical
Analytical
Post Analytical
INTERNAL QUALITY CONTROL
• Is the study of errors and introduction of
procedures to recognize and minimize them.
• Is necessary for the daily monitoring of the
precision and accuracy.
• Includes personnel, instrumentation , document,
control and reagent control.
PRE ANALYTICAL ERRORS
1. Test ordering and utilization:-
• Inappropriate tests
• Bad handwriting
• Wrong patient identity
• Delayed order of test
2. Patient identification:-
• Wrong patient identified
• Wrong lab or CR number
3. Patient preparation:-
• Tests are affected by:-
• Recent intake of food ( as in case of blood sugar
estimation which requires min. 10-12 hours of
fasting)
• Alcohols, drugs
• Posture during specimen collection
• Stress
4. Specimen collection:-
• Correct order of vacutainers ( Blood culture,
sodium citrate, plain, EDTA, fluoride)
• Correct anticoagulant
• Adequate volume
• Avoid using hemolyzed , lipemic, icteric sera
• Proper mixing
ANALYTICAL ERRORS
• Selection of inaccurate method (e.g. GOD POD is
more accurate in comparison to Nelson and
Somogyi method for glucose estimation)
• Instrument with precision error
• Uncalibrated instruments
• Presence of interfering substance in specimen
• Reagent problem (expired, deteriorated,
contaminated, improperly stored etc)
• Sample problem ( poor mixing of sample ,
inadequate volume , hemolyzed etc.)
POST ANALYTICAL ERRORS
 COMPUTER ENTRY OF DATA
• Reports should be accurate and in a standard
format established by the lab.
REPORT GENERATION
• Report should be in a format that is readable and
easily understandable.
 LABORATORY ENVIRONMENT
• It should meet standard requirements necessary
for safe, rapid and efficient performance.
 REPORT DELIVERY
• Should be timely dispatched to the correct patient.
• Turn around time (TAT) is a important factor
affecting patient satisfaction.
• Computerization has made turn around time more
manageable.
REFERENCE AND CONTROL MATERIAL
 Reference material:- used for calibration of an
apparatus or for verification of a method.
 Control material:- used only for quality control
purposes and not used for calibration purposes.
QUALITY CONTROL PRODUCTS
• A quality control product is a patient like
material ideally made from human serum, urine
or spinal fluid.
• A control material can be a liquid or freeze dried
(lyophilized) material and is composed of one or
more constituents (analytes) of known
concentration.
 MONITORING QC DATA:-
• Use control charts
• Plot control values each run
• Acceptance of run
• Monitor precision and accuracy of repeated
measurements
• Review charts at defined intervals, take
necessary action and document
CONTINUED….
CONTROL CHARTS
• Are statistical process control tool used to
determine a state of control.
• Developed to recognize constant patterns of
variation.
• Observed values are plotted versus time when the
observations are made.
• A typical control chart has control limits set at
values such that if the process is in control, nearly
all points will lie between the upper control
limit(UCL) and the lower control limit(LCL).
TYPES OF CHARTS
 Levey-Jennings chart
Westgard multirule chart
CUSUM chart
(Cumulative sum control chart)
LEVEY-JENNINGS CHART
• Graph on which quality control data is plotted
and it gives a visual indication whether a
laboratory test is working well.
• Control values are plotted versus time.
• Calculate mean and standard deviation.
• Lines are drawn from point to point to see trends
and shifts.
ADVANTAGES:
• Simple data analysis and display.
• Easy adaptation and integration into existing
control practices.
• A low level of false rejection or false alarms.
• An improved capability for detecting systematic
and random errors.
PREPARATION OF LJ CHART
• Use a control serum for various tests such as
glucose, urea, creatinine etc.
• Note control values for various tests everyday.
• At the end of three weeks, at least 20 values of
various tests will be obtained.
• Prepare LJ chart for every test according to
following calculation procedure.
LJ CHART
FINDINGS
• Ideally should have control values clustered
about the mean (+/-2 SD) with little variation in
the upward or downward direction.
• Imprecision = large amount of scatter about
the mean. Usually caused by errors in technique.
• Inaccuracy = may see as a trend or a shift,
usually caused by systemic errors .
• Random error = no pattern. Usually poor
technique, malfunctioning equipment.
WESTGARD MULTIRULE CHART
• Introduced by James Westgard and his
associates.
• Uses a series of control rules for interpreting
control data.
• Rules are applied to see whether the results from
the samples can be released (when the control
was done), or they need to be rerun.
• Following are the control rules:-
WARNING RULE 12S
• One control observation exceeding the mean ±2s
(Indication of random error)
REJECTION RULE 13S
• One control observation exceeding the mean ±3s
(Indication of significant random error)
REJECTION RULE 22S
•Two consecutive control observations exceeding
the same mean plus 2s or mean minus 2s limit
(Indication of systematic error)
REJECTION RULE R4S
• One observation exceeding the mean plus 2s and
another exceeding the mean minus 2s
(Indication of significant random error)
REJECTION RULE 41S
• Four consecutive observations exceeding the
mean plus 1s or the mean minus 1s(Significant
systematic error)
REJECTION RULE 10X
• Ten consecutive control observations falling on
one side of the mean, above or below of the line
indicating average value of the
control(Significant systematic error)
7T : Reject the run when seven control
measurements trend in the same direction, i.e.,
get progressively higher or progressively lower
CUSUM chart
(cumulative sum chart)
• CUSUM chart is a sequential analysis technique
developed by E. S. Page of the University of
Cambridge.
• A CUSUM chart is a type of control chart used to
monitor small shifts in the process mean.
• It uses the cumulative sum of deviations from a
target.
• CUSUM chart provides better determination of
systematic errors than LJ chart.
PREPARATION
• Cusum value can be calculated by adding the new
difference to the previous Cusum.
• The Cusum chart is drawn by plotting days on X-axis and
Cusum values on Y- axis.
Advantages of control chart
• Control charts are a proven technique for
improving productivity.
• Control charts are effective in defect
prevention.
• Control chart allow us to distinguish between
controlled and uncontrolled processes .
• It determines processes variability and detects
unusual variations taking place in a process.
IF QC IS OUT OF CONTROL
• Stop testing
• Identify and correct problem
• Repeat testing on patient samples and controls
• Do not report patient results until problem is
solved
EXTERNAL QUALITY CONTROL
• EQAS, is a way to compare the performance of
lab with reference to others.
• usually organized on a national or regional basis
• analysis of performance is retrospective
• Also known as proficiency testing programs
• Specially prepared specimens are obtained by
multiple laboratories participating
• Internal qc & external qc are complimentary
activities.
• Important for maintaining long term accuracy
of a lab.
• EQAS programme is sponsored by some
professional societies or by manufacturers of
control materials.
• Involves, testing of provided samples with
unknown values to the participating
laboratories.
• After analysis results from each lab are
compared to expected/actual results.
• If there is difference between reported values &
true values, the laboratory is alerted.
General Cycle of EQAS
EQAS samples
received
Lab analysis
EQC sample
Results sent to
EQC organiser
Report
received EQC
EQC report
reviewed
Corrective
action taken if
required
OBJECTIVES OF EQAS
• Provide a measure for individual laboratory
quality
• To supplement internal quality control
procedures
• To investigate factors in performance
(methods etc.)
• To act as an educational stimulus for
improvement in performance
CALCULATION
VIS :- <100 = very good
100-150= good
150-200= satisfactory
>200 = unsatisfactory
•
HOW TO IMPLEMENT A QC PROGRAM?
• Establish written policies and procedures
• Assign responsibility for monitoring and
reviewing
• Train staff
• Obtain control materials
• Collect data
• Establish control charts
• Establish and implement troubleshooting and
corrective action protocols
Quality in labs is mutual responsibility of…..
• Laboratory specialists
• Clinicians
• Public health physicians
SUMMARY
• Quality control is a part of a total laboratory control
program under total quality management
• TQM is responsible for organization development and
management for improved quality in all aspects
• Quality assurance is internal quality assessment plus
external quality assessment
• Establish reference ranges for analytes being tested
CONTD…
• Document training and competency assessment
for their technicians
• Provide review and verification of all results
released, including verbal result reports
• No matter how good the quality system is on
paper, quality cannot be achieved if the theory
cannot be translated into practice
Quality costs,
But poor quality costs more…
Thank You….!!

QUALITY CONTROL IN BIOCHEMISTRY BMLS 3rd

  • 1.
    QUALITY CONTROL Presented By:Arun Kumar Yadav B.SC MLT 3rd YEAR Moderator: Dr. M.C Meitei
  • 2.
    QUALITY ? • Definedas meeting the customer’s requirement for a product or a service. • The goal is to meet the requirement on time, with no errors or defects. • Clinical laboratory customer may be the : • Clinical user, • A patient, • A hospital administrator or • An outside client
  • 4.
    QUALITY CONTROL (QC) •Set of procedures undertaken in a laboratory for the continuous assessment of work carried and evaluation of tests for reliable reports. • Technique that is used to detect and correct errors before they results in a defective product or service.
  • 5.
    QUALITY CONTROL Must be:-Practical Achievable Affordable
  • 6.
    SOME IMPORTANT TERMSUSED PRECISION ACCURACY • Precision refers to reproducibility of results or closeness of obtained values to each other. • Closeness of a result to the true (accepted) value.
  • 8.
    • STANDARD: isa substance of constant composition of sufficient purity to be used for comparison purpose, or standardization. • It has a constant value. • CONTROL: a sample with a known range of value. • It is chemically and physically similar to the unknown specimen. • DRIFT: the condition of values moving away from the mean line over a period of time. • SHIFT: the situation where the control value suddenly move from clustering around the mean line to a line above or below the median.
  • 9.
    • MEAN: Themean is calculated by findings the sum of all the values in the set and dividing this by the number of values in the set. • STANDARD DEVIATION: that is a statistical expression of the scatter or dispersion of values around a central average value.
  • 10.
    ERRORS • Error isthe difference between a single result estimate of a quantity and its value(original). ERRORS RANDOM ERRORS SYSTEMATIC ERRORS
  • 11.
    RANDOM ERRORS • Errorthat occur by chance. • Indicates poor precision. • SOURCES: Sample variability Error in calculation Wrong sample numbering and labeling Air bubbles in a reagent line • They can be reduced by repeating the experiment.
  • 12.
    SYSTEMATIC ERRORS • Itis variation that can make results consistently higher or consistently lower than the actual value. • Indicate poor accuracy. • SOURCES: Mechanical trouble in an instrument Incorrect standard Contaminated or out of date reagents • It can be reduced by good study design and conduct of experiment.
  • 14.
    Quality Control Internal Quality Control ExternalQuality Control Pre Analytical Analytical Post Analytical
  • 15.
    INTERNAL QUALITY CONTROL •Is the study of errors and introduction of procedures to recognize and minimize them. • Is necessary for the daily monitoring of the precision and accuracy. • Includes personnel, instrumentation , document, control and reagent control.
  • 17.
    PRE ANALYTICAL ERRORS 1.Test ordering and utilization:- • Inappropriate tests • Bad handwriting • Wrong patient identity • Delayed order of test
  • 18.
    2. Patient identification:- •Wrong patient identified • Wrong lab or CR number 3. Patient preparation:- • Tests are affected by:- • Recent intake of food ( as in case of blood sugar estimation which requires min. 10-12 hours of fasting) • Alcohols, drugs • Posture during specimen collection • Stress
  • 19.
    4. Specimen collection:- •Correct order of vacutainers ( Blood culture, sodium citrate, plain, EDTA, fluoride) • Correct anticoagulant • Adequate volume • Avoid using hemolyzed , lipemic, icteric sera • Proper mixing
  • 20.
    ANALYTICAL ERRORS • Selectionof inaccurate method (e.g. GOD POD is more accurate in comparison to Nelson and Somogyi method for glucose estimation) • Instrument with precision error • Uncalibrated instruments • Presence of interfering substance in specimen
  • 21.
    • Reagent problem(expired, deteriorated, contaminated, improperly stored etc) • Sample problem ( poor mixing of sample , inadequate volume , hemolyzed etc.)
  • 22.
    POST ANALYTICAL ERRORS COMPUTER ENTRY OF DATA • Reports should be accurate and in a standard format established by the lab. REPORT GENERATION • Report should be in a format that is readable and easily understandable.
  • 23.
     LABORATORY ENVIRONMENT •It should meet standard requirements necessary for safe, rapid and efficient performance.  REPORT DELIVERY • Should be timely dispatched to the correct patient. • Turn around time (TAT) is a important factor affecting patient satisfaction. • Computerization has made turn around time more manageable.
  • 24.
    REFERENCE AND CONTROLMATERIAL  Reference material:- used for calibration of an apparatus or for verification of a method.  Control material:- used only for quality control purposes and not used for calibration purposes.
  • 25.
    QUALITY CONTROL PRODUCTS •A quality control product is a patient like material ideally made from human serum, urine or spinal fluid. • A control material can be a liquid or freeze dried (lyophilized) material and is composed of one or more constituents (analytes) of known concentration.
  • 26.
     MONITORING QCDATA:- • Use control charts • Plot control values each run • Acceptance of run • Monitor precision and accuracy of repeated measurements • Review charts at defined intervals, take necessary action and document
  • 27.
  • 28.
    CONTROL CHARTS • Arestatistical process control tool used to determine a state of control. • Developed to recognize constant patterns of variation. • Observed values are plotted versus time when the observations are made. • A typical control chart has control limits set at values such that if the process is in control, nearly all points will lie between the upper control limit(UCL) and the lower control limit(LCL).
  • 29.
    TYPES OF CHARTS Levey-Jennings chart Westgard multirule chart CUSUM chart (Cumulative sum control chart)
  • 30.
    LEVEY-JENNINGS CHART • Graphon which quality control data is plotted and it gives a visual indication whether a laboratory test is working well. • Control values are plotted versus time. • Calculate mean and standard deviation. • Lines are drawn from point to point to see trends and shifts.
  • 31.
    ADVANTAGES: • Simple dataanalysis and display. • Easy adaptation and integration into existing control practices. • A low level of false rejection or false alarms. • An improved capability for detecting systematic and random errors.
  • 32.
    PREPARATION OF LJCHART • Use a control serum for various tests such as glucose, urea, creatinine etc. • Note control values for various tests everyday. • At the end of three weeks, at least 20 values of various tests will be obtained. • Prepare LJ chart for every test according to following calculation procedure.
  • 36.
  • 37.
    FINDINGS • Ideally shouldhave control values clustered about the mean (+/-2 SD) with little variation in the upward or downward direction. • Imprecision = large amount of scatter about the mean. Usually caused by errors in technique. • Inaccuracy = may see as a trend or a shift, usually caused by systemic errors . • Random error = no pattern. Usually poor technique, malfunctioning equipment.
  • 38.
    WESTGARD MULTIRULE CHART •Introduced by James Westgard and his associates. • Uses a series of control rules for interpreting control data. • Rules are applied to see whether the results from the samples can be released (when the control was done), or they need to be rerun. • Following are the control rules:-
  • 39.
    WARNING RULE 12S •One control observation exceeding the mean ±2s (Indication of random error)
  • 40.
    REJECTION RULE 13S •One control observation exceeding the mean ±3s (Indication of significant random error)
  • 41.
    REJECTION RULE 22S •Twoconsecutive control observations exceeding the same mean plus 2s or mean minus 2s limit (Indication of systematic error)
  • 42.
    REJECTION RULE R4S •One observation exceeding the mean plus 2s and another exceeding the mean minus 2s (Indication of significant random error)
  • 44.
    REJECTION RULE 41S •Four consecutive observations exceeding the mean plus 1s or the mean minus 1s(Significant systematic error)
  • 45.
    REJECTION RULE 10X •Ten consecutive control observations falling on one side of the mean, above or below of the line indicating average value of the control(Significant systematic error)
  • 46.
    7T : Rejectthe run when seven control measurements trend in the same direction, i.e., get progressively higher or progressively lower
  • 48.
    CUSUM chart (cumulative sumchart) • CUSUM chart is a sequential analysis technique developed by E. S. Page of the University of Cambridge. • A CUSUM chart is a type of control chart used to monitor small shifts in the process mean. • It uses the cumulative sum of deviations from a target. • CUSUM chart provides better determination of systematic errors than LJ chart.
  • 49.
    PREPARATION • Cusum valuecan be calculated by adding the new difference to the previous Cusum. • The Cusum chart is drawn by plotting days on X-axis and Cusum values on Y- axis.
  • 51.
    Advantages of controlchart • Control charts are a proven technique for improving productivity. • Control charts are effective in defect prevention. • Control chart allow us to distinguish between controlled and uncontrolled processes . • It determines processes variability and detects unusual variations taking place in a process.
  • 52.
    IF QC ISOUT OF CONTROL • Stop testing • Identify and correct problem • Repeat testing on patient samples and controls • Do not report patient results until problem is solved
  • 53.
    EXTERNAL QUALITY CONTROL •EQAS, is a way to compare the performance of lab with reference to others. • usually organized on a national or regional basis • analysis of performance is retrospective • Also known as proficiency testing programs • Specially prepared specimens are obtained by multiple laboratories participating • Internal qc & external qc are complimentary activities.
  • 54.
    • Important formaintaining long term accuracy of a lab. • EQAS programme is sponsored by some professional societies or by manufacturers of control materials. • Involves, testing of provided samples with unknown values to the participating laboratories. • After analysis results from each lab are compared to expected/actual results. • If there is difference between reported values & true values, the laboratory is alerted.
  • 56.
    General Cycle ofEQAS EQAS samples received Lab analysis EQC sample Results sent to EQC organiser Report received EQC EQC report reviewed Corrective action taken if required
  • 57.
    OBJECTIVES OF EQAS •Provide a measure for individual laboratory quality • To supplement internal quality control procedures • To investigate factors in performance (methods etc.) • To act as an educational stimulus for improvement in performance
  • 58.
    CALCULATION VIS :- <100= very good 100-150= good 150-200= satisfactory >200 = unsatisfactory
  • 59.
  • 60.
    HOW TO IMPLEMENTA QC PROGRAM? • Establish written policies and procedures • Assign responsibility for monitoring and reviewing • Train staff • Obtain control materials • Collect data • Establish control charts • Establish and implement troubleshooting and corrective action protocols
  • 61.
    Quality in labsis mutual responsibility of….. • Laboratory specialists • Clinicians • Public health physicians
  • 62.
    SUMMARY • Quality controlis a part of a total laboratory control program under total quality management • TQM is responsible for organization development and management for improved quality in all aspects • Quality assurance is internal quality assessment plus external quality assessment • Establish reference ranges for analytes being tested
  • 63.
    CONTD… • Document trainingand competency assessment for their technicians • Provide review and verification of all results released, including verbal result reports • No matter how good the quality system is on paper, quality cannot be achieved if the theory cannot be translated into practice
  • 64.
    Quality costs, But poorquality costs more… Thank You….!!