Downloaded 322 times

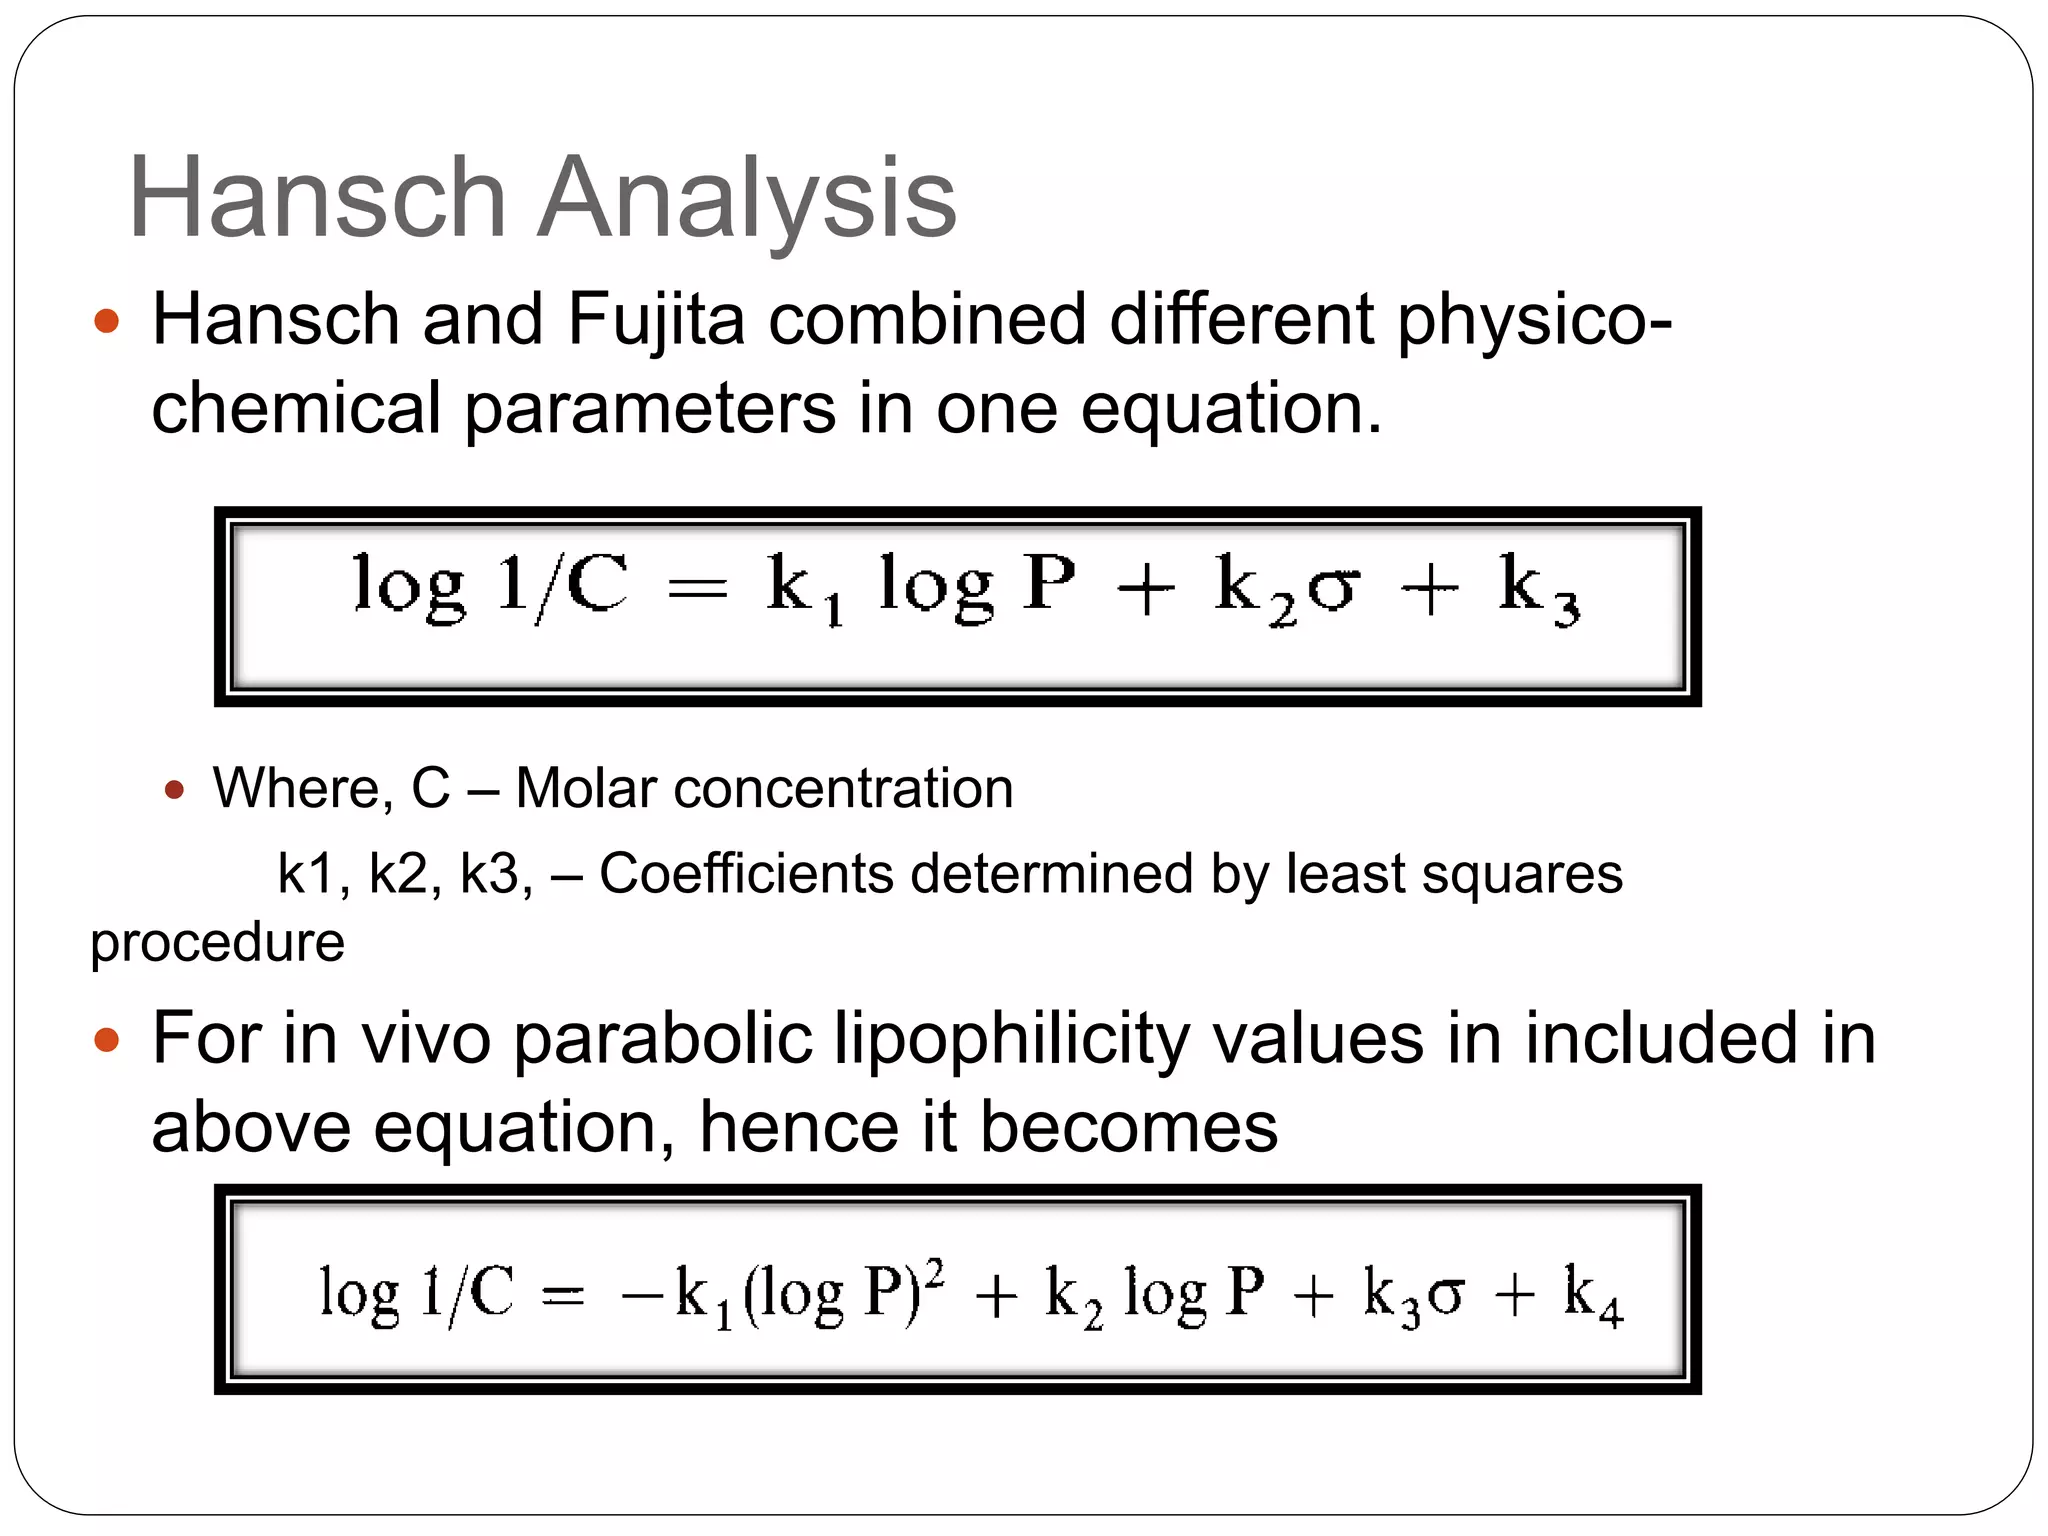


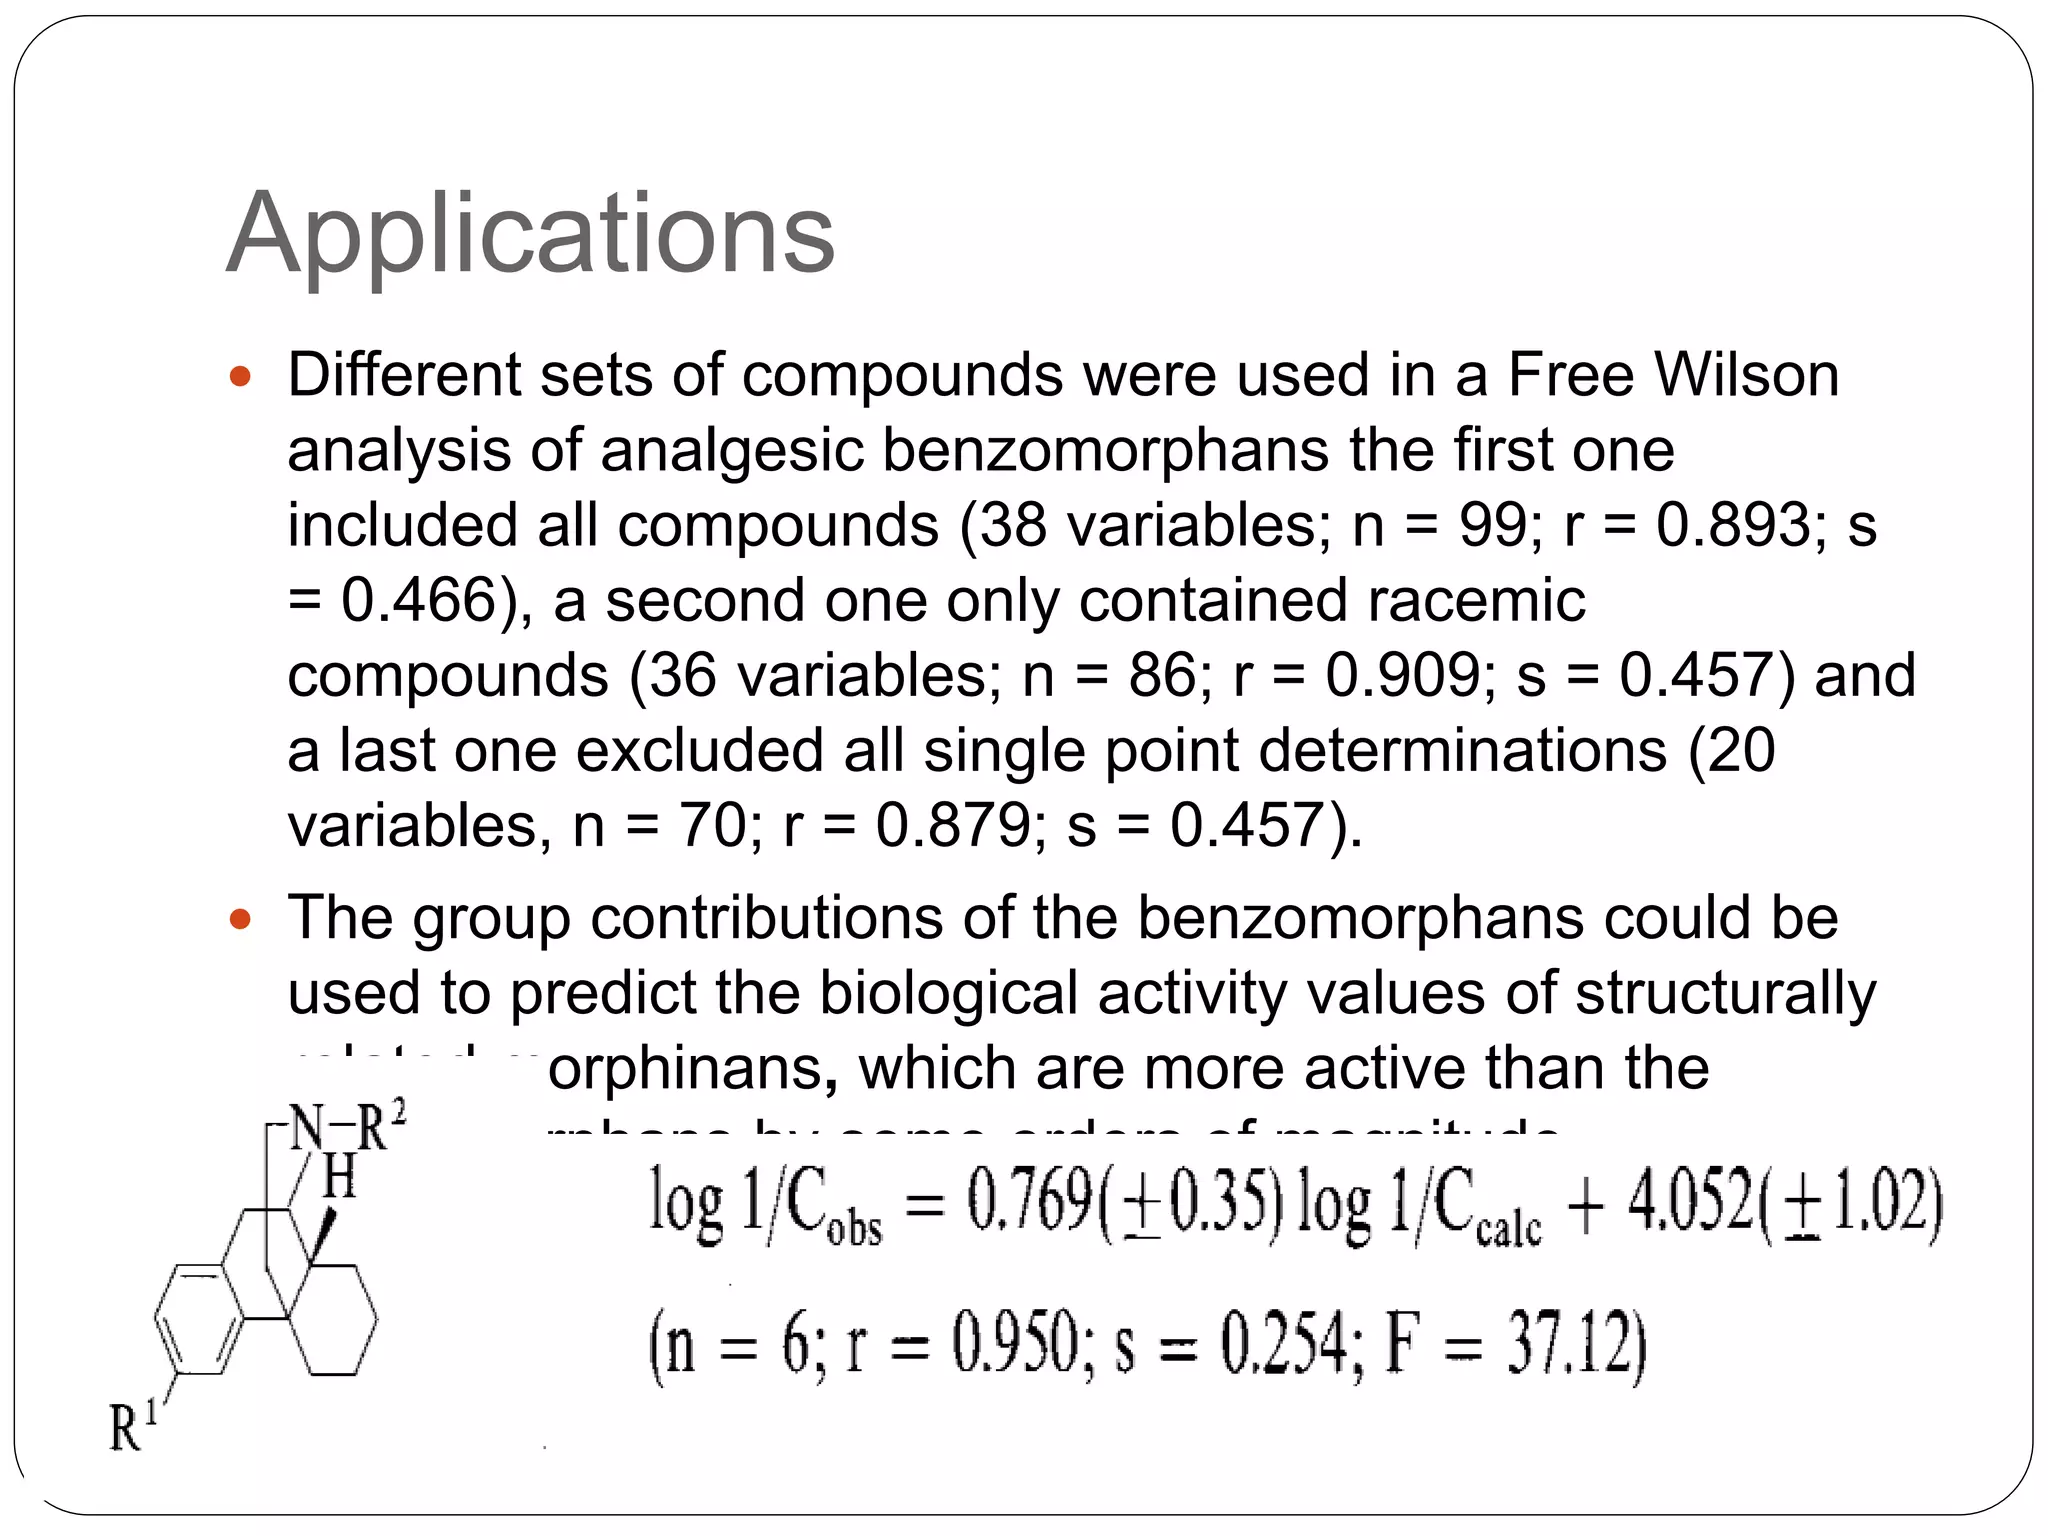
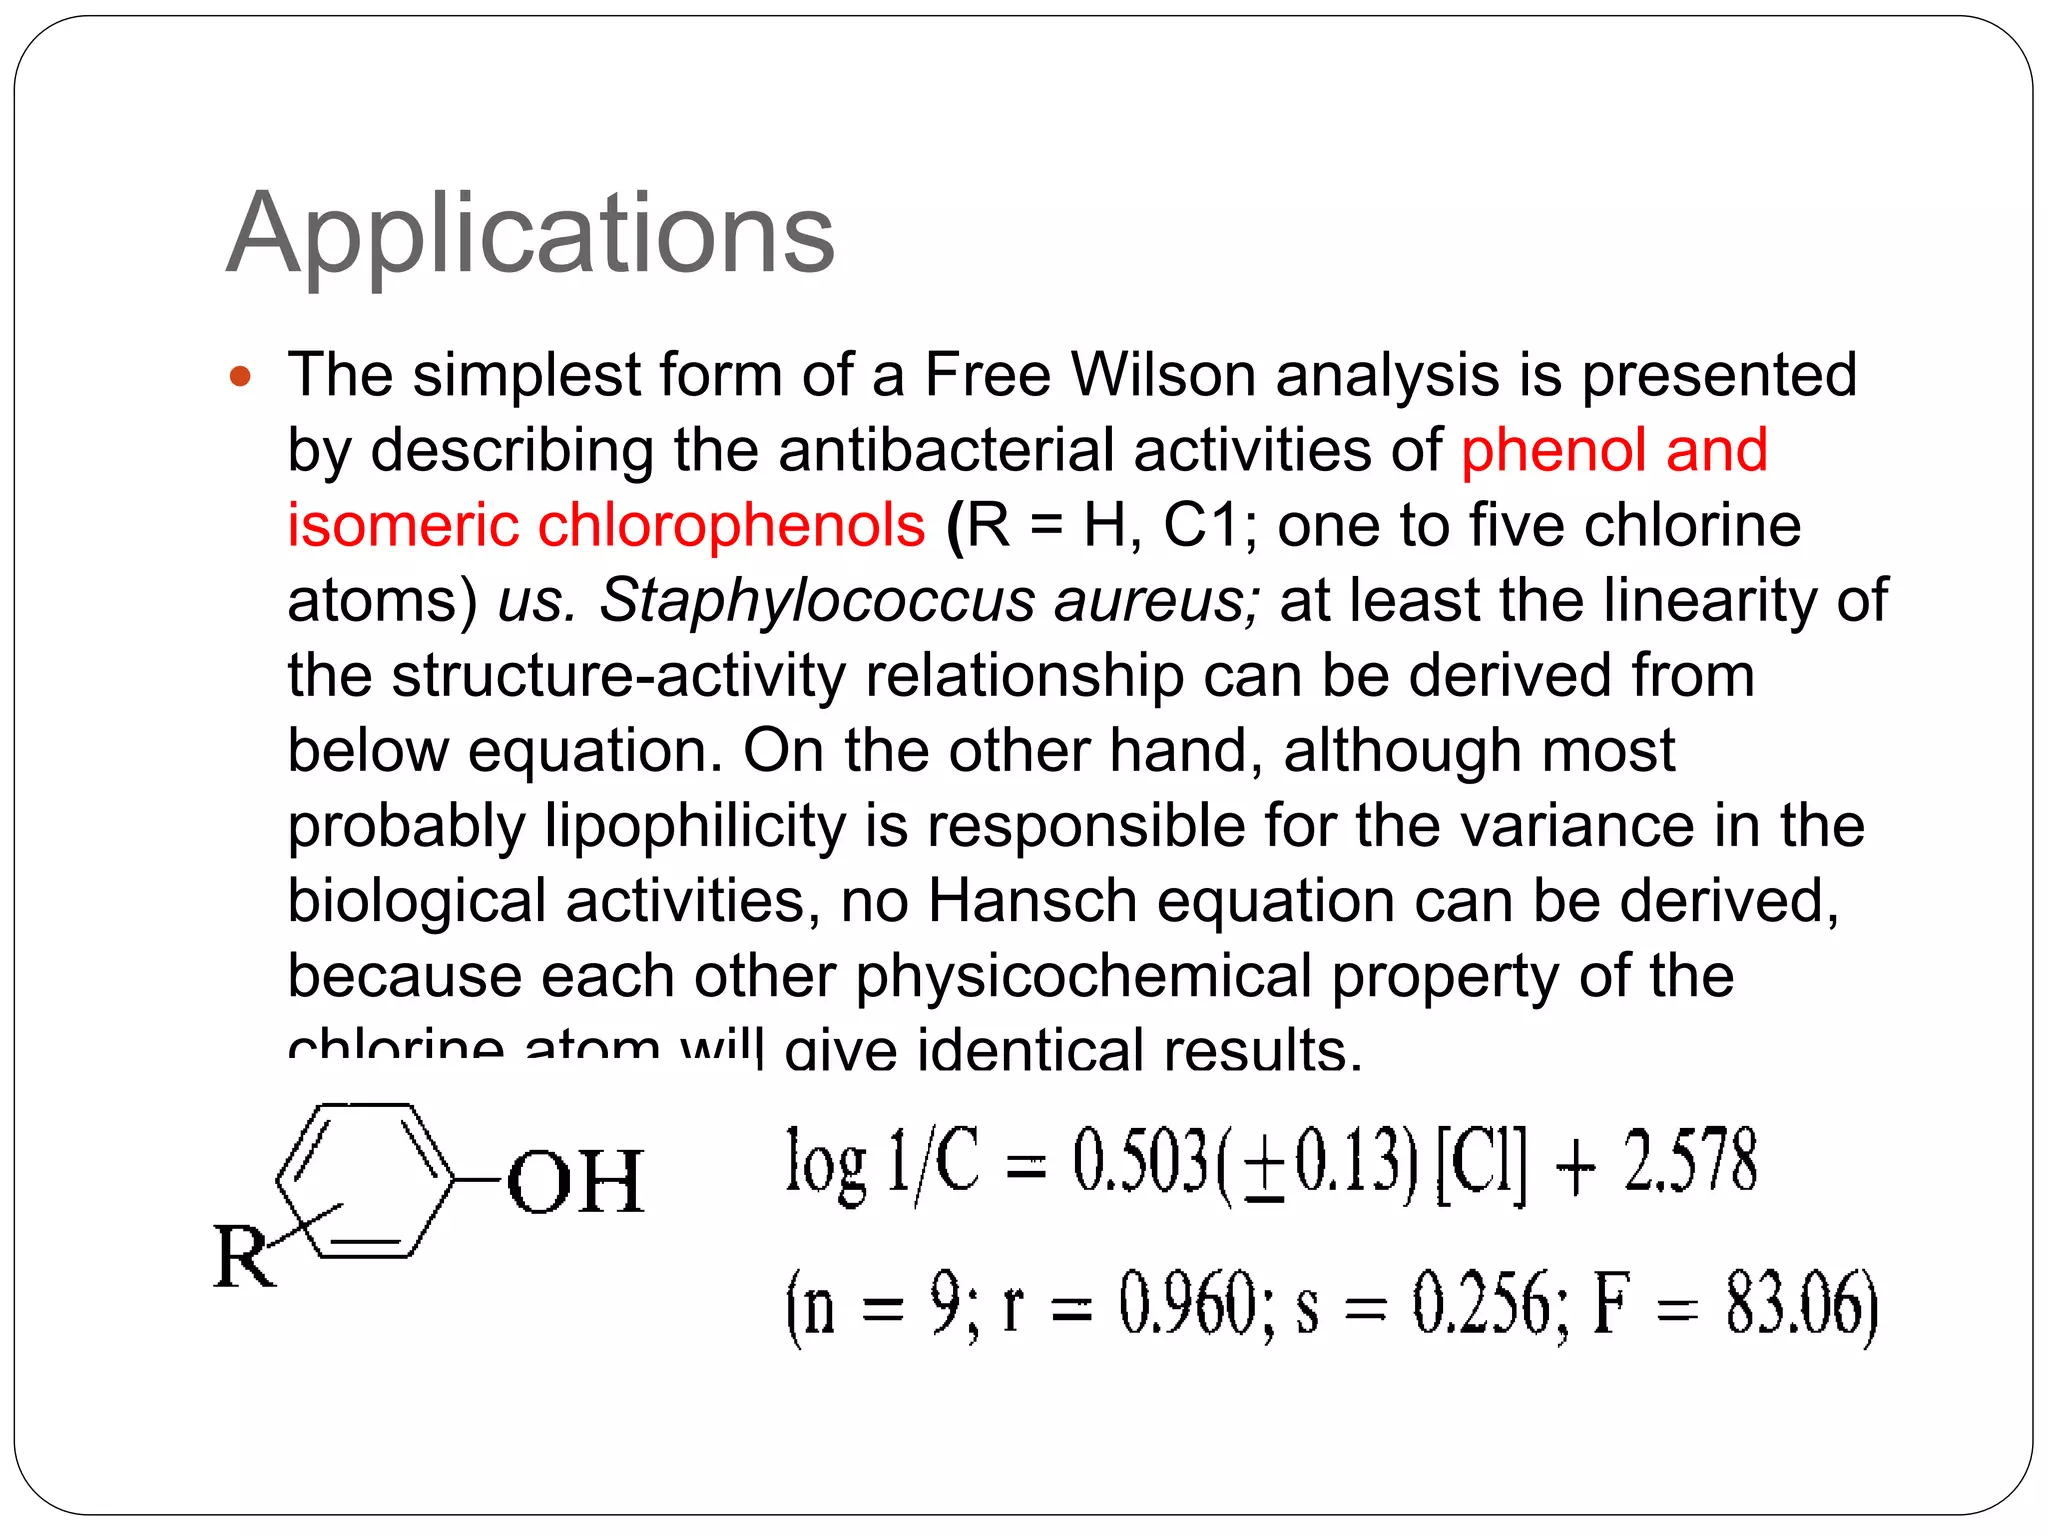

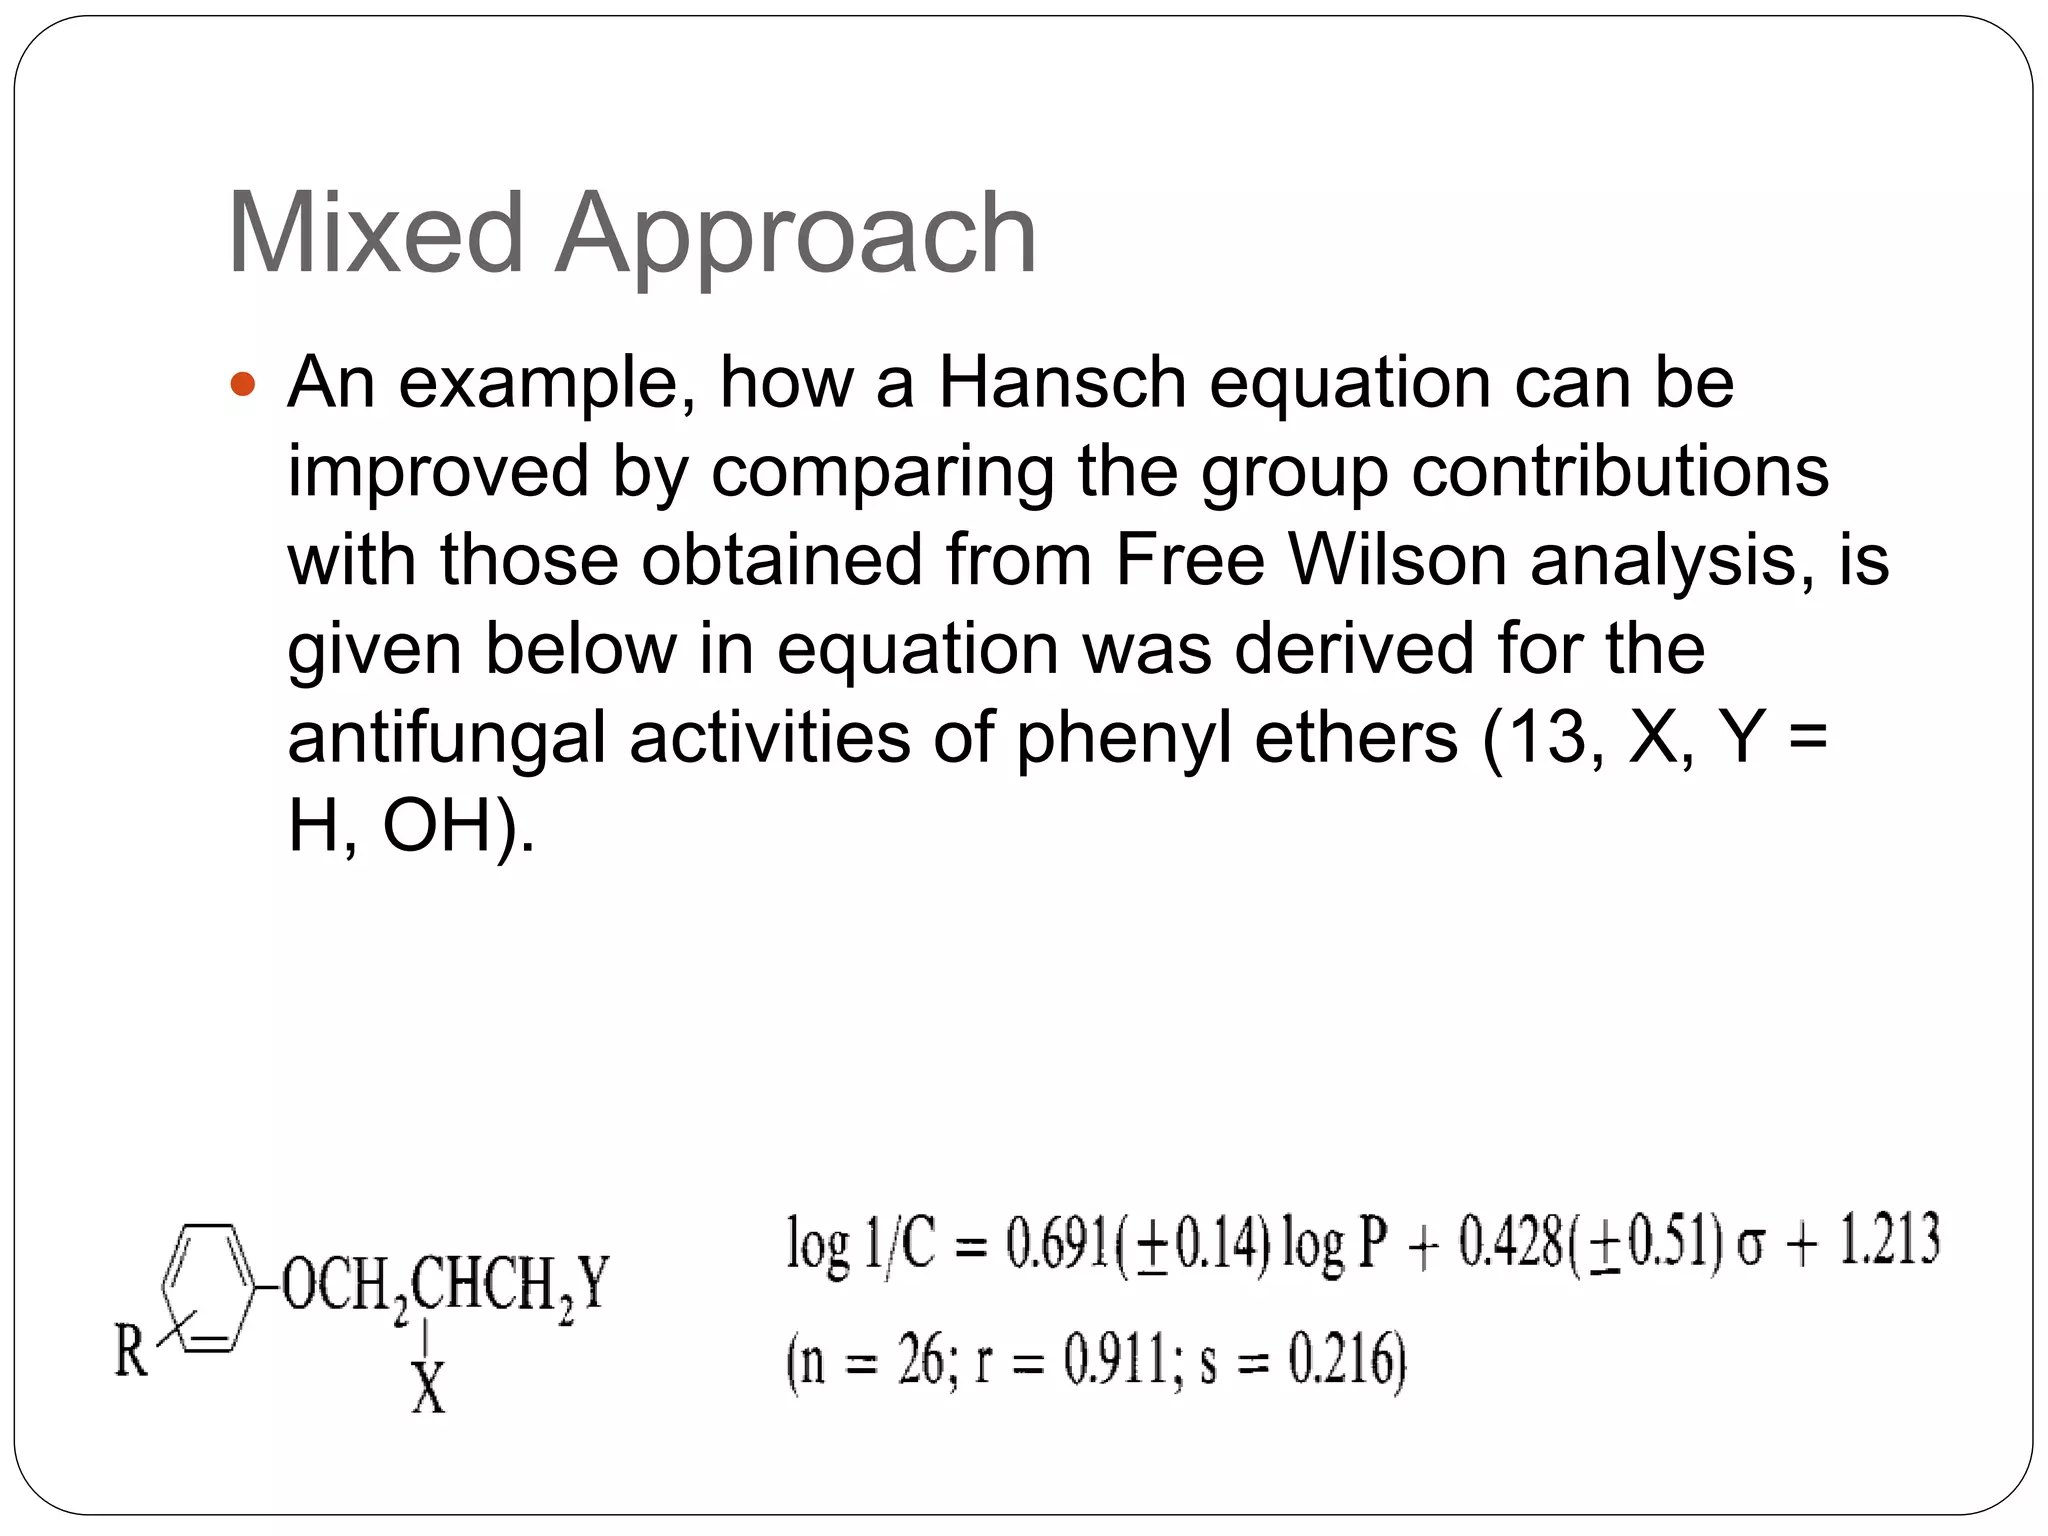
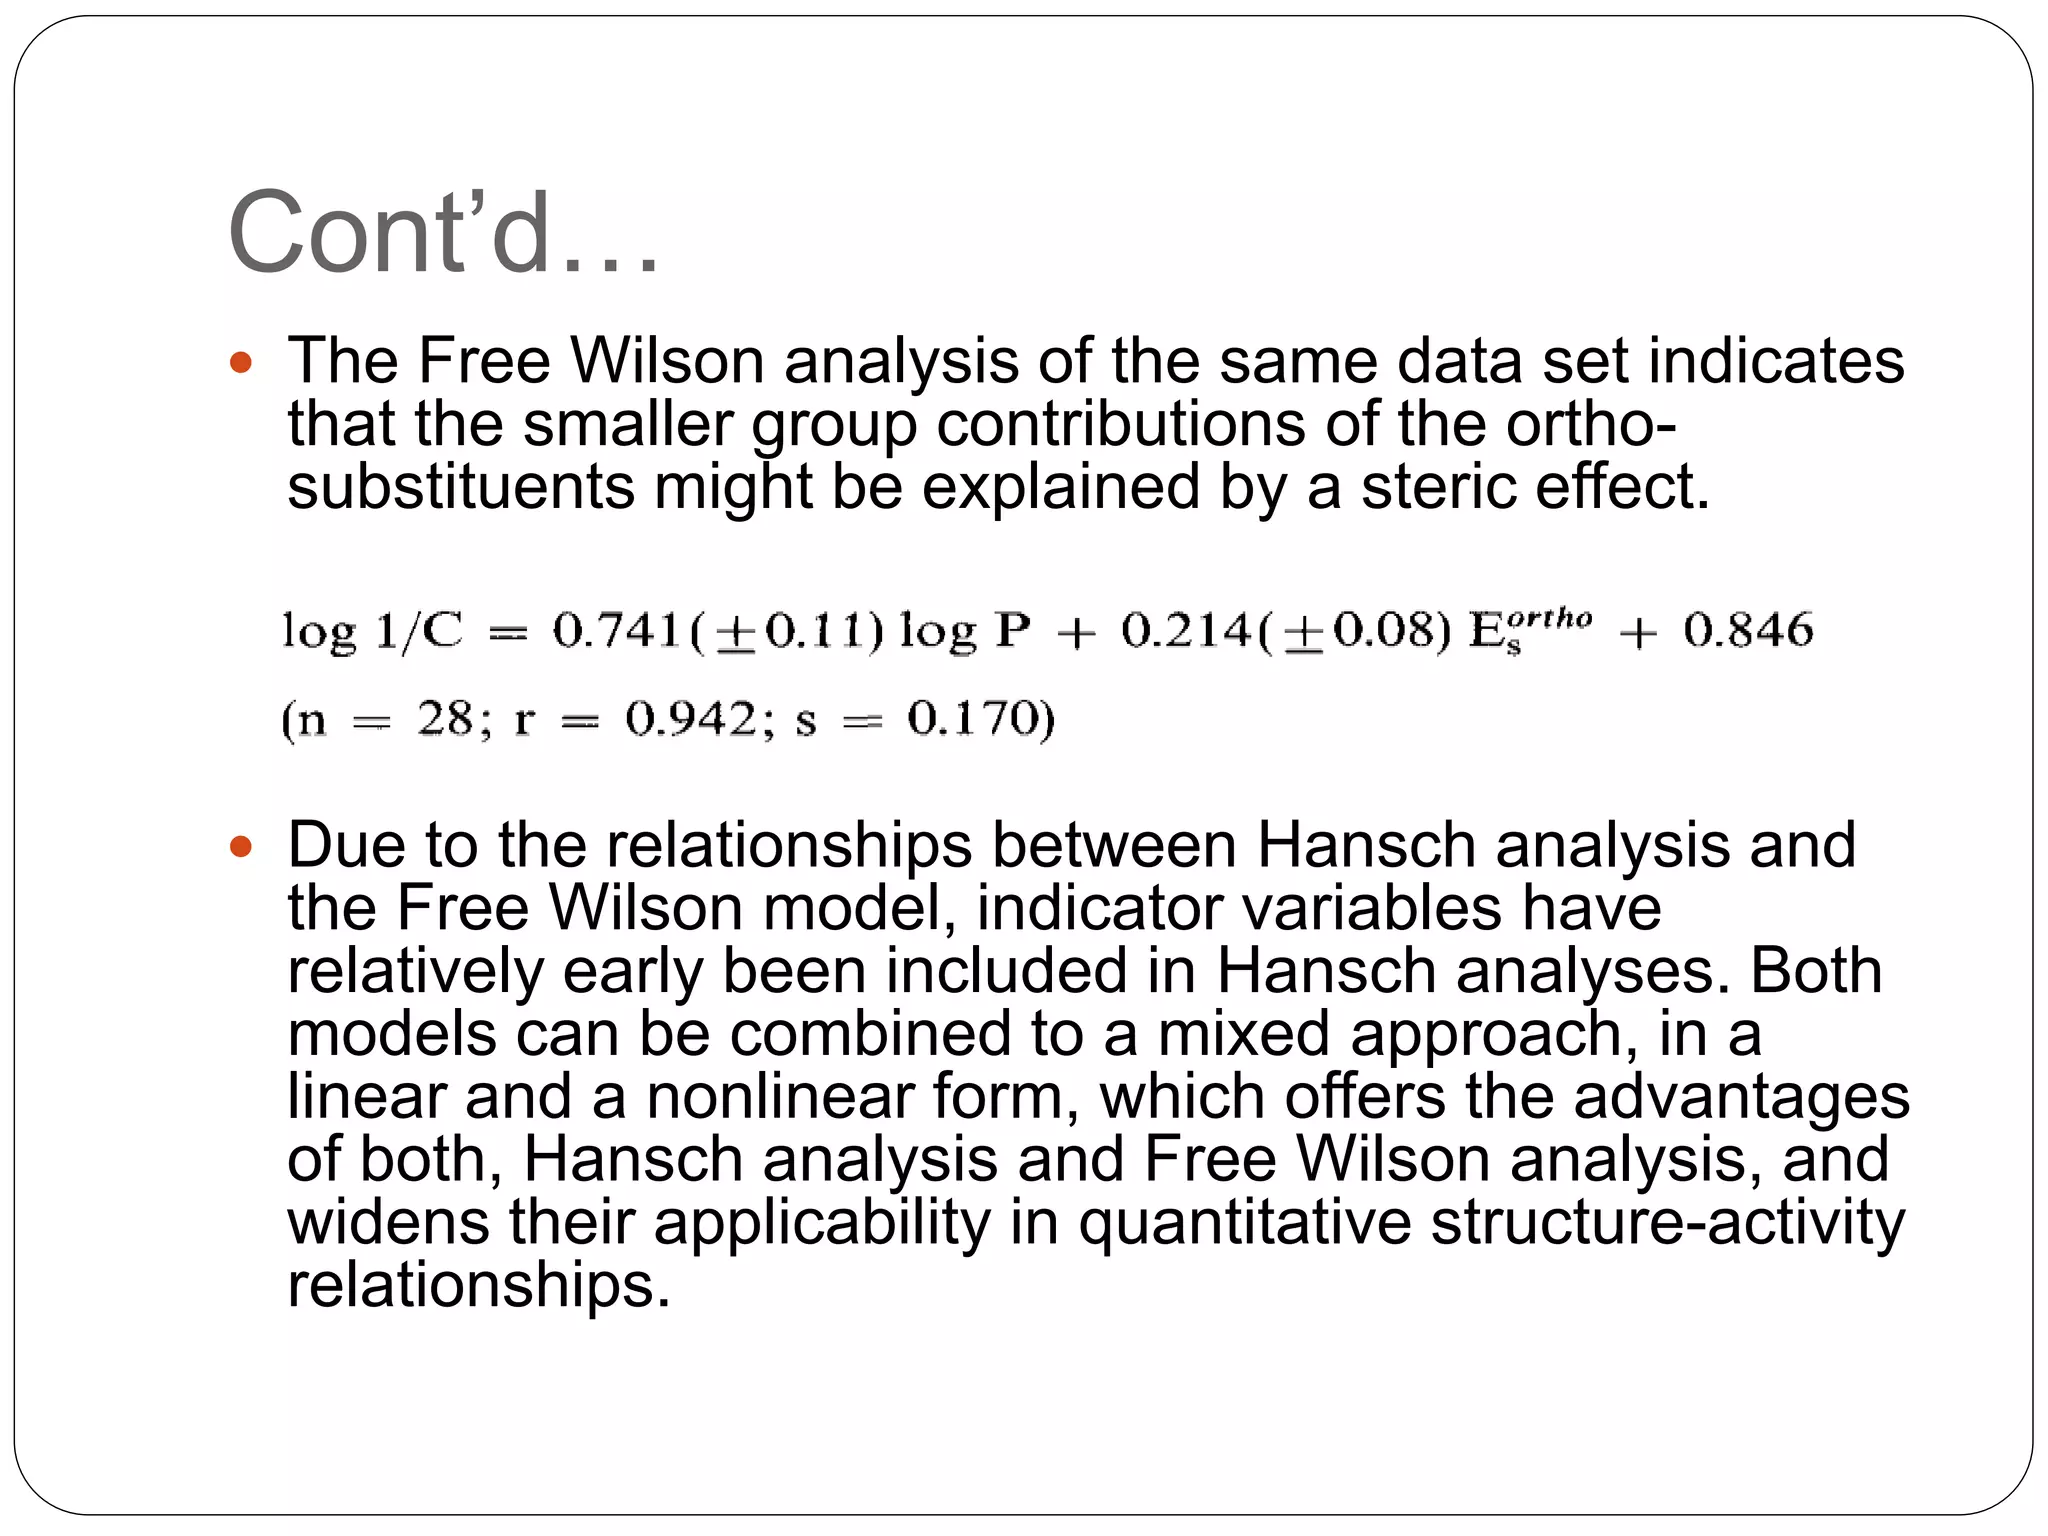
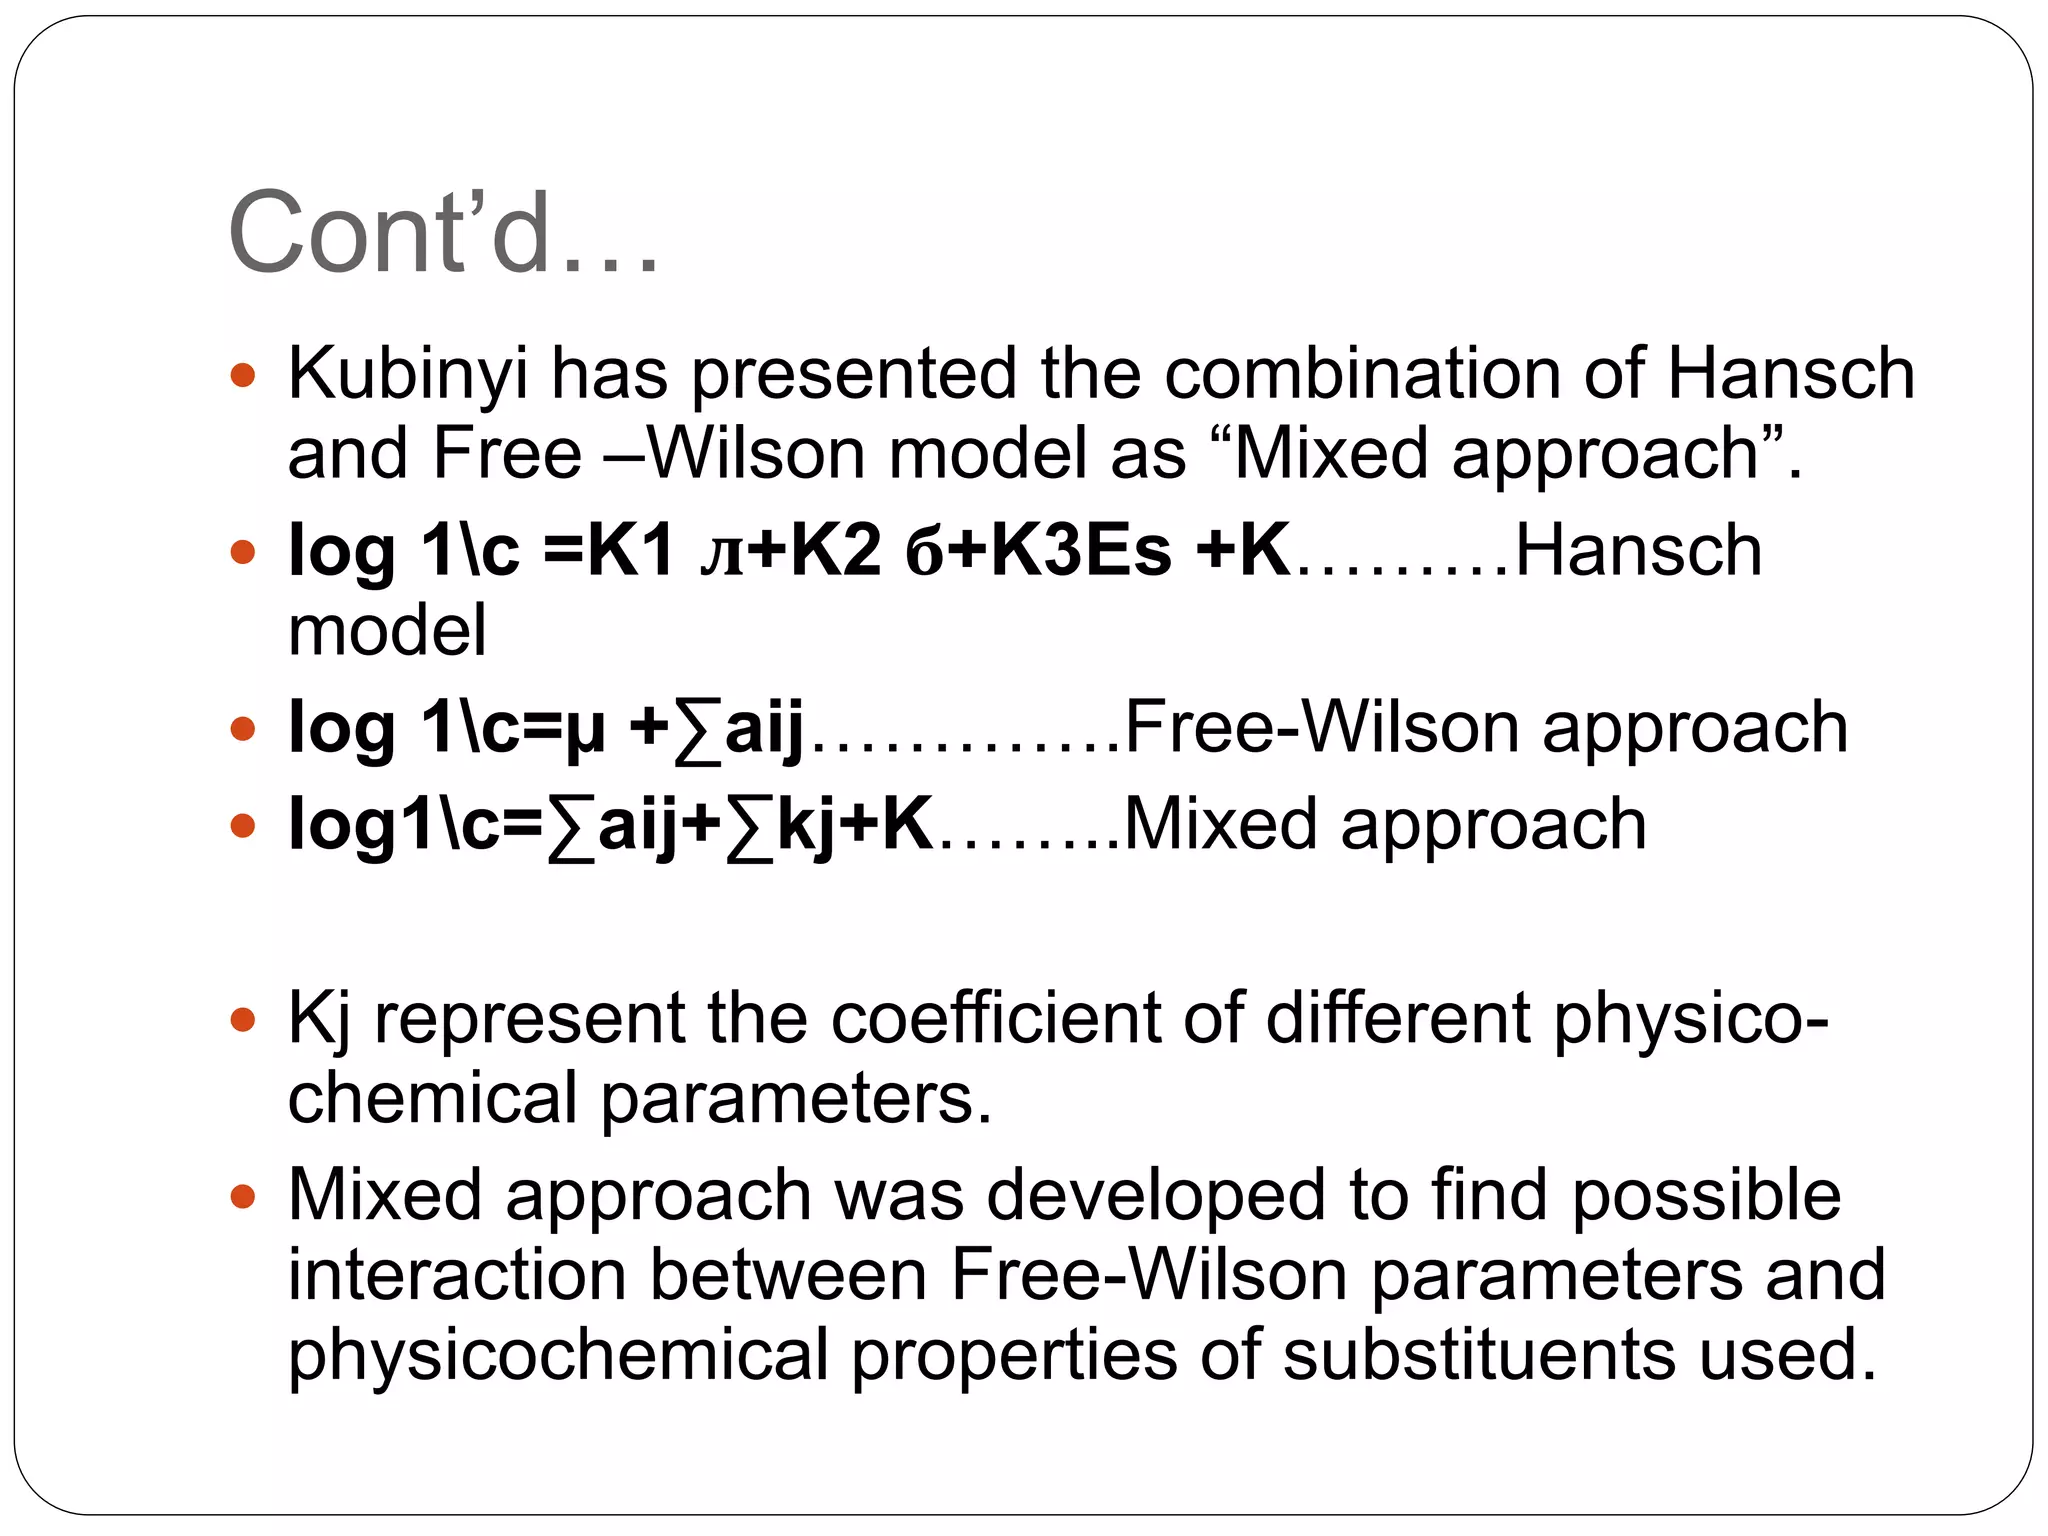


The document discusses QSAR (Quantitative Structure-Activity Relationship) models, focusing on Hansch analysis and Free-Wilson analysis, detailing their methodologies, applications, and limitations. Hansch analysis correlates biological activity with physicochemical properties using multiparameter equations, while Free-Wilson analysis leverages group contributions for substituent effects in biological activity. The text explores the mixed approach that combines both models to enhance predictive capabilities in drug development.