Downloaded 473 times


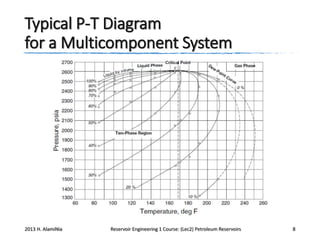

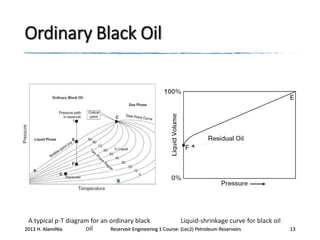
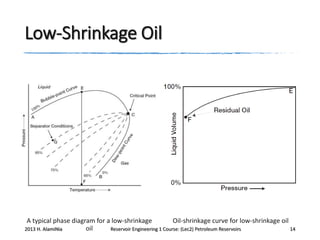
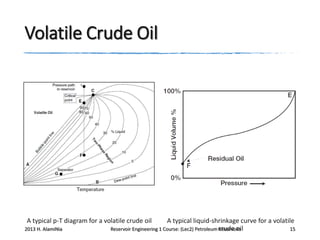
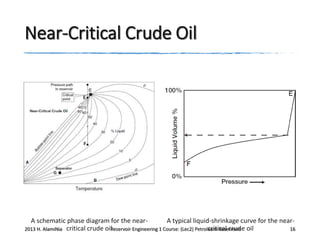

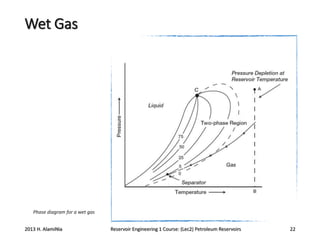
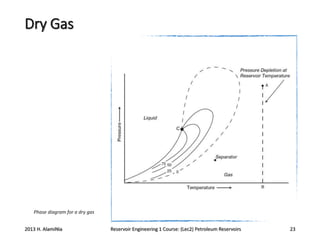
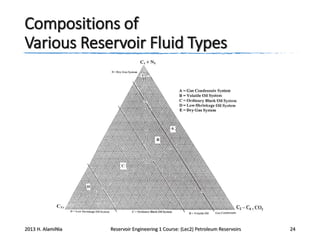


This document covers reservoir engineering concepts related to petroleum reservoirs. It discusses the classification of oil and gas reservoirs based on phase behavior and pressure-temperature relationships. It also summarizes key reservoir fluid properties for both gas and crude oil, including compressibility factors, density, molecular weight, and formation volume factors. The behaviors of real gases are contrasted with ideal gases and methods for determining compressibility factors are presented.