Downloaded 63 times
![Bt Calculation
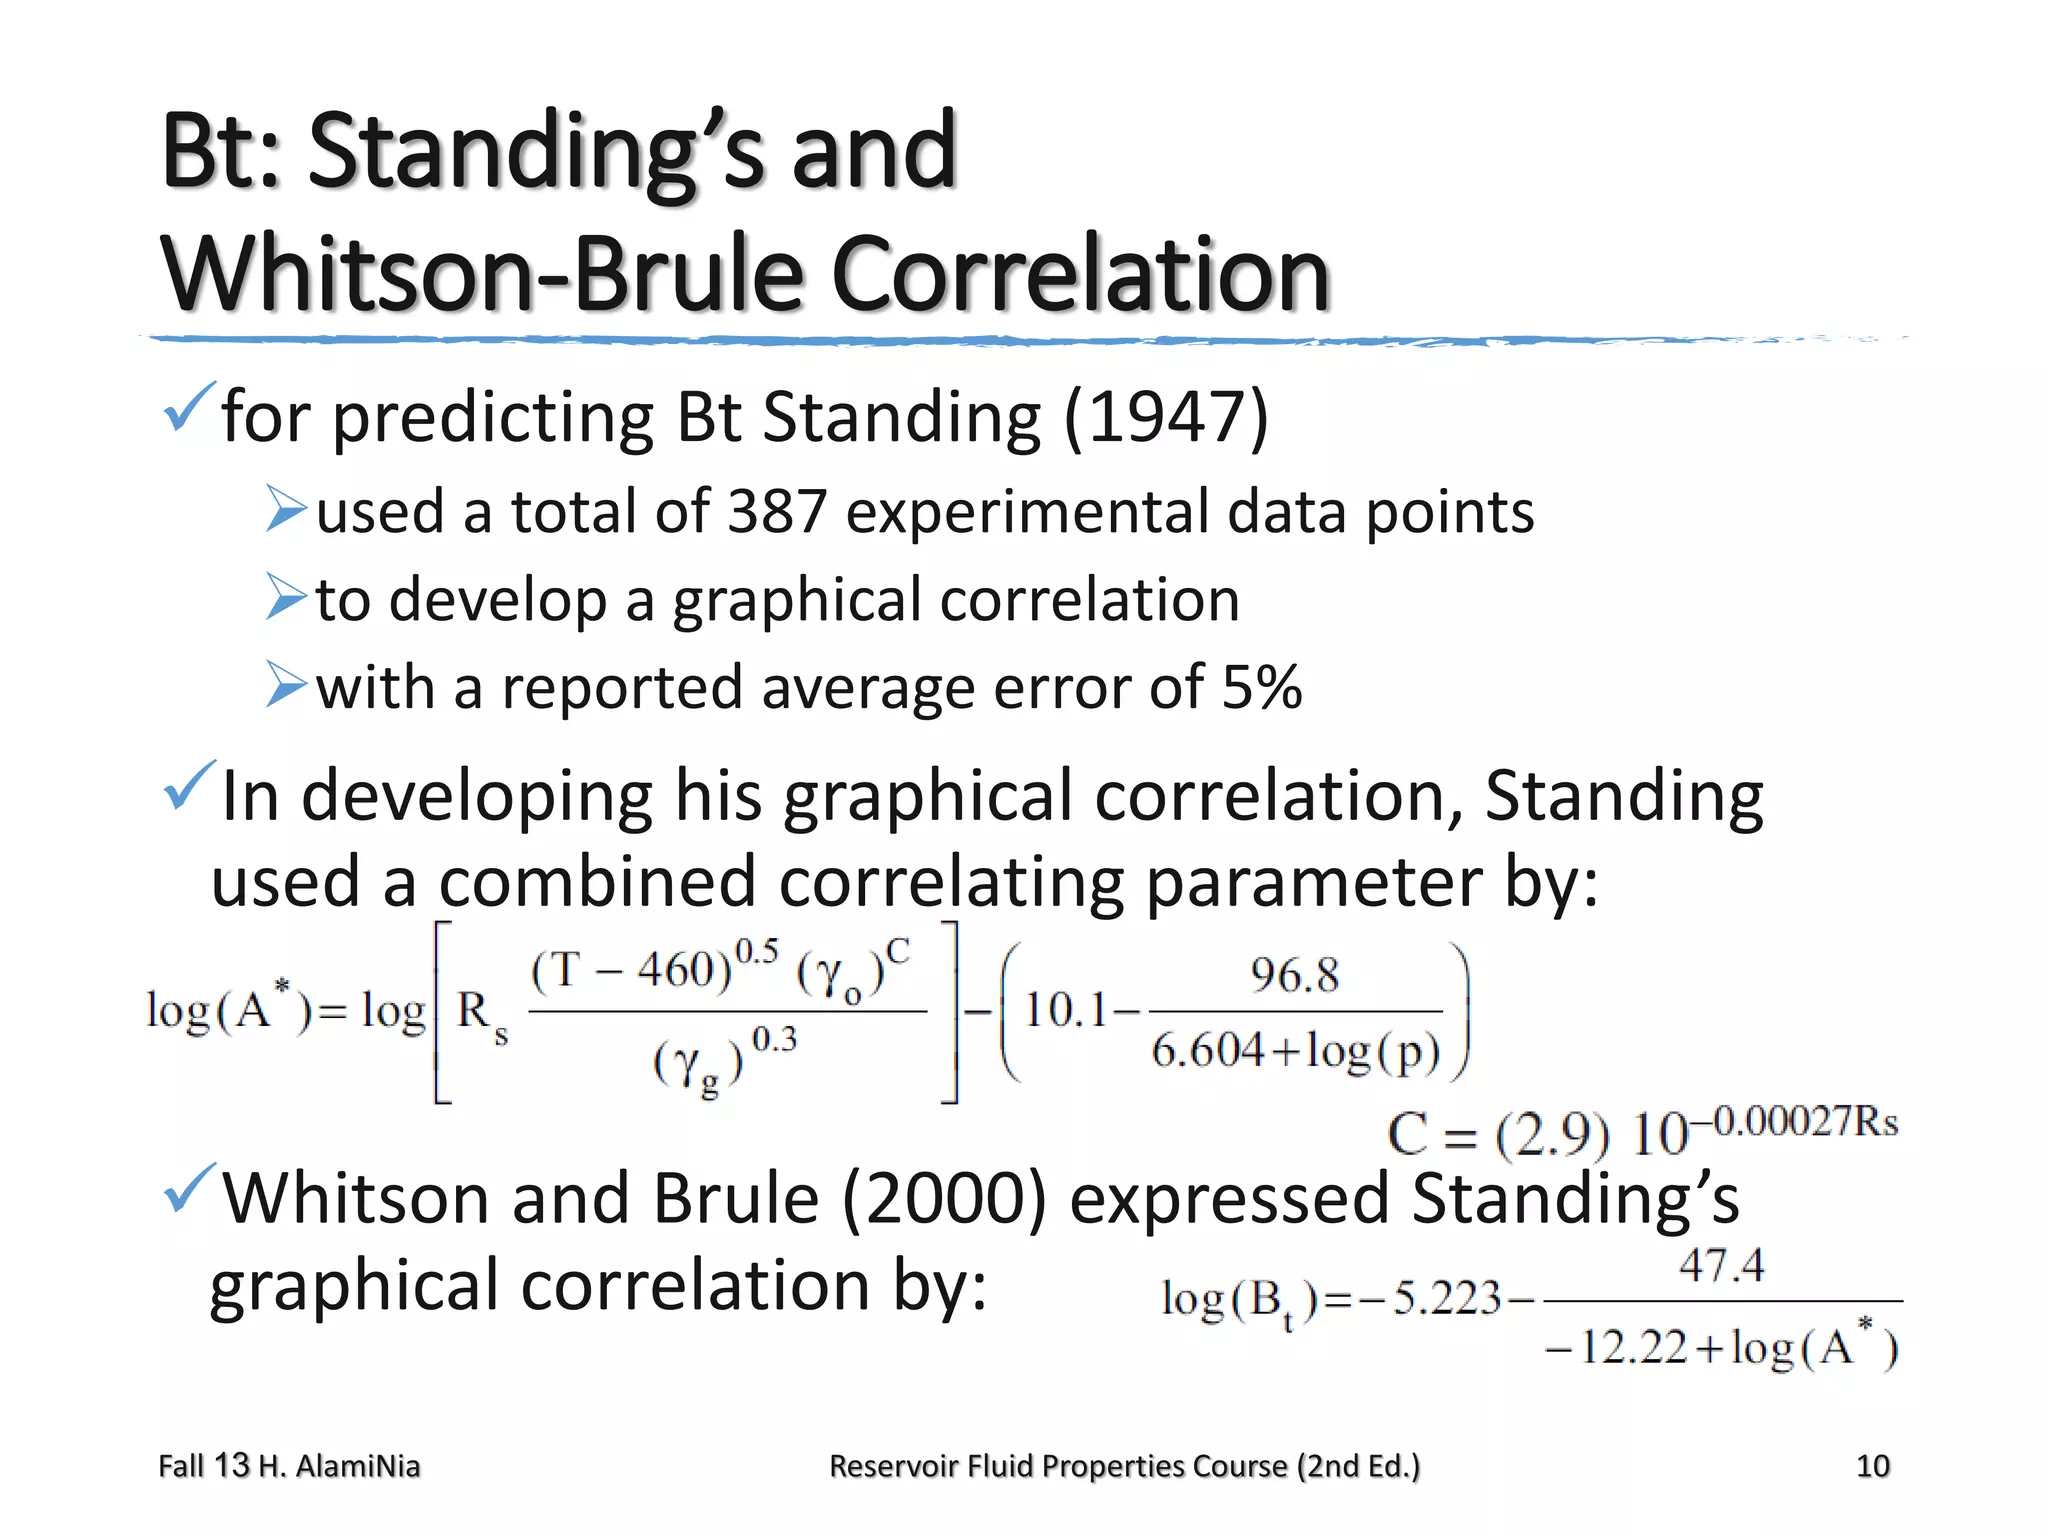
The volume of
There are several
the free gas
correlations that
at the cell conditions is
can be used to estimate
the two phase formation
(Vg)p,T [bbl of gas/STB of volume factor
when the experimental
oil] and Bg [bbl/scf]
data are not available;
The volume of
the remaining oil
three of these methods
at the cell condition is
are:
from the definition
Fall 13 H. AlamiNia
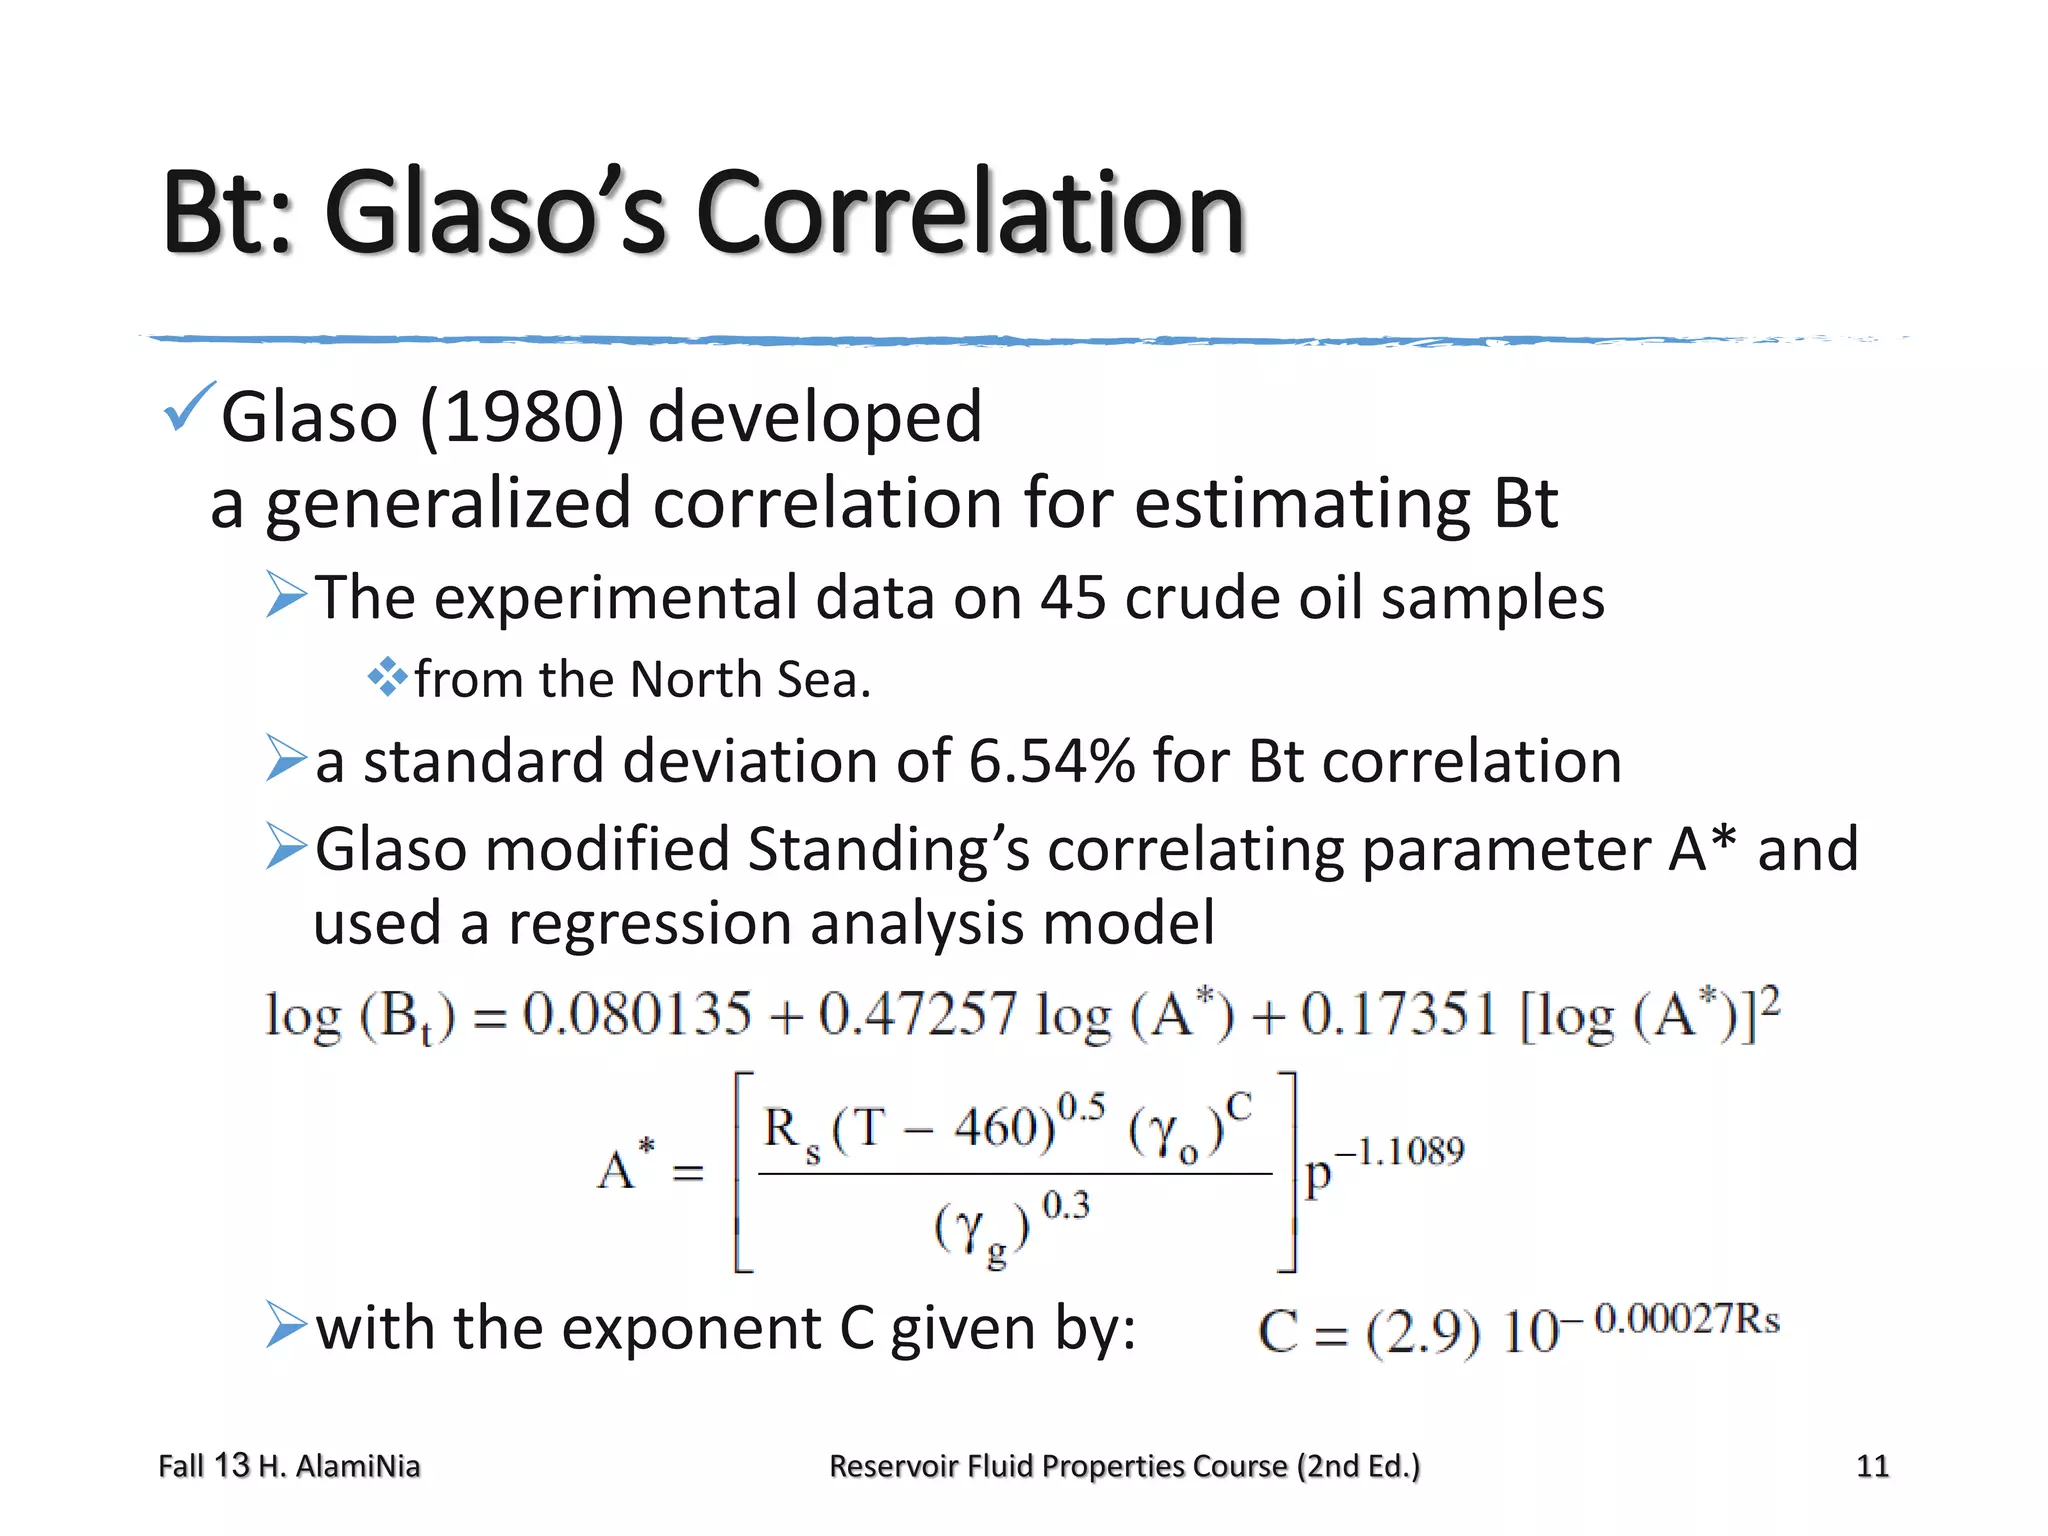
Standing’s correlations
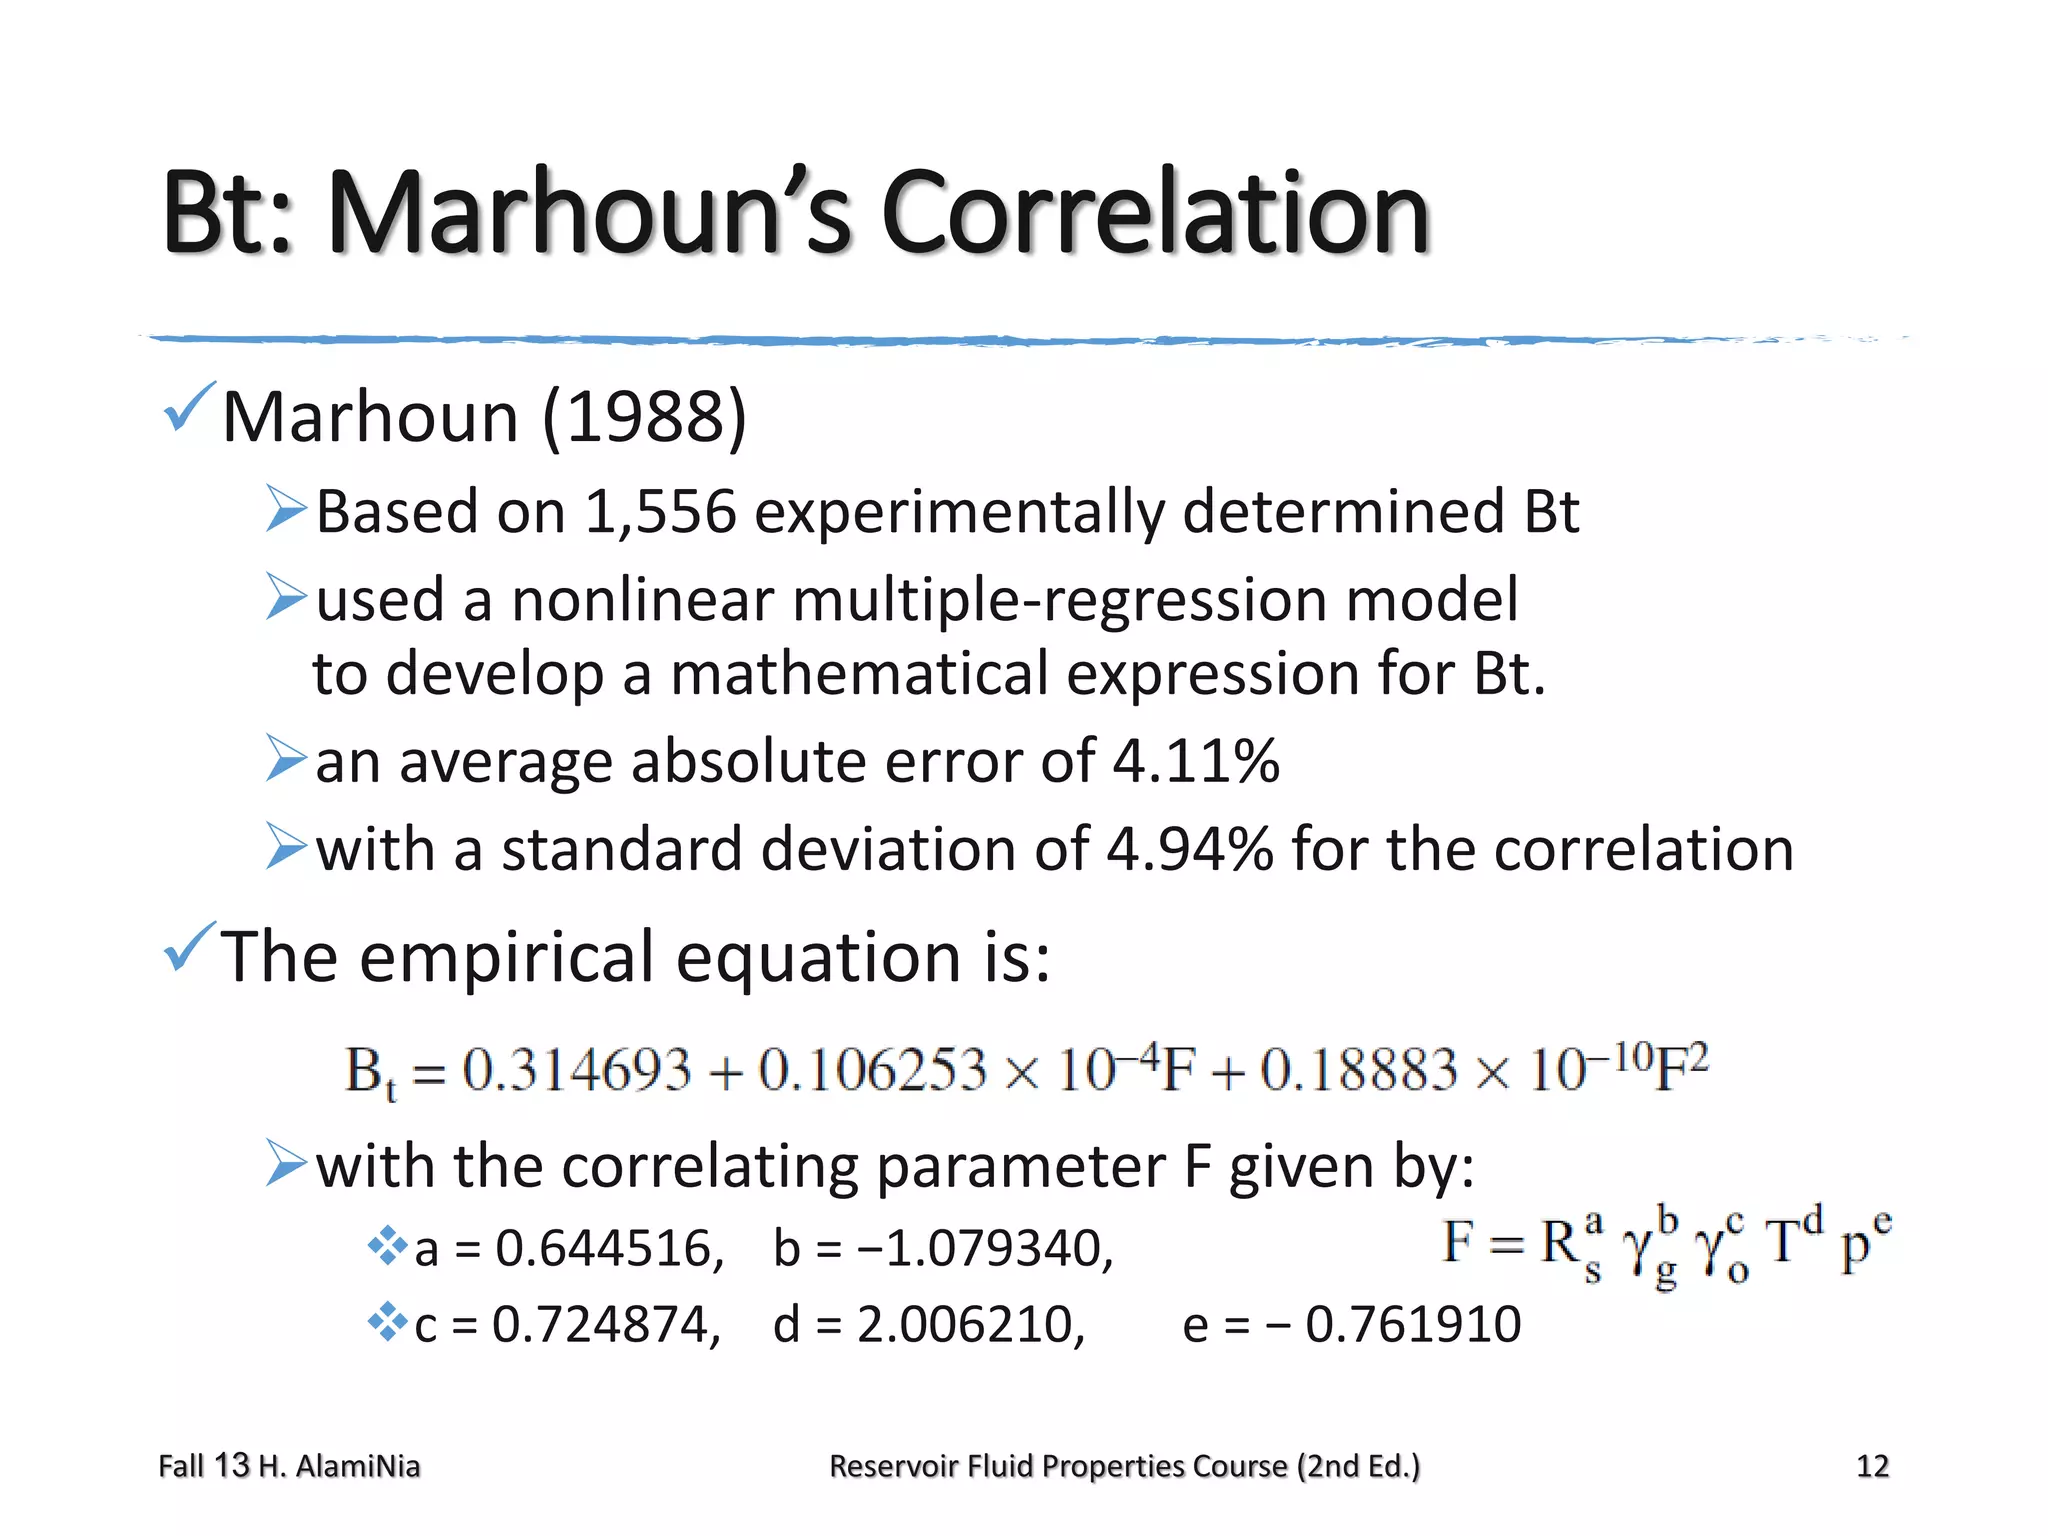
Glaso’s method
Marhoun’s correlation
Reservoir Fluid Properties Course (2nd Ed.)
9](https://image.slidesharecdn.com/q921-rfp-20lec8-20v1-131126031951-phpapp01/75/Q921-rfp-lec8-v1-9-2048.jpg)


This document provides an overview of reservoir fluid properties, including crude oil, water, and gas properties. It discusses key properties such as formation volume factors, viscosity, surface tension, and gas solubility. It summarizes various empirical correlations used to estimate these properties based on temperature, pressure, oil composition and other factors. The document is from a course on reservoir fluid properties and focuses on definitions and methods for calculating important PVT properties.


