Downloaded 139 times


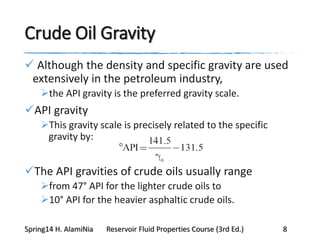
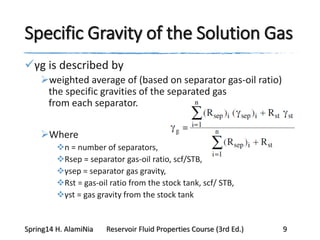


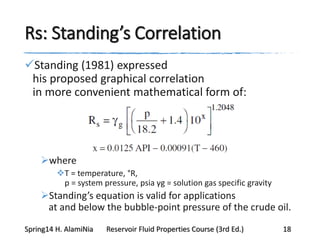
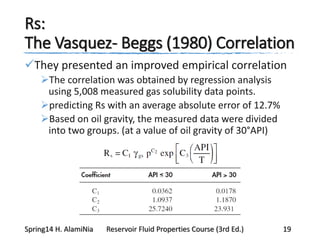
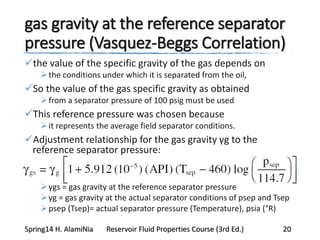
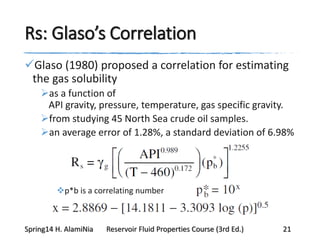
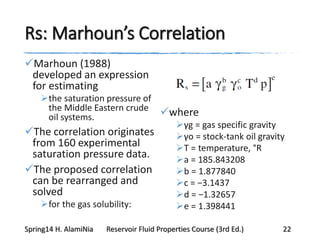
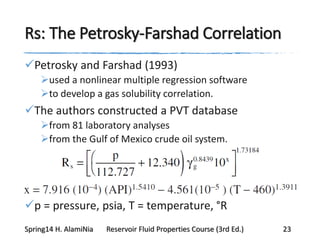
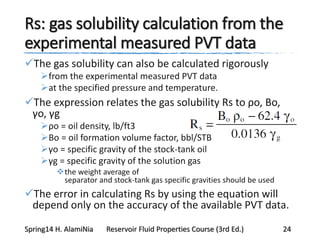


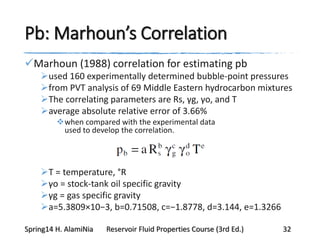
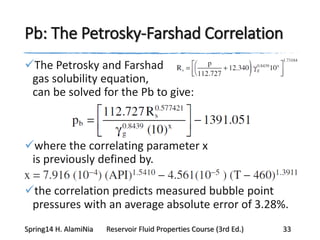


This document provides an overview of methods for calculating properties of reservoir fluids including gas and crude oil. It discusses empirical correlations for calculating z-factors, gas properties like compressibility and viscosity, and crude oil properties like density, solubility of dissolved gas, and bubble point pressure. The key empirical correlations presented for estimating gas solubility (Rs) and methods for determining bubble point pressure are Standing, Vasquez-Beggs, Glaso, Marhoun, Petrosky-Farshad, and correlations based on experimental PVT data.


