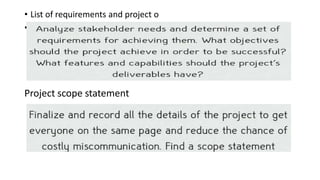
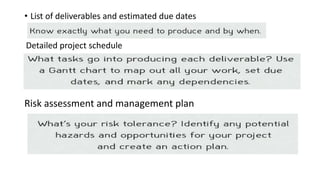
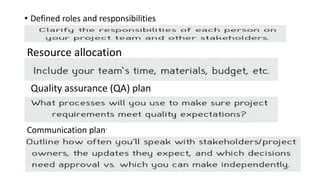
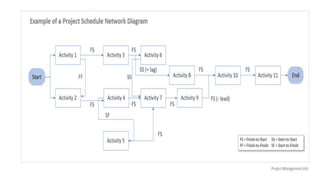
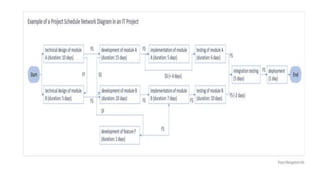
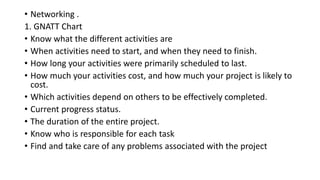
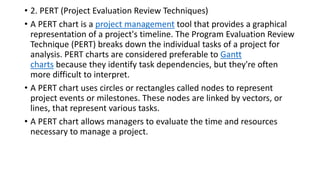
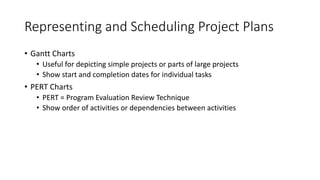
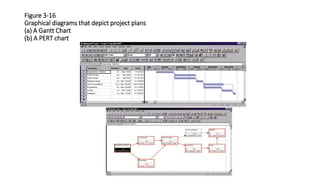
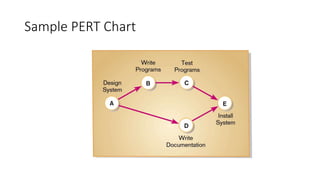
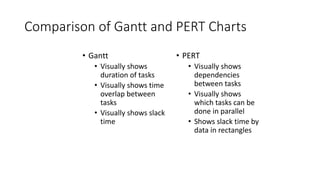
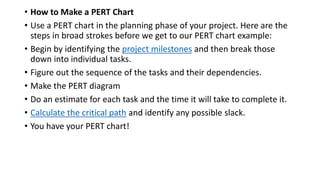
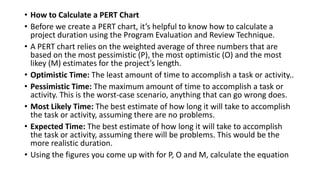
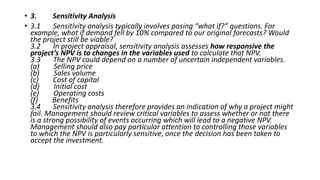
Essentials of Entrepreneurship
CA A G Krishnan
9886217080
agk_1954@yahoo.com
Entrepreneurship - topics to cover
• Project Identification
• Project formulation
• Project Design and Network Analysis
• Project Evaluation
• Project Appraisal
• Project Report Preparation
• Project Management
• Technical, Financial, Marketing, Personnel and Management Feasibility
• Estimating Fund Requirement and Fund Raising
• Venture Capital Funding.
Project Design
• Project design is an early phase of the project where a project's key
features, structure, criteria for success, and major deliverables are all
planned out.
• The aim is to develop one or more designs that can be used to
achieve the desired project goals.
• Stakeholders can then choose the best design to use for the
execution of the project.
• The project design phase might generate a variety of different
outputs, including sketches, flowcharts, site trees, HTML screen
designs, prototypes, photo impressions, and more.
Project Plan – Essential elements
• Outline of business justification and stakeholder needs
• List of requirements and project objectives
• Project scope statement
• List of deliverables and estimated due dates
• Detailed project schedule
• Risk assessment and management plan
• Defined roles and responsibilities
• Resource allocation
• Quality assurance (QA) plan
• Communication plan
Outline of business justification and stakeholder needs
• List of requirements and project o
• bjectives
Project scope statement
• List of deliverables and estimated due dates
Detailed project schedule
Risk assessment and management plan
• Defined roles and responsibilities
Resource allocation
Quality assurance (QA) plan
Communication plan`
• Networking .
1. GNATT Chart
• Know what the different activities are
• When activities need to start, and when they need to finish.
• How long your activities were primarily scheduled to last.
• How much your activities cost, and how much your project is likely to
cost.
• Which activities depend on others to be effectively completed.
• Current progress status.
• The duration of the entire project.
• Know who is responsible for each task
• Find and take care of any problems associated with the project
• 2. PERT (Project Evaluation Review Techniques)
• A PERT chart is a project management tool that provides a graphical
representation of a project's timeline. The Program Evaluation Review
Technique (PERT) breaks down the individual tasks of a project for
analysis. PERT charts are considered preferable to Gantt
charts because they identify task dependencies, but they're often
more difficult to interpret.
• A PERT chart uses circles or rectangles called nodes to represent
project events or milestones. These nodes are linked by vectors, or
lines, that represent various tasks.
• A PERT chart allows managers to evaluate the time and resources
necessary to manage a project.
Representing and Scheduling Project Plans
• Gantt Charts
• Useful for depicting simple projects or parts of large projects
• Show start and completion dates for individual tasks
• PERT Charts
• PERT = Program Evaluation Review Technique
• Show order of activities or dependencies between activities
Figure 3-16
Graphical diagrams that depict project plans
(a) A Gantt Chart
(b) A PERT chart
Sample PERT Chart
Comparison of Gantt and PERT Charts
• Gantt
• Visually shows
duration of tasks
• Visually shows time
overlap between
tasks
• Visually shows slack
time
• PERT
• Visually shows
dependencies
between tasks
• Visually shows
which tasks can be
done in parallel
• Shows slack time by
data in rectangles
• How to Make a PERT Chart
• Use a PERT chart in the planning phase of your project. Here are the
steps in broad strokes before we get to our PERT chart example:
• Begin by identifying the project milestones and then break those
down into individual tasks.
• Figure out the sequence of the tasks and their dependencies.
• Make the PERT diagram
• Do an estimate for each task and the time it will take to complete it.
• Calculate the critical path and identify any possible slack.
• You have your PERT chart!
• How to Calculate a PERT Chart
• Before we create a PERT chart, it’s helpful to know how to calculate a
project duration using the Program Evaluation and Review Technique.
• A PERT chart relies on the weighted average of three numbers that are
based on the most pessimistic (P), the most optimistic (O) and the most
likey (M) estimates for the project’s length.
• Optimistic Time: The least amount of time to accomplish a task or activity..
• Pessimistic Time: The maximum amount of time to accomplish a task or
activity. This is the worst-case scenario, anything that can go wrong does.
• Most Likely Time: The best estimate of how long it will take to accomplish
the task or activity, assuming there are no problems.
• Expected Time: The best estimate of how long it will take to accomplish
the task or activity, assuming there will be problems. This would be the
more realistic duration.
• Using the figures you come up with for P, O and M, calculate the equation
• How to Use the PERT Chart Formula
• Using the optimistic, most likely, and pessimistic time estimates, you can
use the PERT formula to calculate the expected duration of a task:
• (O + (4*M) + P) / 6
• The result is a weighted average, which is an average from multiplying each
element by a factor that reflects its importance. You can think of this as the
expected time, though often the calculation will bend towards the
pessimistic. The result of this formula will be the value that you’ll assign to
the arrows in our PERT chart example.
• What Is the PERT Chart Standard Deviation?
• To determine the standard deviation of the estimated duration of an
activity, subtract the pessimistic number from the optimistic one and divide
the results by six. The larger your results, the less confidence you have in
your estimate, and vice versa.
• (P-O) / 6
• 3. Sensitivity Analysis
• 3.1 Sensitivity analysis typically involves posing “what if?” questions. For
example, what if demand fell by 10% compared to our original forecasts? Would
the project still be viable?
3.2 In project appraisal, sensitivity analysis assesses how responsive the
project’s NPV is to changes in the variables used to calculate that NPV.
3.3 The NPV could depend on a number of uncertain independent variables.
(a) Selling price
(b) Sales volume
(c) Cost of capital
(d) Initial cost
(e) Operating costs
(f) Benefits
3.4 Sensitivity analysis therefore provides an indication of why a project might
fail. Management should review critical variables to assess whether or not there
is a strong possibility of events occurring which will lead to a negative NPV.
Management should also pay particular attention to controlling those variables
to which the NPV is particularly sensitive, once the decision has been taken to
accept the investment.

Ppt.pptx

  • 1.
    Essentials of Entrepreneurship CAA G Krishnan 9886217080 agk_1954@yahoo.com
  • 2.
    Entrepreneurship - topicsto cover • Project Identification • Project formulation • Project Design and Network Analysis • Project Evaluation • Project Appraisal • Project Report Preparation • Project Management • Technical, Financial, Marketing, Personnel and Management Feasibility • Estimating Fund Requirement and Fund Raising • Venture Capital Funding.
  • 7.
    Project Design • Projectdesign is an early phase of the project where a project's key features, structure, criteria for success, and major deliverables are all planned out. • The aim is to develop one or more designs that can be used to achieve the desired project goals. • Stakeholders can then choose the best design to use for the execution of the project. • The project design phase might generate a variety of different outputs, including sketches, flowcharts, site trees, HTML screen designs, prototypes, photo impressions, and more.
  • 8.
    Project Plan –Essential elements • Outline of business justification and stakeholder needs • List of requirements and project objectives • Project scope statement • List of deliverables and estimated due dates • Detailed project schedule • Risk assessment and management plan • Defined roles and responsibilities • Resource allocation • Quality assurance (QA) plan • Communication plan
  • 9.
    Outline of businessjustification and stakeholder needs
  • 10.
    • List ofrequirements and project o • bjectives Project scope statement
  • 11.
    • List ofdeliverables and estimated due dates Detailed project schedule Risk assessment and management plan
  • 12.
    • Defined rolesand responsibilities Resource allocation Quality assurance (QA) plan Communication plan`
  • 15.
    • Networking . 1.GNATT Chart • Know what the different activities are • When activities need to start, and when they need to finish. • How long your activities were primarily scheduled to last. • How much your activities cost, and how much your project is likely to cost. • Which activities depend on others to be effectively completed. • Current progress status. • The duration of the entire project. • Know who is responsible for each task • Find and take care of any problems associated with the project
  • 16.
    • 2. PERT(Project Evaluation Review Techniques) • A PERT chart is a project management tool that provides a graphical representation of a project's timeline. The Program Evaluation Review Technique (PERT) breaks down the individual tasks of a project for analysis. PERT charts are considered preferable to Gantt charts because they identify task dependencies, but they're often more difficult to interpret. • A PERT chart uses circles or rectangles called nodes to represent project events or milestones. These nodes are linked by vectors, or lines, that represent various tasks. • A PERT chart allows managers to evaluate the time and resources necessary to manage a project.
  • 17.
    Representing and SchedulingProject Plans • Gantt Charts • Useful for depicting simple projects or parts of large projects • Show start and completion dates for individual tasks • PERT Charts • PERT = Program Evaluation Review Technique • Show order of activities or dependencies between activities
  • 18.
    Figure 3-16 Graphical diagramsthat depict project plans (a) A Gantt Chart (b) A PERT chart
  • 19.
  • 20.
    Comparison of Ganttand PERT Charts • Gantt • Visually shows duration of tasks • Visually shows time overlap between tasks • Visually shows slack time • PERT • Visually shows dependencies between tasks • Visually shows which tasks can be done in parallel • Shows slack time by data in rectangles
  • 21.
    • How toMake a PERT Chart • Use a PERT chart in the planning phase of your project. Here are the steps in broad strokes before we get to our PERT chart example: • Begin by identifying the project milestones and then break those down into individual tasks. • Figure out the sequence of the tasks and their dependencies. • Make the PERT diagram • Do an estimate for each task and the time it will take to complete it. • Calculate the critical path and identify any possible slack. • You have your PERT chart!
  • 22.
    • How toCalculate a PERT Chart • Before we create a PERT chart, it’s helpful to know how to calculate a project duration using the Program Evaluation and Review Technique. • A PERT chart relies on the weighted average of three numbers that are based on the most pessimistic (P), the most optimistic (O) and the most likey (M) estimates for the project’s length. • Optimistic Time: The least amount of time to accomplish a task or activity.. • Pessimistic Time: The maximum amount of time to accomplish a task or activity. This is the worst-case scenario, anything that can go wrong does. • Most Likely Time: The best estimate of how long it will take to accomplish the task or activity, assuming there are no problems. • Expected Time: The best estimate of how long it will take to accomplish the task or activity, assuming there will be problems. This would be the more realistic duration. • Using the figures you come up with for P, O and M, calculate the equation
  • 23.
    • How toUse the PERT Chart Formula • Using the optimistic, most likely, and pessimistic time estimates, you can use the PERT formula to calculate the expected duration of a task: • (O + (4*M) + P) / 6 • The result is a weighted average, which is an average from multiplying each element by a factor that reflects its importance. You can think of this as the expected time, though often the calculation will bend towards the pessimistic. The result of this formula will be the value that you’ll assign to the arrows in our PERT chart example. • What Is the PERT Chart Standard Deviation? • To determine the standard deviation of the estimated duration of an activity, subtract the pessimistic number from the optimistic one and divide the results by six. The larger your results, the less confidence you have in your estimate, and vice versa. • (P-O) / 6
  • 31.
    • 3. SensitivityAnalysis • 3.1 Sensitivity analysis typically involves posing “what if?” questions. For example, what if demand fell by 10% compared to our original forecasts? Would the project still be viable? 3.2 In project appraisal, sensitivity analysis assesses how responsive the project’s NPV is to changes in the variables used to calculate that NPV. 3.3 The NPV could depend on a number of uncertain independent variables. (a) Selling price (b) Sales volume (c) Cost of capital (d) Initial cost (e) Operating costs (f) Benefits 3.4 Sensitivity analysis therefore provides an indication of why a project might fail. Management should review critical variables to assess whether or not there is a strong possibility of events occurring which will lead to a negative NPV. Management should also pay particular attention to controlling those variables to which the NPV is particularly sensitive, once the decision has been taken to accept the investment.