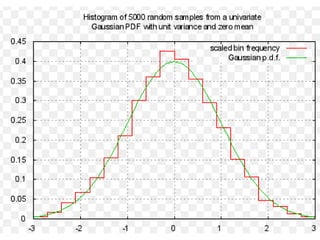
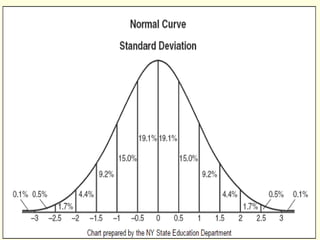
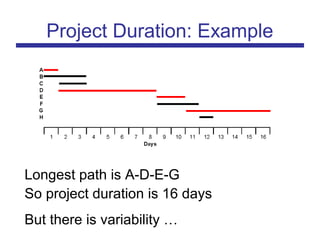
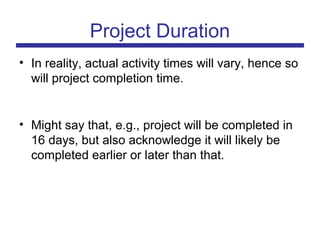
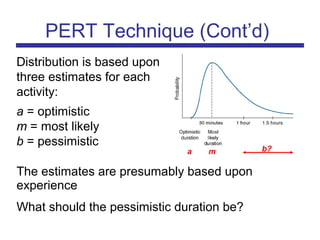
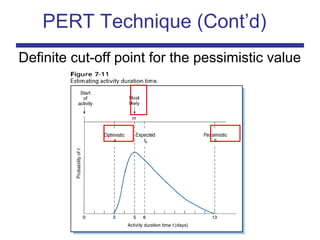
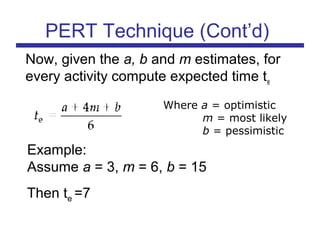
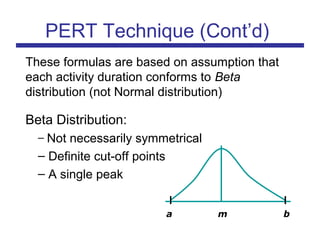
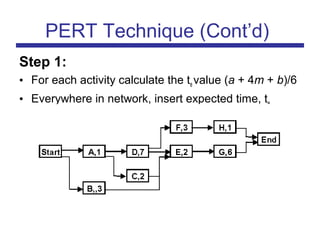
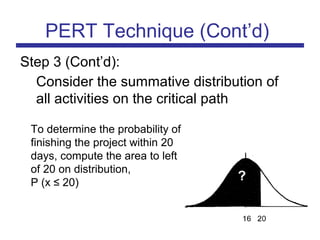
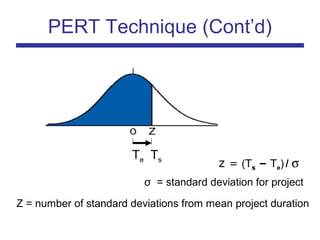
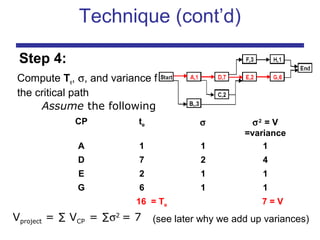
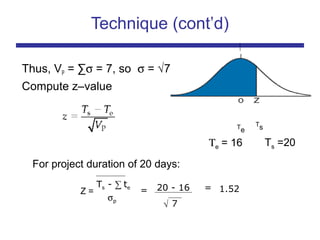
PERT
Dr. Ali Abbas
Lecture 3
Variability of Activity Duration
Until now we considered estimates of activity
duration to be “most likely” times: a single,
deterministic value for each activity and,
hence, for project completion time
Variability of Activity Duration
The duration of an activity is not fixed
Consider the time it takes to drive to some destination
Project Duration –Variability of Activity
Duration
Activity duration is not a single, deterministic value
There is a range of possible durations for most
activities
The range of possible activity durations can be
presented as a distribution curve:
Now consider a network of activities …
Project Duration –Variability of Activity
Duration
Project duration is determined by the duration of
activities on the critical path
But the duration of each activity is variable.
Each activity has a duration distribution:
Project Duration: Example
Longest path is A-D-E-G
So project duration is 16 days
But there is variability …
• In reality, actual activity times will vary, hence so
will project completion time.
• Might say that, e.g., project will be completed in
16 days, but also acknowledge it will likely be
completed earlier or later than that.
Project Duration
PERT:
Program
Evaluation
and Review
Technique
The PERT technique addresses variability of
the duration of activities on the critical path
The PERT Technique
(Program Evaluation & Review Technique)
PERT (cont’d)
• PERT is a method that treats completion times
as probabilistic events
• PERT was developed to deal with uncertainty in
projects, and to estimate project duration when
activity times are hard to estimate
• PERT answers questions e.g.
– What is probability of completing project within 20
days?
PERT history
Was developed in the 1950’s for
the USA Polaris Missile-submarine
program
• USA Naval Office of Special Projects
• Lockheed Corporation
(now Lockheed-Martin)
• Booz, Allen, Hamilton Corporation
PERT Technique
Assume duration of every activity is range of times
represented by probability distribution
The estimates are presumably based upon
experience
What should the pessimistic duration be?
PERT Technique (Cont’d)
a m b?
Distribution is based upon
three estimates for each
activity:
a = optimistic
m = most likely
b = pessimistic
Definite cut-off point for the pessimistic value
PERT Technique (Cont’d)
Now, given the a, b and m estimates, for
every activity compute expected time te
Where a = optimistic
m = most likely
b = pessimistic
PERT Technique (Cont’d)
Example:
Assume a = 3, m = 6, b = 15
Then te =7
Also, given the a, b and m estimates, for
every activity compute the standard
deviation, σ
Example: assume a = 3, m = 6, b = 15
PERT Technique (Cont’d)
Then σ = 2
These formulas are based on assumption that
each activity duration conforms to Beta
distribution (not Normal distribution)
Beta Distribution:
– Not necessarily symmetrical
– Definite cut-off points
– A single peak
a m b
PERT Technique (Cont’d)
Step 1:
• For each activity calculate the te value (a + 4m + b)/6
• Everywhere in network, insert expected time, te
Assume times shown are te,
PERT Technique (Cont’d)
Step 2:
Identify the critical path, based on te values
CP is A-D-E-G, which indicates expected project
completion time is 16 days
What is probability that project will be completed in 20 days?
PERT Technique (Cont’d)
Assume distribution of project completion is normal,
not skewed
(justified by the Central Limit Theorem – discussed later)
PERT Technique (Cont’d)
σ = standard deviation of project duration
Step 3:
Consider the summative distribution of all
activities on the critical path
Step 3 (Cont’d)
Consider the summative distribution of all
activities on the critical path
PERT Technique (Cont’d)
An expected project
completion date of 16 days
means a 50% probability of
duration being less than 16
days, (and 50% probability
of it exceeding 16 days)
50%50%
Step 3 (Cont’d):
Consider the summative distribution of
all activities on the critical path
PERT Technique (Cont’d)
To determine the probability of
finishing the project within 20
days, compute the area to left
of 20 on distribution,
P (x ≤ 20)
?
PERT Technique (Cont’d)
Te Ts
Z = number of standard deviations from mean project duration
z = (Ts – Te) / σ
σ = standard deviation for project
Te = expected project duration = Σ t e
Ts = project completion time of interest
Τe = 16 Ts =20
Technique (cont’d)
T
e
T
s
Technique (cont’d)
Compute Te, σ, and variance for
the critical path
Vproject = ∑ VCP = ∑σ2
= 7
CP te σ σ2
= V
=variance
A 1 1 1
D 7 2 4
E 2 1 1
G 6 1 1
16 = Te 7 = V
Assume the following:
(see later why we add up variances)
Step 4:
Thus, VP = ∑σ = 7, so σ = √7
Compute z–value
Ts - ∑ te
σp
= 20 - 16 =
√ 7
1.52Z =
Technique (cont’d)
Τe = 16 Ts =20
T
e
T
s
For project duration of 20 days:
P (z ≤ 1.52) = 0.93
(approximately 93%. As estimates are used, higher
accuracy does not make sense)
Technique (cont’d)
Hence, conclude that there is a 93%
probability that the project will be
completed in 20 days or less
Technique (cont’d)
Summary: The Role of PERT
PERT does not reduce project duration
However, it does the following:
1. Given a network with estimates a, m, and b as well as a
value for project duration, it provides a probability figure
for finishing on time

Pert

  • 1.
  • 2.
    Variability of ActivityDuration Until now we considered estimates of activity duration to be “most likely” times: a single, deterministic value for each activity and, hence, for project completion time
  • 4.
    Variability of ActivityDuration The duration of an activity is not fixed Consider the time it takes to drive to some destination
  • 5.
    Project Duration –Variabilityof Activity Duration Activity duration is not a single, deterministic value There is a range of possible durations for most activities The range of possible activity durations can be presented as a distribution curve: Now consider a network of activities …
  • 6.
    Project Duration –Variabilityof Activity Duration Project duration is determined by the duration of activities on the critical path But the duration of each activity is variable. Each activity has a duration distribution:
  • 9.
    Project Duration: Example Longestpath is A-D-E-G So project duration is 16 days But there is variability …
  • 10.
    • In reality,actual activity times will vary, hence so will project completion time. • Might say that, e.g., project will be completed in 16 days, but also acknowledge it will likely be completed earlier or later than that. Project Duration
  • 11.
    PERT: Program Evaluation and Review Technique The PERTtechnique addresses variability of the duration of activities on the critical path The PERT Technique (Program Evaluation & Review Technique)
  • 12.
    PERT (cont’d) • PERTis a method that treats completion times as probabilistic events • PERT was developed to deal with uncertainty in projects, and to estimate project duration when activity times are hard to estimate • PERT answers questions e.g. – What is probability of completing project within 20 days?
  • 13.
    PERT history Was developedin the 1950’s for the USA Polaris Missile-submarine program • USA Naval Office of Special Projects • Lockheed Corporation (now Lockheed-Martin) • Booz, Allen, Hamilton Corporation
  • 14.
    PERT Technique Assume durationof every activity is range of times represented by probability distribution
  • 15.
    The estimates arepresumably based upon experience What should the pessimistic duration be? PERT Technique (Cont’d) a m b? Distribution is based upon three estimates for each activity: a = optimistic m = most likely b = pessimistic
  • 16.
    Definite cut-off pointfor the pessimistic value PERT Technique (Cont’d)
  • 17.
    Now, given thea, b and m estimates, for every activity compute expected time te Where a = optimistic m = most likely b = pessimistic PERT Technique (Cont’d) Example: Assume a = 3, m = 6, b = 15 Then te =7
  • 18.
    Also, given thea, b and m estimates, for every activity compute the standard deviation, σ Example: assume a = 3, m = 6, b = 15 PERT Technique (Cont’d) Then σ = 2
  • 19.
    These formulas arebased on assumption that each activity duration conforms to Beta distribution (not Normal distribution) Beta Distribution: – Not necessarily symmetrical – Definite cut-off points – A single peak a m b PERT Technique (Cont’d)
  • 20.
    Step 1: • Foreach activity calculate the te value (a + 4m + b)/6 • Everywhere in network, insert expected time, te Assume times shown are te, PERT Technique (Cont’d)
  • 21.
    Step 2: Identify thecritical path, based on te values CP is A-D-E-G, which indicates expected project completion time is 16 days What is probability that project will be completed in 20 days? PERT Technique (Cont’d)
  • 22.
    Assume distribution ofproject completion is normal, not skewed (justified by the Central Limit Theorem – discussed later) PERT Technique (Cont’d) σ = standard deviation of project duration Step 3: Consider the summative distribution of all activities on the critical path
  • 23.
    Step 3 (Cont’d) Considerthe summative distribution of all activities on the critical path PERT Technique (Cont’d) An expected project completion date of 16 days means a 50% probability of duration being less than 16 days, (and 50% probability of it exceeding 16 days) 50%50%
  • 24.
    Step 3 (Cont’d): Considerthe summative distribution of all activities on the critical path PERT Technique (Cont’d) To determine the probability of finishing the project within 20 days, compute the area to left of 20 on distribution, P (x ≤ 20) ?
  • 25.
    PERT Technique (Cont’d) TeTs Z = number of standard deviations from mean project duration z = (Ts – Te) / σ σ = standard deviation for project
  • 26.
    Te = expectedproject duration = Σ t e Ts = project completion time of interest Τe = 16 Ts =20 Technique (cont’d) T e T s
  • 27.
    Technique (cont’d) Compute Te,σ, and variance for the critical path Vproject = ∑ VCP = ∑σ2 = 7 CP te σ σ2 = V =variance A 1 1 1 D 7 2 4 E 2 1 1 G 6 1 1 16 = Te 7 = V Assume the following: (see later why we add up variances) Step 4:
  • 28.
    Thus, VP =∑σ = 7, so σ = √7 Compute z–value Ts - ∑ te σp = 20 - 16 = √ 7 1.52Z = Technique (cont’d) Τe = 16 Ts =20 T e T s For project duration of 20 days:
  • 29.
    P (z ≤1.52) = 0.93 (approximately 93%. As estimates are used, higher accuracy does not make sense) Technique (cont’d)
  • 30.
    Hence, conclude thatthere is a 93% probability that the project will be completed in 20 days or less Technique (cont’d)
  • 31.
    Summary: The Roleof PERT PERT does not reduce project duration However, it does the following: 1. Given a network with estimates a, m, and b as well as a value for project duration, it provides a probability figure for finishing on time