Downloaded 865 times

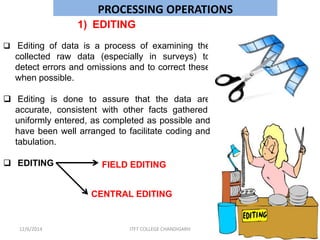
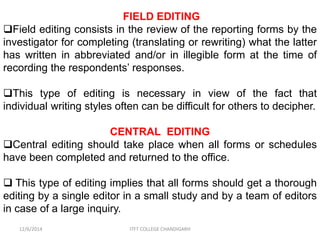
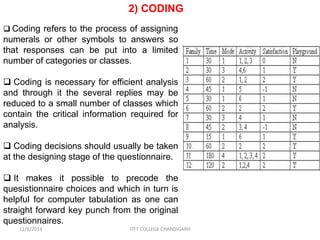
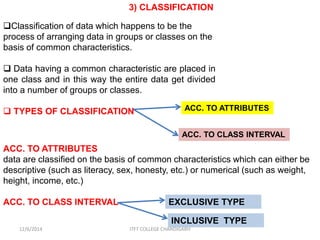
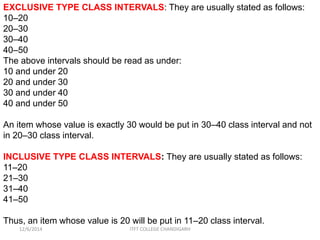
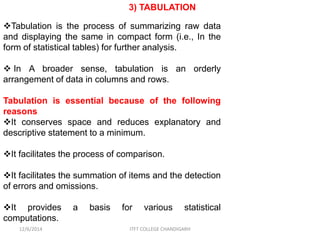
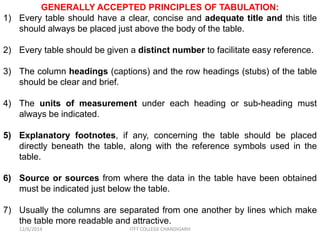
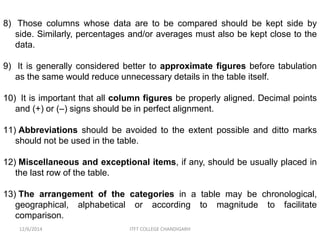


The document discusses various data processing and analysis techniques including: 1. Editing of raw data to detect and correct errors through field editing by investigators and central editing by a team. 2. Coding of responses by assigning numerals or symbols to classify answers into categories for analysis. 3. Classification of data by grouping into classes based on common attributes or class intervals. 4. Tabulation by summarizing data into statistical tables for further analysis according to accepted principles.