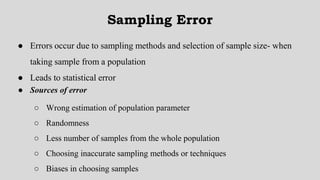
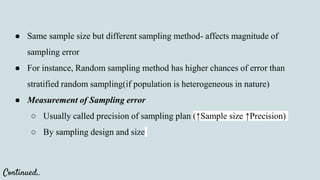
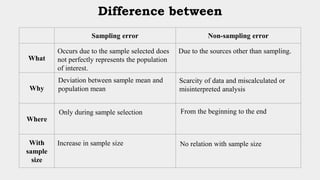
01 parametric and non parametric statisticsVasant Kothari
Definition of Parametric and Non-parametric Statistics
Assumptions of Parametric and Non-parametric Statistics
Assumptions of Parametric Statistics
Assumptions of Non-parametric Statistics
Advantages of Non-parametric Statistics
Disadvantages of Non-parametric Statistical Tests
Parametric Statistical Tests for Different Samples
Parametric Statistical Measures for Calculating the Difference Between Means
Significance of Difference Between the Means of Two Independent Large and
Small Samples
Significance of the Difference Between the Means of Two Dependent Samples
Significance of the Difference Between the Means of Three or More Samples
Parametric Statistics Measures Related to Pearson’s ‘r’
Non-parametric Tests Used for Inference
Research methodology - Analysis of DataThe Stockker
Processing & Analysis of Data, Data editing, Benefits of data editing, Data coding, Classification of data, CLASSIFICATION ACCORDING THE ATTRIBUTES, CLASSIFICATION ON THE BASIS OF INTERVAL, TABULATION of data, Types of tables, Graphing of data, Bar chart, Pie chart, Line graph, histogram, Polygon / ogive, Analysis of Data, Descriptive Analysis, Uni-Variate Analysis, Bivariate Analysis, Multi-Variate Analysis, Causal Analysis, Inferential Analysis, PARAMETRIC TESTS, Non parametric Test,
RESEARCH DESIGN , Sampling Designs , Dependent and Independent Variables, Extraneous Variables, Hypothesis, Exploratory Research Design, Descriptive and Diagnostic Research
In many different types of researches we are interested in learning about large groups of people who all have something in common that is called 'target population' Researchers commonly study traits or characteristics (parameters) of populations in their studies. It is more or less impossible to study the whole population therefore researches need to select a sample or sub-group of the population that is likely to be representative of the target population. Therefore, the researcher would select individuals from which to collect the data which is called sample. Sampling is the method of selecting individuals from the population. The method of sampling is a key factor for generalizing the results of sample into a population. There are two main methods of sampling including probable and non-probable sampling techniques. In probable sampling method the sample, should be as representative as possible of the population which leads to more confident to generalize the results to the target population.
Another important question that must be answered in all sample surveys is "How many participants should be chosen for a survey"? An under-sized study can be a waste of resources since it may not produce useful results while an over-sized study uses more resources than necessary. Determining the sample size should be based on type of research and its objectives as well as required statistical methods. There are different methods for determining the sample size applying various formulas to calculate a sample size.
The contents of this presentation includes the introduction, steps involved in a survey, pros and cons as well as the sources of error. The contents are designed to support the researchers and students in their basics.
Methods of Data Collection in Quantitative Research (Biostatistik)AKak Long
DEFINITION : Quantitative research, is defined as a the systematic investigation of phenomena by gathering quantifiable data and performing statistical, mathematical or computational techniques.
Quantitative research gathers information from existing and potential customers using sampling methods and sending out online surveys, online polls, questionnaires etc., the results of which can be depicted in the form of numericals.
After careful understanding of these numbers to predict the future of a product or service and make changes accordingly.
Described as the process of gathering and measuring information on variables of interest, in an established systematic fashion that enables one to answer research questions, test hypothesis and evaluate outcome.
Importance of data collection:
Helps us search for answers and resolutions
Facilitates and improve decision-making processes and the quality of the decisions made.
#Types of quantitative research.
. Survey research
The collection of data attained by asking individuals questions by either in person, on paper, by phone or online.
2. Correlational research
Measures two variables, understand assess the statistical relationship between them with no influence from any extraneous variable.
3. Casual-comparative research
To find relationship between independent and dependent variables after an action or event has already occurred.
4. Experimental research
Researcher manipulates one variables, and control/randomizes the rest of the variables.
Explore our comprehensive data analysis project presentation on predicting product ad campaign performance. Learn how data-driven insights can optimize your marketing strategies and enhance campaign effectiveness. Perfect for professionals and students looking to understand the power of data analysis in advertising. for more details visit: https://bostoninstituteofanalytics.org/data-science-and-artificial-intelligence/
Adjusting primitives for graph : SHORT REPORT / NOTESSubhajit Sahu
Graph algorithms, like PageRank Compressed Sparse Row (CSR) is an adjacency-list based graph representation that is
Multiply with different modes (map)
1. Performance of sequential execution based vs OpenMP based vector multiply.
2. Comparing various launch configs for CUDA based vector multiply.
Sum with different storage types (reduce)
1. Performance of vector element sum using float vs bfloat16 as the storage type.
Sum with different modes (reduce)
1. Performance of sequential execution based vs OpenMP based vector element sum.
2. Performance of memcpy vs in-place based CUDA based vector element sum.
3. Comparing various launch configs for CUDA based vector element sum (memcpy).
4. Comparing various launch configs for CUDA based vector element sum (in-place).
Sum with in-place strategies of CUDA mode (reduce)
1. Comparing various launch configs for CUDA based vector element sum (in-place).
As Europe's leading economic powerhouse and the fourth-largest hashtag#economy globally, Germany stands at the forefront of innovation and industrial might. Renowned for its precision engineering and high-tech sectors, Germany's economic structure is heavily supported by a robust service industry, accounting for approximately 68% of its GDP. This economic clout and strategic geopolitical stance position Germany as a focal point in the global cyber threat landscape.
In the face of escalating global tensions, particularly those emanating from geopolitical disputes with nations like hashtag#Russia and hashtag#China, hashtag#Germany has witnessed a significant uptick in targeted cyber operations. Our analysis indicates a marked increase in hashtag#cyberattack sophistication aimed at critical infrastructure and key industrial sectors. These attacks range from ransomware campaigns to hashtag#AdvancedPersistentThreats (hashtag#APTs), threatening national security and business integrity.
🔑 Key findings include:
🔍 Increased frequency and complexity of cyber threats.
🔍 Escalation of state-sponsored and criminally motivated cyber operations.
🔍 Active dark web exchanges of malicious tools and tactics.
Our comprehensive report delves into these challenges, using a blend of open-source and proprietary data collection techniques. By monitoring activity on critical networks and analyzing attack patterns, our team provides a detailed overview of the threats facing German entities.
This report aims to equip stakeholders across public and private sectors with the knowledge to enhance their defensive strategies, reduce exposure to cyber risks, and reinforce Germany's resilience against cyber threats.
1. Errors:
In sampling and research design
Chetna, PhD (First year) 2022
R.no. 722403
Adm. No. PH000104
Department of Food Science and Technology
Course: BAS 751
3. Errors in research?!
● Beginning of research - broad to specific
● Setting in objectives
● Planning a research design
● Sampling methods & selection
● Data collection-Data entry-Data analysis
● Result interpretation
● Report writing
4. Sampling Error
● Errors occur due to sampling methods and selection of sample size- when
taking sample from a population
● Leads to statistical error
● Sources of error
○ Wrong estimation of population parameter
○ Randomness
○ Less number of samples from the whole population
○ Choosing inaccurate sampling methods or techniques
○ Biases in choosing samples
5. Continued..
● Same sample size but different sampling method- affects magnitude of
sampling error
● For instance, Random sampling method has higher chances of error than
stratified random sampling(if population is heterogeneous in nature)
● Measurement of Sampling error
○ Usually called precision of sampling plan (↑Sample size ↑Precision)
○ By sampling design and size
6. Continued..
● How to limit Sampling errors (not possible to control 100% error)
○ True representation of population
○ Population specification
○ Sampling design
○ Sample accuracy- Homogeneity
○ Sampling method
○ Sample selection
○ Increase sample size
7. ● Larger the sample— higher the
accuracy in research
● Increases the sample size,
decreases the sampling error
❖ Limitations in increasing sample size
➢ Cost ↑ & Time ↑
➢ Systematic bias ↑
➢ Wastage of sample
Figure 1: Graphical representation of relationship
between sample size and sample design
Continued..
8. Non- Sampling Error
● Errors occurring due to other sources than sampling.
● Error arises at any stage of conducting a research such as planning, collecting
data, data entry, data coding, tabulation, data analysis, also during report
writing.
● Sources of non-sampling error
○ Not attentive towards work
○ Lack of knowledge
○ Bias in data analysis
9. ● When can non-sampling error occur?
○ Lack of proper specification of the domain of study and scope of the
investigation,
○ Incomplete coverage of the population or sample,
○ Faulty definitions and objective setting,
○ Inappropriate sampling frame,
○ defective methods of data collection,
○ Error in instrument- Measurement error,
○ Data processing- collection, entering, coding, tabulation, analysis etc.
Continued..
10. ● How to limit non-sampling error?
○ Specification of area of research and defined objectives
○ Appropriate research design
○ Appropriate sampling frame
○ Complete data collection
○ Minimizing errors in instruments
○ Use of suitable data collection methods
○ Avoid short timing for data collection
○ Cautious to data processing
○ Pre-testing or Pilot study Continued..
11. Types of non-sampling error
● Respondent error
○ Inability or unwillingness of respondent creates error.
○ Also named as, non-response error
○ To reduce errors associated with respondents: Rechecking, Re-contact,
willingness, to know the ability of respondent, etc.
● Measurement Errors
○ Errors in instruments, e.g., Spectrophotometer, Weighing scale, Computer
reading to wrong entry etc.
○ Take measurements or reading consciously and observe the data before analysis
12. ● Tabulation errors
○ At tabulation stage, when data is entered before analysing
○ Reasons: Insufficient data, errors in data processing, errors in graphical
representation etc.
○ To minimize the errors, data accuracy and data sufficiency is crucial.
● Specification errors: Errors at planning stage, due to inadequate and inconsistent
specification of data, w.r.t. Objectives of research, faults in data tool handling, etc.
○ To reduce this error: set specific objectives, Adequacy and consistency in data,
selection of appropriate data collection tool, etc.
13. ● Ascertainment errors: errors may occur at field stage, when researchers goes for data
collection, either in community or in laboratory.
○ Not trained or experienced investigations, recall errors, lack of adequate
inspection and lack of supervision of primary staff etc.
○ Further divided into 2 sub-categories:
■ Coverage errors: from duplication or omissions of data or non-response
■ Content errors : wrong entries by researcher
○ To limit errors at this stage:
■ Trained and experienced investigators is required
■ Avoid data manipulation
■ Monitoring and evaluation can reduce ascertainment error
14. Difference between
Sampling error Non-sampling error
What
Why
Where
With
sample
size
Occurs due to the sample selected does
not perfectly represents the population
of interest.
Due to the sources other than sampling.
Deviation between sample mean and
population mean
Scarcity of data and miscalculated or
misinterpreted analysis
Only during sample selection From the beginning to the end
Increase in sample size No relation with sample size
15. ¿¿….Questions….??
Q1. _____ occurs when the sample used in the study is not representative of the
whole population.
a.Sampling error b.Margin of error
c.Population specification d. Non-sampling error
Q2. Which of these is NOT a technique to minimize sampling error?
a. Increase the sample size
b. Divide the population into groups
c. Know your population
d. Train your team Technique to reduce non-sampling error
16. Q3. Name non-sampling error and its control.
Q4. Name the non-sampling errors:
a. When respondent is fail to response-
b. Colorimeter may show-
c. Insufficiency of data may create-
d. Using wrong verbs, punctuation marks, etc-
Q5. Is sampling error the same as standard error?
Non-response error
Measurement error
Tabulation error
Grammatical error
17. References
● Kothari, C. R., & Garg, G. (2008, December 11). Research Methodology : Methods And Techniques (Multi Colour
Edition) (4th ed.). New Age International Publishers.
● https://www.youtube.com/watch?v=AJdt2_qxulo
● https://www.youtube.com/watch?v=v61kKi_gwMA
● http://home.iitk.ac.in/~shalab/sampling/chapter13-sampling-non-sampling-errors.pdf
● https://egyankosh.ac.in/bitstream/123456789/12260/1/Unit-4.pdf
● Khadka, J. (2019, January). Sampling Error in Survey Research. International Journal of Science and Research (IJSR),
8(1). https://doi.org/10.21275/SUB157990