SlideShare a Scribd company logo
1 of 37
Page 1 of 37
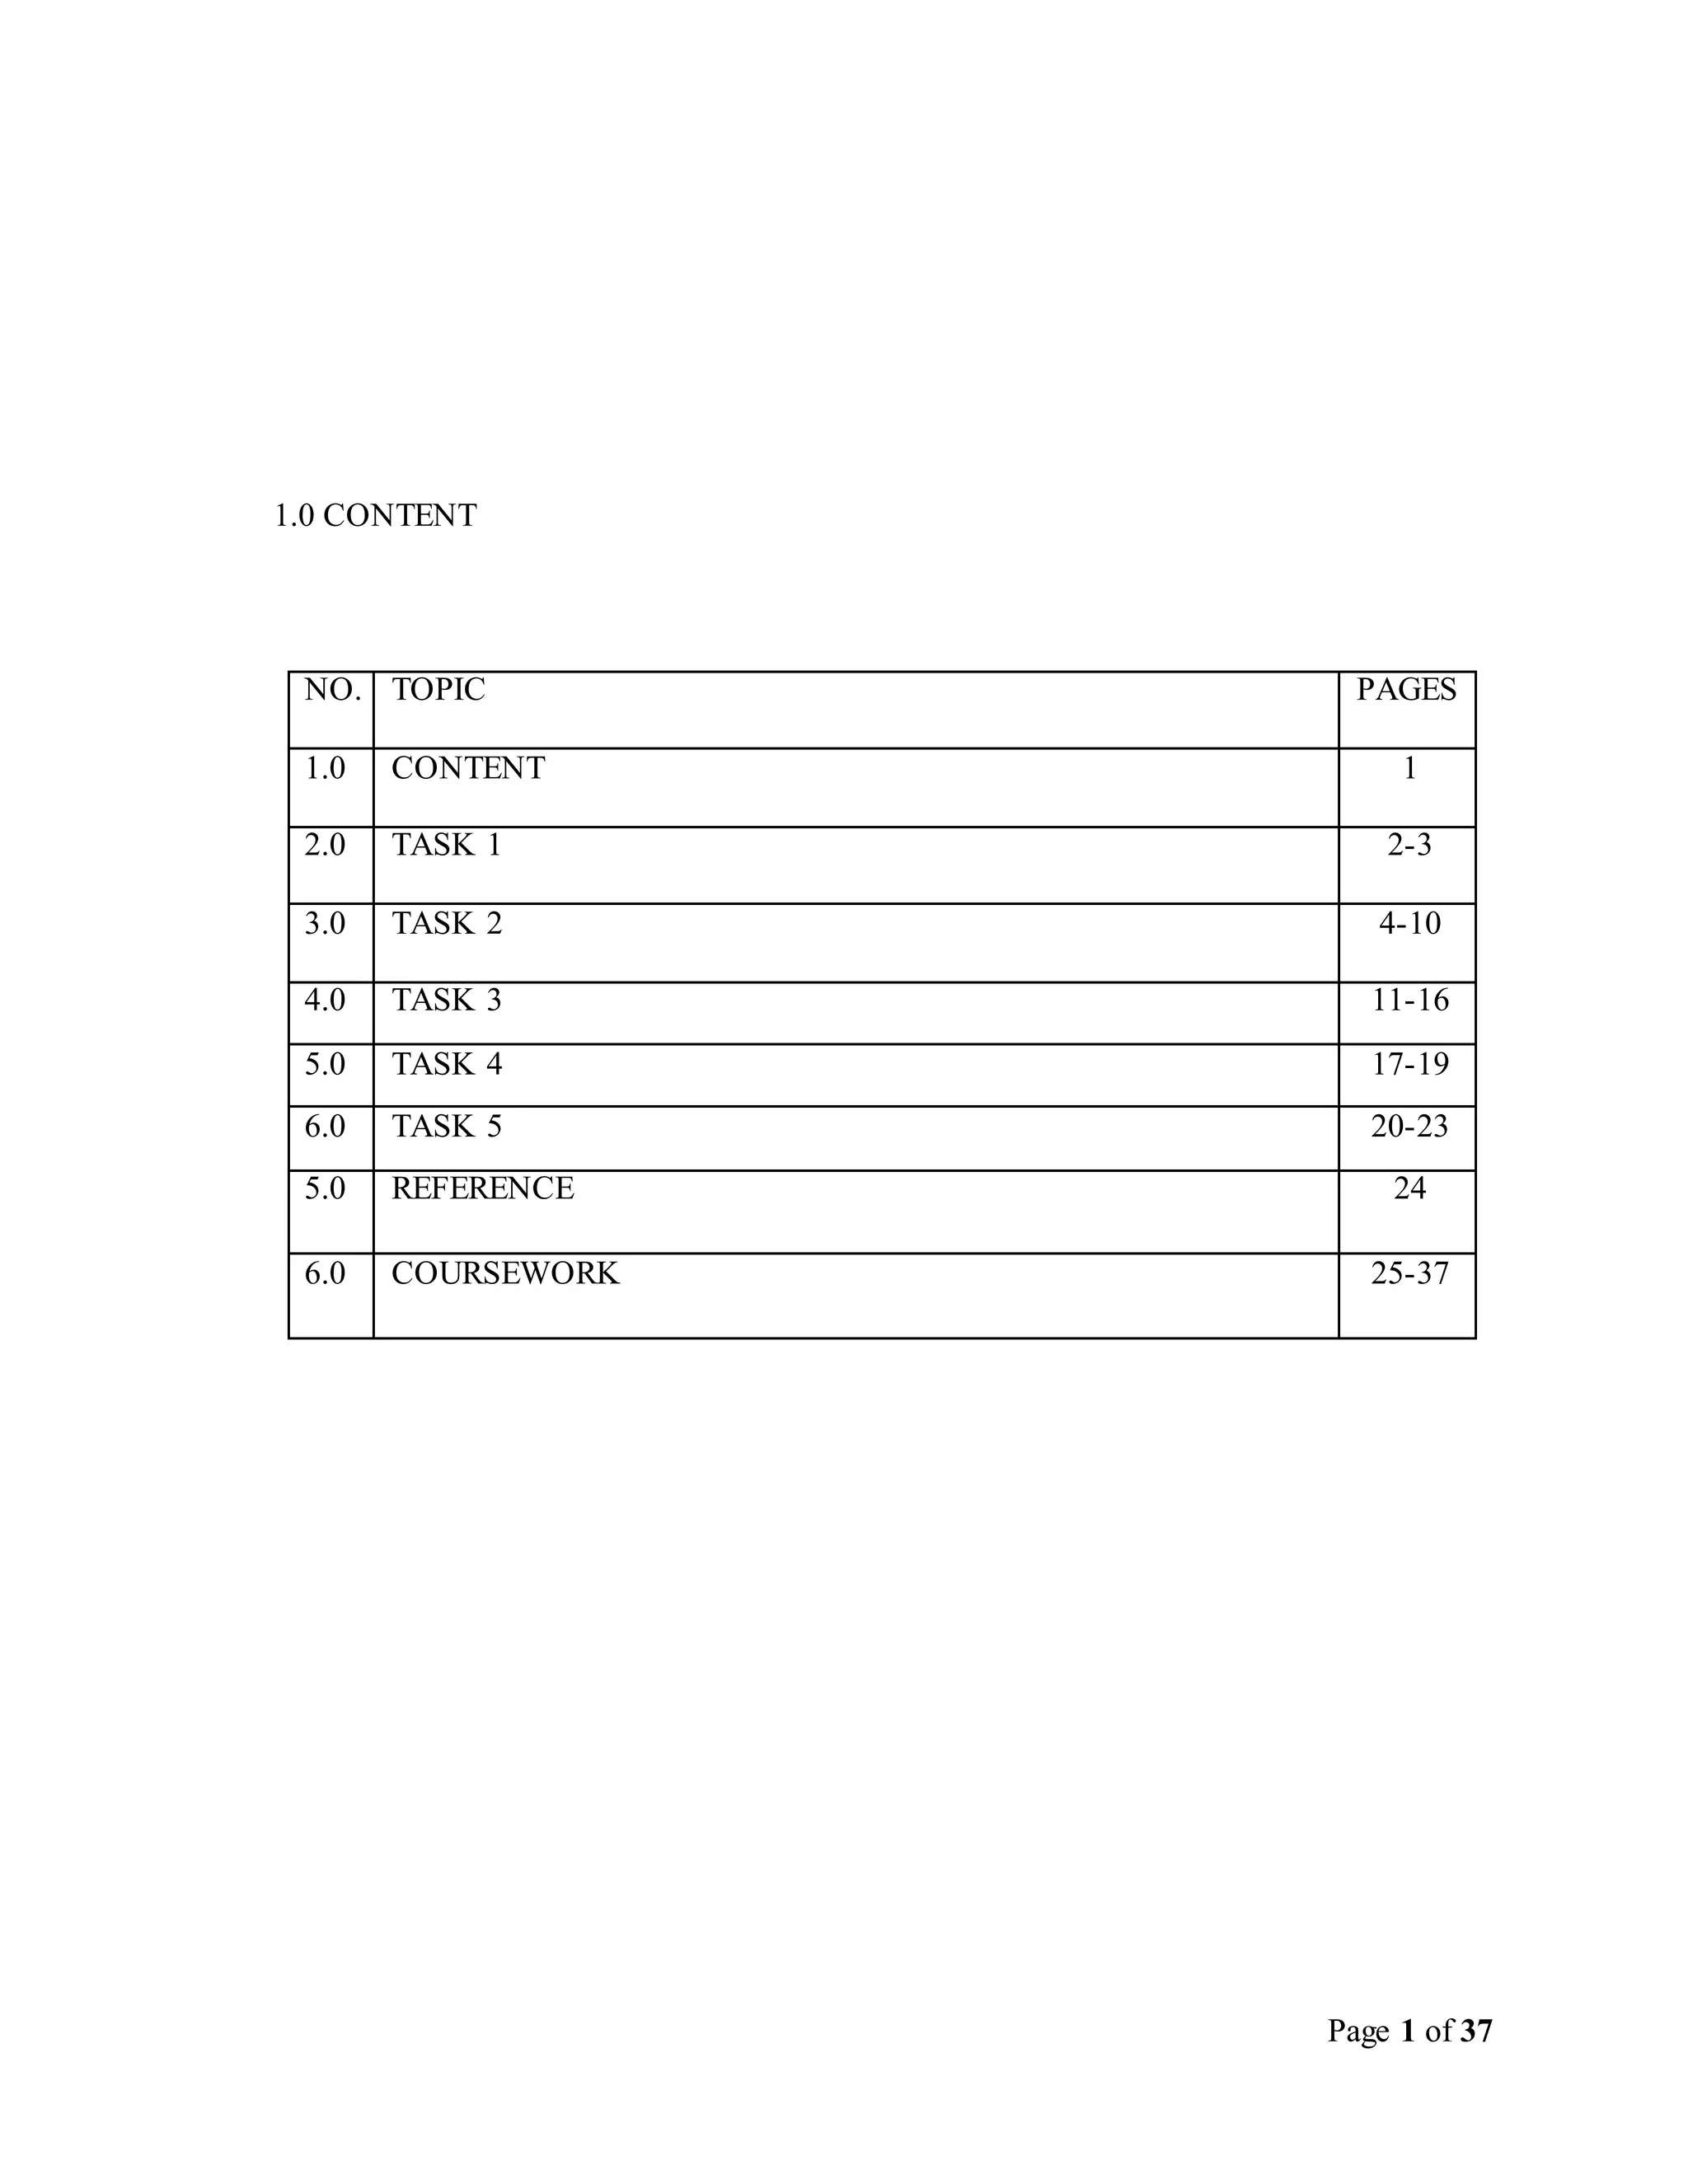
1.0 CONTENT
NO. TOPIC PAGES
1.0 CONTENT 1
2.0 TASK 1 2-3
3.0 TASK 2 4-10
4.0 TASK 3 11-16
5.0 TASK 4 17-19
6.0 TASK 5 20-23
5.0 REFERENCE 24
6.0 COURSEWORK 25-37
Page 2 of 37
1.0 INTRODUCTION
Statistics is the study of the collection, analysis, interpretation, presentation, and
organization of data. In applying statistics to, e.g., a scientific, industrial, or social
problem, it is conservative to create with a statistical population or a statistical model
process to be studied. Populations can be different topics such as "all people living in a
country" or "every atom composing a crystal". Statistics deals with all aspects of data
including the planning of data collection in terms of the design of surveys and
experiments.
Some popular definitions are:
Merriam-Webster dictionary defines statistics as "classified facts representing the
conditions of a people in a state – especially the facts that can be stated in numbers or
any other tabular or classified arrangement[2]".
Statistician Sir Arthur Lyon Bowley defines statistics as "Numerical statements of facts
in any department of inquiry placed in relation to each other".
Page 3 of 37
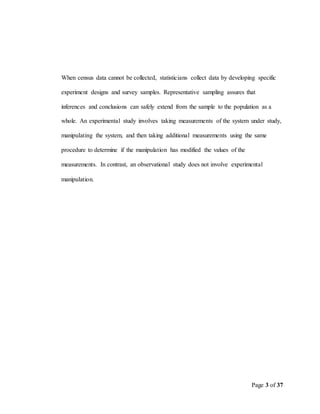
When census data cannot be collected, statisticians collect data by developing specific
experiment designs and survey samples. Representative sampling assures that
inferences and conclusions can safely extend from the sample to the population as a
whole. An experimental study involves taking measurements of the system under study,
manipulating the system, and then taking additional measurements using the same
procedure to determine if the manipulation has modified the values of the
measurements. In contrast, an observational study does not involve experimental
manipulation.
Page 4 of 37
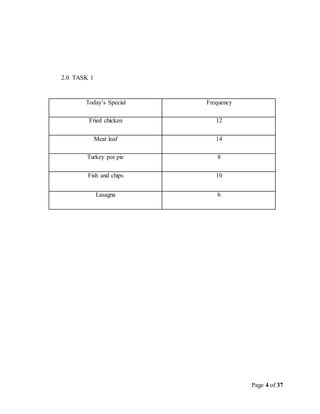
2.0 TASK 1
Today’s Special Frequency
Fried chicken 12
Meat loaf 14
Turkey pot pie 8
Fish and chips 10
Lasagna 6
Page 5 of 37
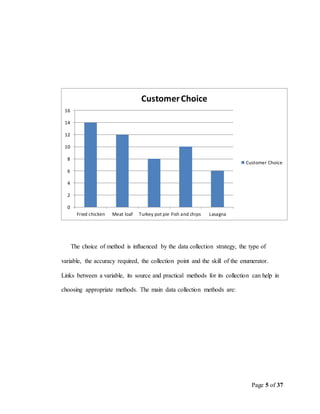
The choice of method is influenced by the data collection strategy, the type of
variable, the accuracy required, the collection point and the skill of the enumerator.
Links between a variable, its source and practical methods for its collection can help in
choosing appropriate methods. The main data collection methods are:
0
2
4
6
8
10
12
14
16
Fried chicken Meat loaf Turkey pot pie Fish and chips Lasagna
CustomerChoice
Customer Choice
Page 6 of 37
· Registration: registers and licenses are principally valuable for complete
enumeration, but are limited to variables that change slowly, such as numbers of fishing
vessels and their characteristics.
· Questionnaires: forms which are completed and returned by respondents. An
inexpensive method that is useful where literacy rates are high and respondents are co-
operative.
· Interviews: forms which are completed through an interview with the respondent.
More expensive than questionnaires, but they are better for more complex questions,
low literacy or less co-operation.
· Direct observations: making direct measurements is the most accurate method for
many variables, such as catch, but is often expensive. Many methods, such as observer
programmes, are limited to industrial fisheries.
· Reporting: the main alternative to making direct measurements is to require fishers
and others to report their activities. Reporting requires literacy and co-operation, but
can be backed up by a legal requirement and direct measurements.
Page 7 of 37
When we are graphing and organizing the collected data, students' experiences in
displaying data should progress from the concrete, to the pictorial, to the abstract. When
creating bar graphs, for example, they may progress from using objects, such as blocks or
pieces of candy, to using sticky notes, to creating single-bar graphs, to using a color key to
identify different bars of a double-bar graph. From the beginning, students should learn to
label graphs with a title, the labels for each axis (x and y), the units of analysis (e.g., feet,
meters, dollars) and how to create a key. Over time, students should learn the names of the
different parts of different graphs.
Questions that can be addressed with numerical data include, "How many pets do
you have?" or "When were you born?" Line plots, bar graphs, scatterplots, and stem-and-
leaf plots are often used to represent numerical data. The most effective way to analyze
numerical data is to look at the mean, median, counts, and the shape (for example, the arc
of a bell curve or the clustering of scatter plots) of the data.
Questions about categorical data are not answered with numbers, but with words.
Generally line plots, bar graphs, and circle graphs are used to represent categorical data. An
effective way to analyze categorical data is by counts or percentages.
Page 8 of 37
Questions that can be addressed by collecting data over time (longitudinal data)
include "What is the average temperature in the month of June?" or "What was the daily
weather conditions in month of June?" Descriptions of the various graphs students will
learn to make as they progress from the primary to the middle grades are listed below, with
examples:
 Bar Graph: Used when comparing various items or ideas.
 Histogram: Used to show frequency and compare items or ideas; each bar
represents an interval of values.
 Line Graph: Used to show change over time.
 Pictograph: Used to show frequency and compare items or ideas.
 Circle Graph (or Pie Graph): Used to show parts or percentages of a whole.
Page 9 of 37
 Box-and-Whisker Plot: Used to show the range of values as well as the
median, quartiles, and outliers; five-number summary is another name for
this representation.
 Line Plot: Used to easily organize one group of data.
 Scatterplot (or Scattergram): Used to determine if a correlation exists
between two data sets, and how strong it is, also used to calculate line or
curve of best fit.
 Stem-and-Leaf Plot: Used to show frequency; data is grouped according to
place value, using the digit in the greatest place.
It is valuable for students to explore various ways to represent the same data.
Students can determine which graph makes the most sense to use and which graph can help
them answer their questions most easily. For example, a favorite book survey can be shown
as a table, a bar graph, a circle graph and a picture graph. Students can discuss which
Page 10 of 37
representation most clearly shows which book got the most votes or the difference in votes.
Students can remove the least favorite book and vote again to explore the change in data.
It is also valuable for students to understand that the same data is not always best
represented in different ways. For example, line plots, bar graphs, scatterplots, and stem-
and-leaf plots are best used to represent numerical data. However, longitudinal data are best
represented by line graphs. Categorical data are not displayed in a specific order and most
often are represented by line plots, bar graphs, and circle graphs.
Page 11 of 37
3.0 TASK 2
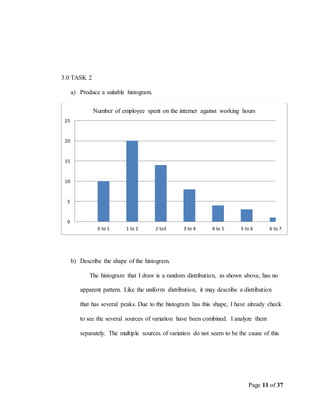
a) Produce a suitable histogram.
b) Describe the shape of the histogram.
The histogram that I draw is a random distribution, as shown above, has no
apparent pattern. Like the uniform distribution, it may describe a distribution
that has several peaks. Due to the histogram has this shape, I have already check
to see the several sources of variation have been combined. I analyze them
separately. The multiple sources of variation do not seem to be the cause of this
0
5
10
15
20
25
0 to 1 1 to 2 2 to3 3 to 4 4 to 5 5 to 6 6 to 7
Number of employee spent on the internet against working hours
Page 12 of 37
pattern, different groupings can be tried to see if a more useful pattern results.
This could be as simple as changing the starting and ending points of the cells,
or changing the number of cells. A random distribution often means there are
too many classes.
c) The graph tells me that most of the employees seldom spent on the internet
during the working hours. The mode of the graph is (1-2) hours. The median
class of the graph is (1-2) hours. The median of the graph is 3 hours. The mean
of the is calculated, which is 2.25.
Page 13 of 37
4.0 TASK 3
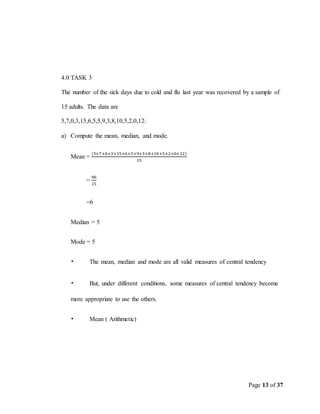
The number of the sick days due to cold and flu last year was recovered by a sample of
15 adults. The data are
5,7,0,3,15,6,5,5,9,3,8,10,5,2,0,12:
a) Compute the mean, median, and mode.
Mean =
(5+7+0+3+15+6+5+9+3+8+10+5+2+0+12)
15
=
90
15
=6
Median = 5
Mode = 5
• The mean, median and mode are all valid measures of central tendency
• But, under different conditions, some measures of central tendency become
more appropriate to use the others.
• Mean ( Arithmetic)
Page 14 of 37
The mean (or average) is the most popular and well known measure of central
tendency.It can be used with both discrete and continuous data, although its use is most
often with continuous data.The mean is equal to the sum of all the values in the data set
divided by the number of values in the data set.
• Median
The median is the middle score for a set of data that has been arranged in
order of magnitude.The median is less affected by outliers and skewed data.
• Mode
The mode is the most frequent score in our data set.On a histogram it
represents the higher bar in a bar chart or histogram. Sometimes consider the mode
as being the most popular option
b) Mean, median and mode are used to calculating central tendencies of any
data/distribution. These numbers quickly summarize the data. So they are also
called the estimates.
Page 15 of 37
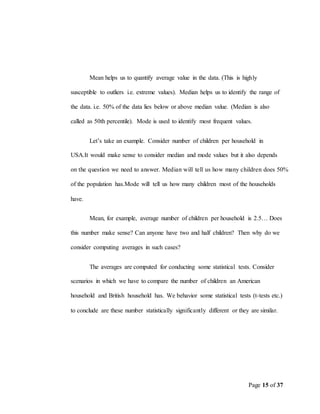
Mean helps us to quantify average value in the data. (This is highly
susceptible to outliers i.e. extreme values). Median helps us to identify the range of
the data. i.e. 50% of the data lies below or above median value. (Median is also
called as 50th percentile). Mode is used to identify most frequent values.
Let’s take an example. Consider number of children per household in
USA.It would make sense to consider median and mode values but it also depends
on the question we need to answer. Median will tell us how many children does 50%
of the population has.Mode will tell us how many children most of the households
have.
Mean, for example, average number of children per household is 2.5… Does
this number make sense? Can anyone have two and half children? Then why do we
consider computing averages in such cases?
The averages are computed for conducting some statistical tests. Consider
scenarios in which we have to compare the number of children an American
household and British household has. We behavior some statistical tests (t-tests etc.)
to conclude are these number statistically significantly different or they are similar.
Page 16 of 37
So Median, Mode and mean has its own advantages and limitations. We must
choose proper estimates to answer real world questions.
Page 17 of 37
5.0 TASK 4
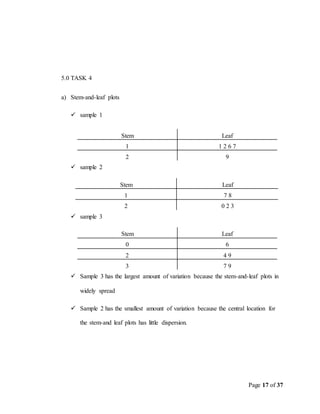
a) Stem-and-leaf plots
 sample 1
Stem Leaf
1 1 2 6 7
2 9
 sample 2
Stem Leaf
1 7 8
2 0 2 3
 sample 3
Stem Leaf
0 6
2 4 9
3 7 9
 Sample 3 has the largest amount of variation because the stem-and-leaf plots in
widely spread
 Sample 2 has the smallest amount of variation because the central location for
the stem-and leaf plots has little dispersion.
Page 18 of 37
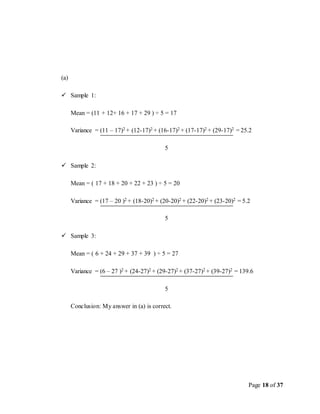
(a)
 Sample 1:
Mean = (11 + 12+ 16 + 17 + 29 ) ÷ 5 = 17
Variance = (11 – 17)2 + (12-17)2 + (16-17)2 + (17-17)2 + (29-17)2 = 25.2
5
 Sample 2:
Mean = ( 17 + 18 + 20 + 22 + 23 ) ÷ 5 = 20
Variance = (17 – 20 )2 + (18-20)2 + (20-20)2 + (22-20)2 + (23-20)2 = 5.2
5
 Sample 3:
Mean = ( 6 + 24 + 29 + 37 + 39 ) ÷ 5 = 27
Variance = (6 – 27 )2 + (24-27)2 + (29-27)2 + (37-27)2 + (39-27)2 = 139.6
5
Conclusion: My answer in (a) is correct.
Page 19 of 37
6.0 TASK 5
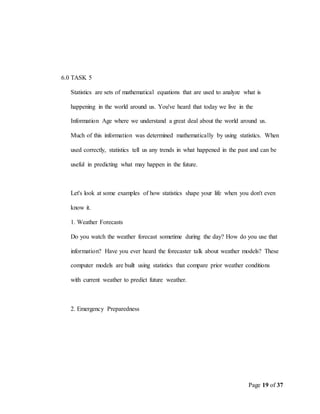
Statistics are sets of mathematical equations that are used to analyze what is
happening in the world around us. You've heard that today we live in the
Information Age where we understand a great deal about the world around us.
Much of this information was determined mathematically by using statistics. When
used correctly, statistics tell us any trends in what happened in the past and can be
useful in predicting what may happen in the future.
Let's look at some examples of how statistics shape your life when you don't even
know it.
1. Weather Forecasts
Do you watch the weather forecast sometime during the day? How do you use that
information? Have you ever heard the forecaster talk about weather models? These
computer models are built using statistics that compare prior weather conditions
with current weather to predict future weather.
2. Emergency Preparedness
Page 20 of 37
What happens if the forecast indicates that a hurricane is imminent or that tornadoes
are likely to occur? Emergency management agencies move into high gear to be
ready to rescue people. Emergency teams rely on statistics to tell them when danger
may occur.
3. Predicting Disease
Lots of times on the news reports, statistics about a disease are reported. If the
reporter simply reports the number of people who either have the disease or who
have died from it, it's an interesting fact but it might not mean much to your life.
But when statistics become involved, you have a better idea of how that disease
may affect you.
For example, studies have shown that 85 to 95 percent of lung cancers are smoking
related. The statistic should tell you that almost all lung cancers are related to
smoking and that if you want to have a good chance of avoiding lung cancer, you
shouldn't smoke.
4. Medical Studies
Page 21 of 37
Scientists must show a statistically valid rate of effectiveness before any drug can
be prescribed. Statistics are behind every medical study you hear about.
5. Genetics
Many people are afflicted with diseases that come from their genetic make-up and
these diseases can potentially be passed on to their children. Statistics are critical in
determining the chances of a new baby being affected by the disease.
6. Political Campaigns
Whenever there's an election, the news organizations consult their models when
they try to predict who the winner is. Candidates consult voter polls to determine
where and how they campaign. Statistics play a part in who your elected
government officials will be
7. Insurance
You know that in order to drive your car you are required by law to have car
insurance. If you have a mortgage on your house, you must have it insured as well.
The rate that an insurance company charges you is based upon statistics from all
drivers or homeowners in your area.
Page 22 of 37
8. Consumer Goods
Wal-Mart, a worldwide leading retailer, keeps track of everything they sell and use
statistics to calculate what to ship to each store and when. From analyzing their vast
store of information, for example, Wal-Mart decided that people buy strawberry
Pop Tarts when a hurricane is predicted in Florida! So they ship this product to
Florida stores based upon the weather forecast.
9. Quality Testing
Companies make thousands of products every day and each company must make
sure that a good quality item is sold. But a company can't test each and every item
that they ship to you, the consumer. So the company uses statistics to test just a few,
called a sample, of what they make. If the sample passes quality tests, then the
company assumes that all the items made in the group, called a batch, are good.
10. Stock Market
Page 23 of 37
Another topic that you hear a lot about in the news is the stock market. Stock
analysts also use statistical computer models to forecast what is happening in the
economy.
Page 24 of 37
7.0 REFERENCE
1. Textbook BBA 2001
2. https://www.quora.com/What-are-the-advantages-of-mean-median-and-mode
3. http://www.pqsystems.com/qualityadvisor/DataAnalysisTools/interpretation/histogram
_shape.php
4. http://www.mathworksheetscenter.com/mathtips/statsareimportant.html
5. https://en.wikipedia.org/wiki/Statistics
6. http://www.learnnc.org/lp/pages/3188
7. http://info.dogpile.com/dogpl.305.10/search/web?q=use+of+statistics+in+daily+life&a
d.network=g&ad.keyword=use%20of%20statistics%20in%20daily%20life&ad.creative
=83492475543&ad.position=1o1&ad.placement=&ad.matchtype=b&ad.aceid=&ad.ism
obile=&ad.device=c&ad.devicemodel=&ad.adgroupid=18778071183&cid=278051703
&ad.segment=dogpl.305.10
Page 25 of 37
8.0 Coursework
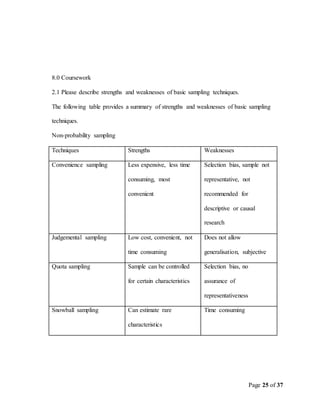
2.1 Please describe strengths and weaknesses of basic sampling techniques.
The following table provides a summary of strengths and weaknesses of basic sampling
techniques.
Non-probability sampling
Techniques Strengths Weaknesses
Convenience sampling Less expensive, less time
consuming, most
convenient
Selection bias, sample not
representative, not
recommended for
descriptive or causal
research
Judgemental sampling Low cost, convenient, not
time consuming
Does not allow
generalisation, subjective
Quota sampling Sample can be controlled
for certain characteristics
Selection bias, no
assurance of
representativeness
Snowball sampling Can estimate rare
characteristics
Time consuming
Page 26 of 37
Page 27 of 37
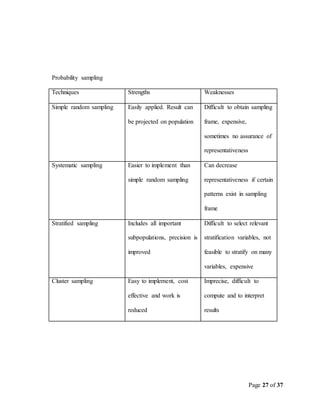
Probability sampling
Techniques Strengths Weaknesses
Simple random sampling Easily applied. Result can
be projected on population
Difficult to obtain sampling
frame, expensive,
sometimes no assurance of
representativeness
Systematic sampling Easier to implement than
simple random sampling
Can decrease
representativeness if certain
patterns exist in sampling
frame
Stratified sampling Includes all important
subpopulations, precision is
improved
Difficult to select relevant
stratification variables, not
feasible to stratify on many
variables, expensive
Cluster sampling Easy to implement, cost
effective and work is
reduced
Imprecise, difficult to
compute and to interpret
results
Page 28 of 37
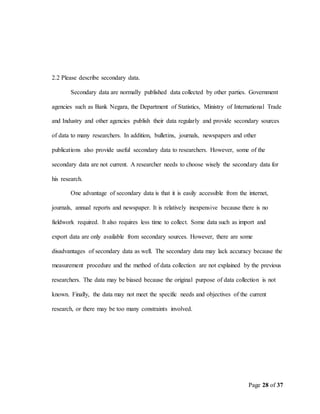
2.2 Please describe secondary data.
Secondary data are normally published data collected by other parties. Government
agencies such as Bank Negara, the Department of Statistics, Ministry of International Trade
and Industry and other agencies publish their data regularly and provide secondary sources
of data to many researchers. In addition, bulletins, journals, newspapers and other
publications also provide useful secondary data to researchers. However, some of the
secondary data are not current. A researcher needs to choose wisely the secondary data for
his research.
One advantage of secondary data is that it is easily accessible from the internet,
journals, annual reports and newspaper. It is relatively inexpensive because there is no
fieldwork required. It also requires less time to collect. Some data such as import and
export data are only available from secondary sources. However, there are some
disadvantages of secondary data as well. The secondary data may lack accuracy because the
measurement procedure and the method of data collection are not explained by the previous
researchers. The data may be biased because the original purpose of data collection is not
known. Finally, the data may not meet the specific needs and objectives of the current
research, or there may be too many constraints involved.
Page 29 of 37
Page 30 of 37
Page 31 of 37
Page 32 of 37
Page 33 of 37
7.0 TASK 5.0
There are 10 everyday reasons why statistics are important. Statistics are sets of
mathematical equations that are used to analyze what is happening in the world around us.
Page 34 of 37
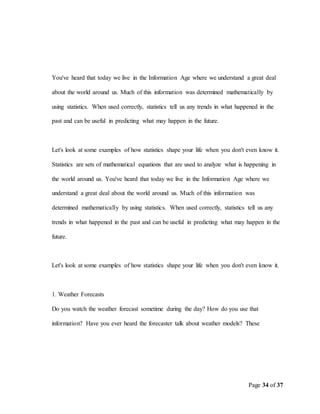
You've heard that today we live in the Information Age where we understand a great deal
about the world around us. Much of this information was determined mathematically by
using statistics. When used correctly, statistics tell us any trends in what happened in the
past and can be useful in predicting what may happen in the future.
Let's look at some examples of how statistics shape your life when you don't even know it.
Statistics are sets of mathematical equations that are used to analyze what is happening in
the world around us. You've heard that today we live in the Information Age where we
understand a great deal about the world around us. Much of this information was
determined mathematically by using statistics. When used correctly, statistics tell us any
trends in what happened in the past and can be useful in predicting what may happen in the
future.
Let's look at some examples of how statistics shape your life when you don't even know it.
1. Weather Forecasts
Do you watch the weather forecast sometime during the day? How do you use that
information? Have you ever heard the forecaster talk about weather models? These
Page 35 of 37
computer models are built using statistics that compare prior weather conditions with
current weather to predict future weather.
2. Emergency Preparedness
What happens if the forecast indicates that a hurricane is imminent or that tornadoes are
likely to occur? Emergency management agencies move into high gear to be ready to
rescue people. Emergency teams rely on statistics to tell them when danger may occur.
3. Predicting Disease
Lots of times on the news reports, statistics about a disease are reported. If the reporter
simply reports the number of people who either have the disease or who have died from it,
it's an interesting fact but it might not mean much to your life. But when statistics become
involved, you have a better idea of how that disease may affect you.
For example, studies have shown that 85 to 95 percent of lung cancers are smoking related.
The statistic should tell you that almost all lung cancers are related to smoking and that if
you want to have a good chance of avoiding lung cancer, you shouldn't smoke.
Page 36 of 37
4. Medical Studies
Scientists must show a statistically valid rate of effectiveness before any drug can be
prescribed. Statistics are behind every medical study you hear about.
5. Genetics
Many people are afflicted with diseases that come from their genetic make-up and these
diseases can potentially be passed on to their children. Statistics are critical in determining
the chances of a new baby being affected by the disease.
6. Political Campaigns
Whenever there's an election, the news organizations consult their models when they try to
predict who the winner is. Candidates consult voter polls to determine where and how they
campaign. Statistics play a part in who your elected government officials will be
7. Insurance
You know that in order to drive your car you are required by law to have car insurance. If
you have a mortgage on your house, you must have it insured as well. The rate that an
insurance company charges you is based upon statistics from all drivers or homeowners in
your area.
Page 37 of 37
8. Consumer Goods
Wal-Mart, a worldwide leading retailer, keeps track of everything they sell and use
statistics to calculate what to ship to each store and when. From analyzing their vast store
of information, for example, Wal-Mart decided that people buy strawberry Pop Tarts when
a hurricane is predicted in Florida! So they ship this product to Florida stores based upon
the weather forecast.
9. Quality Testing
Companies make thousands of products every day and each company must make sure that a
good quality item is sold. But a company can't test each and every item that they ship to
you, the consumer. So the company uses statistics to test just a few, called a sample, of
what they make. If the sample passes quality tests, then the company assumes that all the
items made in the group, called a batch, are good.
10. Stock Market
Another topic that you hear a lot about in the news is the stock market. Stock analysts also
use statistical computer models to forecast what is happening in the economy.

More Related Content

What's hot

Data collection and presentation
Data collection and presentationData collection and presentation
Data collection and presentationferdaus44
 
Data presentation and interpretation I Quantitative Research
Data presentation and interpretation I Quantitative ResearchData presentation and interpretation I Quantitative Research
Data presentation and interpretation I Quantitative ResearchJimnaira Abanto
 
Introduction to statistics...ppt rahul
Introduction to statistics...ppt rahulIntroduction to statistics...ppt rahul
Introduction to statistics...ppt rahulRahul Dhaker
 
Introduction to Statistics - Basic concepts
Introduction to Statistics - Basic conceptsIntroduction to Statistics - Basic concepts
Introduction to Statistics - Basic conceptsDocIbrahimAbdelmonaem
 
Descriptive Statistics, Numerical Description
Descriptive Statistics, Numerical DescriptionDescriptive Statistics, Numerical Description
Descriptive Statistics, Numerical Descriptiongetyourcheaton
 
Areas In Statistics
Areas In StatisticsAreas In Statistics
Areas In Statisticsguestc94d8c
 
Presentation of data
Presentation of dataPresentation of data
Presentation of dataRuby Ocenar
 
Exploratory data analysis project
Exploratory data analysis project Exploratory data analysis project
Exploratory data analysis project BabatundeSogunro
 
Graphical descriptive techniques – Nominal data Assignment Help
Graphical descriptive techniques – Nominal data Assignment HelpGraphical descriptive techniques – Nominal data Assignment Help
Graphical descriptive techniques – Nominal data Assignment HelpSample Assignment
 
Das20502 chapter 1 descriptive statistics
Das20502 chapter 1 descriptive statisticsDas20502 chapter 1 descriptive statistics
Das20502 chapter 1 descriptive statisticsRozainita Rosley
 
Graphical presentation of data
Graphical presentation of dataGraphical presentation of data
Graphical presentation of datadrasifk
 
Descriptive statistics
Descriptive statisticsDescriptive statistics
Descriptive statisticsSarfraz Ahmad
 
Numerical & graphical presentation of data
Numerical & graphical presentation of dataNumerical & graphical presentation of data
Numerical & graphical presentation of dataSarfraz Ahmad
 
3.5 Exploratory Data Analysis
3.5 Exploratory Data Analysis3.5 Exploratory Data Analysis
3.5 Exploratory Data Analysismlong24
 
Types of data and graphical representation
Types of data and graphical representationTypes of data and graphical representation
Types of data and graphical representationReena Titoria
 

What's hot (20)

Panel slides
Panel slidesPanel slides
Panel slides
 
Data collection and presentation
Data collection and presentationData collection and presentation
Data collection and presentation
 
Basic concepts of statistics
Basic concepts of statistics Basic concepts of statistics
Basic concepts of statistics
 
Data presentation and interpretation I Quantitative Research
Data presentation and interpretation I Quantitative ResearchData presentation and interpretation I Quantitative Research
Data presentation and interpretation I Quantitative Research
 
Introduction to statistics...ppt rahul
Introduction to statistics...ppt rahulIntroduction to statistics...ppt rahul
Introduction to statistics...ppt rahul
 
Introduction to Statistics - Basic concepts
Introduction to Statistics - Basic conceptsIntroduction to Statistics - Basic concepts
Introduction to Statistics - Basic concepts
 
Descriptive Statistics, Numerical Description
Descriptive Statistics, Numerical DescriptionDescriptive Statistics, Numerical Description
Descriptive Statistics, Numerical Description
 
Areas In Statistics
Areas In StatisticsAreas In Statistics
Areas In Statistics
 
Presentation of data
Presentation of dataPresentation of data
Presentation of data
 
Exploratory data analysis project
Exploratory data analysis project Exploratory data analysis project
Exploratory data analysis project
 
Graphical descriptive techniques – Nominal data Assignment Help
Graphical descriptive techniques – Nominal data Assignment HelpGraphical descriptive techniques – Nominal data Assignment Help
Graphical descriptive techniques – Nominal data Assignment Help
 
Das20502 chapter 1 descriptive statistics
Das20502 chapter 1 descriptive statisticsDas20502 chapter 1 descriptive statistics
Das20502 chapter 1 descriptive statistics
 
Graphical presentation of data
Graphical presentation of dataGraphical presentation of data
Graphical presentation of data
 
Chapter 1: Statistics
Chapter 1: StatisticsChapter 1: Statistics
Chapter 1: Statistics
 
Descriptive statistics
Descriptive statisticsDescriptive statistics
Descriptive statistics
 
Numerical & graphical presentation of data
Numerical & graphical presentation of dataNumerical & graphical presentation of data
Numerical & graphical presentation of data
 
3.5 Exploratory Data Analysis
3.5 Exploratory Data Analysis3.5 Exploratory Data Analysis
3.5 Exploratory Data Analysis
 
analysis and presentation of data
analysis and presentation of dataanalysis and presentation of data
analysis and presentation of data
 
Statistics Introduction
Statistics IntroductionStatistics Introduction
Statistics Introduction
 
Types of data and graphical representation
Types of data and graphical representationTypes of data and graphical representation
Types of data and graphical representation
 

Viewers also liked

Revolusi Bisnes 2015
Revolusi Bisnes 2015Revolusi Bisnes 2015
Revolusi Bisnes 2015Che Man
 
Передовые производственные технологии в строительстве формируют новые стандар...
Передовые производственные технологии в строительстве формируют новые стандар...Передовые производственные технологии в строительстве формируют новые стандар...
Передовые производственные технологии в строительстве формируют новые стандар...SAPR-Peterburg
 
Results_Prof.Ahmed Rafique Aziz
Results_Prof.Ahmed Rafique AzizResults_Prof.Ahmed Rafique Aziz
Results_Prof.Ahmed Rafique AzizAhmed Aziz
 
Determining the effects of novel benzodiazepine compounds on the ileum of a r...
Determining the effects of novel benzodiazepine compounds on the ileum of a r...Determining the effects of novel benzodiazepine compounds on the ileum of a r...
Determining the effects of novel benzodiazepine compounds on the ileum of a r...Ethan Lowe
 
3D-визуализация как необходимый этап развития проекта
3D-визуализация как необходимый этап развития проекта3D-визуализация как необходимый этап развития проекта
3D-визуализация как необходимый этап развития проектаSAPR-Peterburg
 
Построение систем электронного архива и систем управления инженерными данными
Построение систем электронного архива и систем управления инженерными даннымиПостроение систем электронного архива и систем управления инженерными данными
Построение систем электронного архива и систем управления инженерными даннымиSAPR-Peterburg
 
ложная мята (false mint)
ложная мята (false mint)ложная мята (false mint)
ложная мята (false mint)Larixko
 
Coursework bba 3001
Coursework bba 3001Coursework bba 3001
Coursework bba 3001Monie Joey
 
Математическое моделирование поведения морских гидротехнических объектов в ср...
Математическое моделирование поведения морских гидротехнических объектов в ср...Математическое моделирование поведения морских гидротехнических объектов в ср...
Математическое моделирование поведения морских гидротехнических объектов в ср...SAPR-Peterburg
 
Использование продуктов Autodesk для автоматизации проектирования гидротехнич...
Использование продуктов Autodesk для автоматизации проектирования гидротехнич...Использование продуктов Autodesk для автоматизации проектирования гидротехнич...
Использование продуктов Autodesk для автоматизации проектирования гидротехнич...SAPR-Peterburg
 
Dissataion - Ranga Perera (CB002688)
Dissataion - Ranga Perera (CB002688)Dissataion - Ranga Perera (CB002688)
Dissataion - Ranga Perera (CB002688)Ranga Perera
 
Biografi
BiografiBiografi
Biografiratu15
 
мята истинная (mint true)
мята истинная (mint true)мята истинная (mint true)
мята истинная (mint true)Larixko
 

Viewers also liked (18)

Revolusi Bisnes 2015
Revolusi Bisnes 2015Revolusi Bisnes 2015
Revolusi Bisnes 2015
 
Передовые производственные технологии в строительстве формируют новые стандар...
Передовые производственные технологии в строительстве формируют новые стандар...Передовые производственные технологии в строительстве формируют новые стандар...
Передовые производственные технологии в строительстве формируют новые стандар...
 
Results_Prof.Ahmed Rafique Aziz
Results_Prof.Ahmed Rafique AzizResults_Prof.Ahmed Rafique Aziz
Results_Prof.Ahmed Rafique Aziz
 
Determining the effects of novel benzodiazepine compounds on the ileum of a r...
Determining the effects of novel benzodiazepine compounds on the ileum of a r...Determining the effects of novel benzodiazepine compounds on the ileum of a r...
Determining the effects of novel benzodiazepine compounds on the ileum of a r...
 
Titan_IV
Titan_IVTitan_IV
Titan_IV
 
builders logo
builders logobuilders logo
builders logo
 
3D-визуализация как необходимый этап развития проекта
3D-визуализация как необходимый этап развития проекта3D-визуализация как необходимый этап развития проекта
3D-визуализация как необходимый этап развития проекта
 
cv i
cv icv i
cv i
 
Построение систем электронного архива и систем управления инженерными данными
Построение систем электронного архива и систем управления инженерными даннымиПостроение систем электронного архива и систем управления инженерными данными
Построение систем электронного архива и систем управления инженерными данными
 
ложная мята (false mint)
ложная мята (false mint)ложная мята (false mint)
ложная мята (false mint)
 
E commerce
E commerce E commerce
E commerce
 
Coursework bba 3001
Coursework bba 3001Coursework bba 3001
Coursework bba 3001
 
Математическое моделирование поведения морских гидротехнических объектов в ср...
Математическое моделирование поведения морских гидротехнических объектов в ср...Математическое моделирование поведения морских гидротехнических объектов в ср...
Математическое моделирование поведения морских гидротехнических объектов в ср...
 
Rug Cleaning
Rug Cleaning Rug Cleaning
Rug Cleaning
 
Использование продуктов Autodesk для автоматизации проектирования гидротехнич...
Использование продуктов Autodesk для автоматизации проектирования гидротехнич...Использование продуктов Autodesk для автоматизации проектирования гидротехнич...
Использование продуктов Autodesk для автоматизации проектирования гидротехнич...
 
Dissataion - Ranga Perera (CB002688)
Dissataion - Ranga Perera (CB002688)Dissataion - Ranga Perera (CB002688)
Dissataion - Ranga Perera (CB002688)
 
Biografi
BiografiBiografi
Biografi
 
мята истинная (mint true)
мята истинная (mint true)мята истинная (mint true)
мята истинная (mint true)
 

Similar to Bba 2001

Graphicalrepresntationofdatausingstatisticaltools2019_210902_105156.pdf
Graphicalrepresntationofdatausingstatisticaltools2019_210902_105156.pdfGraphicalrepresntationofdatausingstatisticaltools2019_210902_105156.pdf
Graphicalrepresntationofdatausingstatisticaltools2019_210902_105156.pdfHimakshi7
 
Quantitative techniques in business
Quantitative techniques in businessQuantitative techniques in business
Quantitative techniques in businesssameer sheikh
 
Introduction to statistics and graphical representation
Introduction to statistics and graphical representationIntroduction to statistics and graphical representation
Introduction to statistics and graphical representationAMNA BUTT
 
OLD SEVEN TOOLS OF QUALTIY MANAGEMENT
OLD SEVEN TOOLS OF QUALTIY MANAGEMENTOLD SEVEN TOOLS OF QUALTIY MANAGEMENT
OLD SEVEN TOOLS OF QUALTIY MANAGEMENTANNA UNIVERSITY
 
Chapter 4 MMW.pdf
Chapter 4 MMW.pdfChapter 4 MMW.pdf
Chapter 4 MMW.pdfRaRaRamirez
 
1.0 Descriptive statistics.pdf
1.0 Descriptive statistics.pdf1.0 Descriptive statistics.pdf
1.0 Descriptive statistics.pdfthaersyam
 
Data Management_new.pptx
Data Management_new.pptxData Management_new.pptx
Data Management_new.pptxDharenOla3
 
Artificial Intelligence - Data Analysis, Creative & Critical Thinking and AI...
Artificial Intelligence - Data Analysis, Creative & Critical Thinking and  AI...Artificial Intelligence - Data Analysis, Creative & Critical Thinking and  AI...
Artificial Intelligence - Data Analysis, Creative & Critical Thinking and AI...deboshreechatterjee2
 
7 qc tools
7 qc tools7 qc tools
7 qc toolskmsonam
 
Research methodology-Research Report
Research methodology-Research ReportResearch methodology-Research Report
Research methodology-Research ReportDrMAlagupriyasafiq
 
Research Methodology-Data Processing
Research Methodology-Data ProcessingResearch Methodology-Data Processing
Research Methodology-Data ProcessingDrMAlagupriyasafiq
 

Similar to Bba 2001 (20)

Graphicalrepresntationofdatausingstatisticaltools2019_210902_105156.pdf
Graphicalrepresntationofdatausingstatisticaltools2019_210902_105156.pdfGraphicalrepresntationofdatausingstatisticaltools2019_210902_105156.pdf
Graphicalrepresntationofdatausingstatisticaltools2019_210902_105156.pdf
 
Quantitative techniques in business
Quantitative techniques in businessQuantitative techniques in business
Quantitative techniques in business
 
Introduction to statistics and graphical representation
Introduction to statistics and graphical representationIntroduction to statistics and graphical representation
Introduction to statistics and graphical representation
 
Unit 1 - Statistics (Part 1).pptx
Unit 1 - Statistics (Part 1).pptxUnit 1 - Statistics (Part 1).pptx
Unit 1 - Statistics (Part 1).pptx
 
Tqm old tools
Tqm old toolsTqm old tools
Tqm old tools
 
Tqm old tools
Tqm old toolsTqm old tools
Tqm old tools
 
OLD SEVEN TOOLS OF QUALTIY MANAGEMENT
OLD SEVEN TOOLS OF QUALTIY MANAGEMENTOLD SEVEN TOOLS OF QUALTIY MANAGEMENT
OLD SEVEN TOOLS OF QUALTIY MANAGEMENT
 
Chapter 4 MMW.pdf
Chapter 4 MMW.pdfChapter 4 MMW.pdf
Chapter 4 MMW.pdf
 
1.0 Descriptive statistics.pdf
1.0 Descriptive statistics.pdf1.0 Descriptive statistics.pdf
1.0 Descriptive statistics.pdf
 
Data Management_new.pptx
Data Management_new.pptxData Management_new.pptx
Data Management_new.pptx
 
Edited economic statistics note
Edited economic statistics noteEdited economic statistics note
Edited economic statistics note
 
Presentation1.pptx
Presentation1.pptxPresentation1.pptx
Presentation1.pptx
 
Introduction to Descriptive Statistics
Introduction to Descriptive StatisticsIntroduction to Descriptive Statistics
Introduction to Descriptive Statistics
 
7.pptx
7.pptx7.pptx
7.pptx
 
Basic Statistics to start Analytics
Basic Statistics to start AnalyticsBasic Statistics to start Analytics
Basic Statistics to start Analytics
 
Artificial Intelligence - Data Analysis, Creative & Critical Thinking and AI...
Artificial Intelligence - Data Analysis, Creative & Critical Thinking and  AI...Artificial Intelligence - Data Analysis, Creative & Critical Thinking and  AI...
Artificial Intelligence - Data Analysis, Creative & Critical Thinking and AI...
 
STATISTICS.pptx
STATISTICS.pptxSTATISTICS.pptx
STATISTICS.pptx
 
7 qc tools
7 qc tools7 qc tools
7 qc tools
 
Research methodology-Research Report
Research methodology-Research ReportResearch methodology-Research Report
Research methodology-Research Report
 
Research Methodology-Data Processing
Research Methodology-Data ProcessingResearch Methodology-Data Processing
Research Methodology-Data Processing
 

Recently uploaded

/:Call Girls In Jaypee Siddharth - 5 Star Hotel New Delhi ➥9990211544 Top Esc...
/:Call Girls In Jaypee Siddharth - 5 Star Hotel New Delhi ➥9990211544 Top Esc.../:Call Girls In Jaypee Siddharth - 5 Star Hotel New Delhi ➥9990211544 Top Esc...
/:Call Girls In Jaypee Siddharth - 5 Star Hotel New Delhi ➥9990211544 Top Esc...lizamodels9
 
Regression analysis: Simple Linear Regression Multiple Linear Regression
Regression analysis:  Simple Linear Regression Multiple Linear RegressionRegression analysis:  Simple Linear Regression Multiple Linear Regression
Regression analysis: Simple Linear Regression Multiple Linear RegressionRavindra Nath Shukla
 
Cash Payment 9602870969 Escort Service in Udaipur Call Girls
Cash Payment 9602870969 Escort Service in Udaipur Call GirlsCash Payment 9602870969 Escort Service in Udaipur Call Girls
Cash Payment 9602870969 Escort Service in Udaipur Call GirlsApsara Of India
 
The CMO Survey - Highlights and Insights Report - Spring 2024
The CMO Survey - Highlights and Insights Report - Spring 2024The CMO Survey - Highlights and Insights Report - Spring 2024
The CMO Survey - Highlights and Insights Report - Spring 2024christinemoorman
 
Vip Female Escorts Noida 9711199171 Greater Noida Escorts Service
Vip Female Escorts Noida 9711199171 Greater Noida Escorts ServiceVip Female Escorts Noida 9711199171 Greater Noida Escorts Service
Vip Female Escorts Noida 9711199171 Greater Noida Escorts Serviceankitnayak356677
 
Lowrate Call Girls In Sector 18 Noida ❤️8860477959 Escorts 100% Genuine Servi...
Lowrate Call Girls In Sector 18 Noida ❤️8860477959 Escorts 100% Genuine Servi...Lowrate Call Girls In Sector 18 Noida ❤️8860477959 Escorts 100% Genuine Servi...
Lowrate Call Girls In Sector 18 Noida ❤️8860477959 Escorts 100% Genuine Servi...lizamodels9
 
Call Girls in Gomti Nagar - 7388211116 - With room Service
Call Girls in Gomti Nagar - 7388211116  - With room ServiceCall Girls in Gomti Nagar - 7388211116  - With room Service
Call Girls in Gomti Nagar - 7388211116 - With room Servicediscovermytutordmt
 
Call Girls In Radisson Blu Hotel New Delhi Paschim Vihar ❤️8860477959 Escorts...
Call Girls In Radisson Blu Hotel New Delhi Paschim Vihar ❤️8860477959 Escorts...Call Girls In Radisson Blu Hotel New Delhi Paschim Vihar ❤️8860477959 Escorts...
Call Girls In Radisson Blu Hotel New Delhi Paschim Vihar ❤️8860477959 Escorts...lizamodels9
 
Mondelez State of Snacking and Future Trends 2023
Mondelez State of Snacking and Future Trends 2023Mondelez State of Snacking and Future Trends 2023
Mondelez State of Snacking and Future Trends 2023Neil Kimberley
 
M.C Lodges -- Guest House in Jhang.
M.C Lodges --  Guest House in Jhang.M.C Lodges --  Guest House in Jhang.
M.C Lodges -- Guest House in Jhang.Aaiza Hassan
 
Enhancing and Restoring Safety & Quality Cultures - Dave Litwiller - May 2024...
Enhancing and Restoring Safety & Quality Cultures - Dave Litwiller - May 2024...Enhancing and Restoring Safety & Quality Cultures - Dave Litwiller - May 2024...
Enhancing and Restoring Safety & Quality Cultures - Dave Litwiller - May 2024...Dave Litwiller
 
Vip Dewas Call Girls #9907093804 Contact Number Escorts Service Dewas
Vip Dewas Call Girls #9907093804 Contact Number Escorts Service DewasVip Dewas Call Girls #9907093804 Contact Number Escorts Service Dewas
Vip Dewas Call Girls #9907093804 Contact Number Escorts Service Dewasmakika9823
 
Keppel Ltd. 1Q 2024 Business Update Presentation Slides
Keppel Ltd. 1Q 2024 Business Update  Presentation SlidesKeppel Ltd. 1Q 2024 Business Update  Presentation Slides
Keppel Ltd. 1Q 2024 Business Update Presentation SlidesKeppelCorporation
 
Call Girls In Connaught Place Delhi ❤️88604**77959_Russian 100% Genuine Escor...
Call Girls In Connaught Place Delhi ❤️88604**77959_Russian 100% Genuine Escor...Call Girls In Connaught Place Delhi ❤️88604**77959_Russian 100% Genuine Escor...
Call Girls In Connaught Place Delhi ❤️88604**77959_Russian 100% Genuine Escor...lizamodels9
 
VIP Call Girl Jamshedpur Aashi 8250192130 Independent Escort Service Jamshedpur
VIP Call Girl Jamshedpur Aashi 8250192130 Independent Escort Service JamshedpurVIP Call Girl Jamshedpur Aashi 8250192130 Independent Escort Service Jamshedpur
VIP Call Girl Jamshedpur Aashi 8250192130 Independent Escort Service JamshedpurSuhani Kapoor
 
Call Girls Navi Mumbai Just Call 9907093804 Top Class Call Girl Service Avail...
Call Girls Navi Mumbai Just Call 9907093804 Top Class Call Girl Service Avail...Call Girls Navi Mumbai Just Call 9907093804 Top Class Call Girl Service Avail...
Call Girls Navi Mumbai Just Call 9907093804 Top Class Call Girl Service Avail...Dipal Arora
 
Call Girls In Sikandarpur Gurgaon ❤️8860477959_Russian 100% Genuine Escorts I...
Call Girls In Sikandarpur Gurgaon ❤️8860477959_Russian 100% Genuine Escorts I...Call Girls In Sikandarpur Gurgaon ❤️8860477959_Russian 100% Genuine Escorts I...
Call Girls In Sikandarpur Gurgaon ❤️8860477959_Russian 100% Genuine Escorts I...lizamodels9
 
Insurers' journeys to build a mastery in the IoT usage
Insurers' journeys to build a mastery in the IoT usageInsurers' journeys to build a mastery in the IoT usage
Insurers' journeys to build a mastery in the IoT usageMatteo Carbone
 
7.pdf This presentation captures many uses and the significance of the number...
7.pdf This presentation captures many uses and the significance of the number...7.pdf This presentation captures many uses and the significance of the number...
7.pdf This presentation captures many uses and the significance of the number...Paul Menig
 

Recently uploaded (20)

/:Call Girls In Jaypee Siddharth - 5 Star Hotel New Delhi ➥9990211544 Top Esc...
/:Call Girls In Jaypee Siddharth - 5 Star Hotel New Delhi ➥9990211544 Top Esc.../:Call Girls In Jaypee Siddharth - 5 Star Hotel New Delhi ➥9990211544 Top Esc...
/:Call Girls In Jaypee Siddharth - 5 Star Hotel New Delhi ➥9990211544 Top Esc...
 
Best Practices for Implementing an External Recruiting Partnership
Best Practices for Implementing an External Recruiting PartnershipBest Practices for Implementing an External Recruiting Partnership
Best Practices for Implementing an External Recruiting Partnership
 
Regression analysis: Simple Linear Regression Multiple Linear Regression
Regression analysis:  Simple Linear Regression Multiple Linear RegressionRegression analysis:  Simple Linear Regression Multiple Linear Regression
Regression analysis: Simple Linear Regression Multiple Linear Regression
 
Cash Payment 9602870969 Escort Service in Udaipur Call Girls
Cash Payment 9602870969 Escort Service in Udaipur Call GirlsCash Payment 9602870969 Escort Service in Udaipur Call Girls
Cash Payment 9602870969 Escort Service in Udaipur Call Girls
 
The CMO Survey - Highlights and Insights Report - Spring 2024
The CMO Survey - Highlights and Insights Report - Spring 2024The CMO Survey - Highlights and Insights Report - Spring 2024
The CMO Survey - Highlights and Insights Report - Spring 2024
 
Vip Female Escorts Noida 9711199171 Greater Noida Escorts Service
Vip Female Escorts Noida 9711199171 Greater Noida Escorts ServiceVip Female Escorts Noida 9711199171 Greater Noida Escorts Service
Vip Female Escorts Noida 9711199171 Greater Noida Escorts Service
 
Lowrate Call Girls In Sector 18 Noida ❤️8860477959 Escorts 100% Genuine Servi...
Lowrate Call Girls In Sector 18 Noida ❤️8860477959 Escorts 100% Genuine Servi...Lowrate Call Girls In Sector 18 Noida ❤️8860477959 Escorts 100% Genuine Servi...
Lowrate Call Girls In Sector 18 Noida ❤️8860477959 Escorts 100% Genuine Servi...
 
Call Girls in Gomti Nagar - 7388211116 - With room Service
Call Girls in Gomti Nagar - 7388211116  - With room ServiceCall Girls in Gomti Nagar - 7388211116  - With room Service
Call Girls in Gomti Nagar - 7388211116 - With room Service
 
Call Girls In Radisson Blu Hotel New Delhi Paschim Vihar ❤️8860477959 Escorts...
Call Girls In Radisson Blu Hotel New Delhi Paschim Vihar ❤️8860477959 Escorts...Call Girls In Radisson Blu Hotel New Delhi Paschim Vihar ❤️8860477959 Escorts...
Call Girls In Radisson Blu Hotel New Delhi Paschim Vihar ❤️8860477959 Escorts...
 
Mondelez State of Snacking and Future Trends 2023
Mondelez State of Snacking and Future Trends 2023Mondelez State of Snacking and Future Trends 2023
Mondelez State of Snacking and Future Trends 2023
 
M.C Lodges -- Guest House in Jhang.
M.C Lodges --  Guest House in Jhang.M.C Lodges --  Guest House in Jhang.
M.C Lodges -- Guest House in Jhang.
 
Enhancing and Restoring Safety & Quality Cultures - Dave Litwiller - May 2024...
Enhancing and Restoring Safety & Quality Cultures - Dave Litwiller - May 2024...Enhancing and Restoring Safety & Quality Cultures - Dave Litwiller - May 2024...
Enhancing and Restoring Safety & Quality Cultures - Dave Litwiller - May 2024...
 
Vip Dewas Call Girls #9907093804 Contact Number Escorts Service Dewas
Vip Dewas Call Girls #9907093804 Contact Number Escorts Service DewasVip Dewas Call Girls #9907093804 Contact Number Escorts Service Dewas
Vip Dewas Call Girls #9907093804 Contact Number Escorts Service Dewas
 
Keppel Ltd. 1Q 2024 Business Update Presentation Slides
Keppel Ltd. 1Q 2024 Business Update  Presentation SlidesKeppel Ltd. 1Q 2024 Business Update  Presentation Slides
Keppel Ltd. 1Q 2024 Business Update Presentation Slides
 
Call Girls In Connaught Place Delhi ❤️88604**77959_Russian 100% Genuine Escor...
Call Girls In Connaught Place Delhi ❤️88604**77959_Russian 100% Genuine Escor...Call Girls In Connaught Place Delhi ❤️88604**77959_Russian 100% Genuine Escor...
Call Girls In Connaught Place Delhi ❤️88604**77959_Russian 100% Genuine Escor...
 
VIP Call Girl Jamshedpur Aashi 8250192130 Independent Escort Service Jamshedpur
VIP Call Girl Jamshedpur Aashi 8250192130 Independent Escort Service JamshedpurVIP Call Girl Jamshedpur Aashi 8250192130 Independent Escort Service Jamshedpur
VIP Call Girl Jamshedpur Aashi 8250192130 Independent Escort Service Jamshedpur
 
Call Girls Navi Mumbai Just Call 9907093804 Top Class Call Girl Service Avail...
Call Girls Navi Mumbai Just Call 9907093804 Top Class Call Girl Service Avail...Call Girls Navi Mumbai Just Call 9907093804 Top Class Call Girl Service Avail...
Call Girls Navi Mumbai Just Call 9907093804 Top Class Call Girl Service Avail...
 
Call Girls In Sikandarpur Gurgaon ❤️8860477959_Russian 100% Genuine Escorts I...
Call Girls In Sikandarpur Gurgaon ❤️8860477959_Russian 100% Genuine Escorts I...Call Girls In Sikandarpur Gurgaon ❤️8860477959_Russian 100% Genuine Escorts I...
Call Girls In Sikandarpur Gurgaon ❤️8860477959_Russian 100% Genuine Escorts I...
 
Insurers' journeys to build a mastery in the IoT usage
Insurers' journeys to build a mastery in the IoT usageInsurers' journeys to build a mastery in the IoT usage
Insurers' journeys to build a mastery in the IoT usage
 
7.pdf This presentation captures many uses and the significance of the number...
7.pdf This presentation captures many uses and the significance of the number...7.pdf This presentation captures many uses and the significance of the number...
7.pdf This presentation captures many uses and the significance of the number...
 

Bba 2001

  • 1. Page 1 of 37 1.0 CONTENT NO. TOPIC PAGES 1.0 CONTENT 1 2.0 TASK 1 2-3 3.0 TASK 2 4-10 4.0 TASK 3 11-16 5.0 TASK 4 17-19 6.0 TASK 5 20-23 5.0 REFERENCE 24 6.0 COURSEWORK 25-37
  • 2. Page 2 of 37 1.0 INTRODUCTION Statistics is the study of the collection, analysis, interpretation, presentation, and organization of data. In applying statistics to, e.g., a scientific, industrial, or social problem, it is conservative to create with a statistical population or a statistical model process to be studied. Populations can be different topics such as "all people living in a country" or "every atom composing a crystal". Statistics deals with all aspects of data including the planning of data collection in terms of the design of surveys and experiments. Some popular definitions are: Merriam-Webster dictionary defines statistics as "classified facts representing the conditions of a people in a state – especially the facts that can be stated in numbers or any other tabular or classified arrangement[2]". Statistician Sir Arthur Lyon Bowley defines statistics as "Numerical statements of facts in any department of inquiry placed in relation to each other".
  • 3. Page 3 of 37 When census data cannot be collected, statisticians collect data by developing specific experiment designs and survey samples. Representative sampling assures that inferences and conclusions can safely extend from the sample to the population as a whole. An experimental study involves taking measurements of the system under study, manipulating the system, and then taking additional measurements using the same procedure to determine if the manipulation has modified the values of the measurements. In contrast, an observational study does not involve experimental manipulation.
  • 4. Page 4 of 37 2.0 TASK 1 Today’s Special Frequency Fried chicken 12 Meat loaf 14 Turkey pot pie 8 Fish and chips 10 Lasagna 6
  • 5. Page 5 of 37 The choice of method is influenced by the data collection strategy, the type of variable, the accuracy required, the collection point and the skill of the enumerator. Links between a variable, its source and practical methods for its collection can help in choosing appropriate methods. The main data collection methods are: 0 2 4 6 8 10 12 14 16 Fried chicken Meat loaf Turkey pot pie Fish and chips Lasagna CustomerChoice Customer Choice
  • 6. Page 6 of 37 · Registration: registers and licenses are principally valuable for complete enumeration, but are limited to variables that change slowly, such as numbers of fishing vessels and their characteristics. · Questionnaires: forms which are completed and returned by respondents. An inexpensive method that is useful where literacy rates are high and respondents are co- operative. · Interviews: forms which are completed through an interview with the respondent. More expensive than questionnaires, but they are better for more complex questions, low literacy or less co-operation. · Direct observations: making direct measurements is the most accurate method for many variables, such as catch, but is often expensive. Many methods, such as observer programmes, are limited to industrial fisheries. · Reporting: the main alternative to making direct measurements is to require fishers and others to report their activities. Reporting requires literacy and co-operation, but can be backed up by a legal requirement and direct measurements.
  • 7. Page 7 of 37 When we are graphing and organizing the collected data, students' experiences in displaying data should progress from the concrete, to the pictorial, to the abstract. When creating bar graphs, for example, they may progress from using objects, such as blocks or pieces of candy, to using sticky notes, to creating single-bar graphs, to using a color key to identify different bars of a double-bar graph. From the beginning, students should learn to label graphs with a title, the labels for each axis (x and y), the units of analysis (e.g., feet, meters, dollars) and how to create a key. Over time, students should learn the names of the different parts of different graphs. Questions that can be addressed with numerical data include, "How many pets do you have?" or "When were you born?" Line plots, bar graphs, scatterplots, and stem-and- leaf plots are often used to represent numerical data. The most effective way to analyze numerical data is to look at the mean, median, counts, and the shape (for example, the arc of a bell curve or the clustering of scatter plots) of the data. Questions about categorical data are not answered with numbers, but with words. Generally line plots, bar graphs, and circle graphs are used to represent categorical data. An effective way to analyze categorical data is by counts or percentages.
  • 8. Page 8 of 37 Questions that can be addressed by collecting data over time (longitudinal data) include "What is the average temperature in the month of June?" or "What was the daily weather conditions in month of June?" Descriptions of the various graphs students will learn to make as they progress from the primary to the middle grades are listed below, with examples:  Bar Graph: Used when comparing various items or ideas.  Histogram: Used to show frequency and compare items or ideas; each bar represents an interval of values.  Line Graph: Used to show change over time.  Pictograph: Used to show frequency and compare items or ideas.  Circle Graph (or Pie Graph): Used to show parts or percentages of a whole.
  • 9. Page 9 of 37  Box-and-Whisker Plot: Used to show the range of values as well as the median, quartiles, and outliers; five-number summary is another name for this representation.  Line Plot: Used to easily organize one group of data.  Scatterplot (or Scattergram): Used to determine if a correlation exists between two data sets, and how strong it is, also used to calculate line or curve of best fit.  Stem-and-Leaf Plot: Used to show frequency; data is grouped according to place value, using the digit in the greatest place. It is valuable for students to explore various ways to represent the same data. Students can determine which graph makes the most sense to use and which graph can help them answer their questions most easily. For example, a favorite book survey can be shown as a table, a bar graph, a circle graph and a picture graph. Students can discuss which
  • 10. Page 10 of 37 representation most clearly shows which book got the most votes or the difference in votes. Students can remove the least favorite book and vote again to explore the change in data. It is also valuable for students to understand that the same data is not always best represented in different ways. For example, line plots, bar graphs, scatterplots, and stem- and-leaf plots are best used to represent numerical data. However, longitudinal data are best represented by line graphs. Categorical data are not displayed in a specific order and most often are represented by line plots, bar graphs, and circle graphs.
  • 11. Page 11 of 37 3.0 TASK 2 a) Produce a suitable histogram. b) Describe the shape of the histogram. The histogram that I draw is a random distribution, as shown above, has no apparent pattern. Like the uniform distribution, it may describe a distribution that has several peaks. Due to the histogram has this shape, I have already check to see the several sources of variation have been combined. I analyze them separately. The multiple sources of variation do not seem to be the cause of this 0 5 10 15 20 25 0 to 1 1 to 2 2 to3 3 to 4 4 to 5 5 to 6 6 to 7 Number of employee spent on the internet against working hours
  • 12. Page 12 of 37 pattern, different groupings can be tried to see if a more useful pattern results. This could be as simple as changing the starting and ending points of the cells, or changing the number of cells. A random distribution often means there are too many classes. c) The graph tells me that most of the employees seldom spent on the internet during the working hours. The mode of the graph is (1-2) hours. The median class of the graph is (1-2) hours. The median of the graph is 3 hours. The mean of the is calculated, which is 2.25.
  • 13. Page 13 of 37 4.0 TASK 3 The number of the sick days due to cold and flu last year was recovered by a sample of 15 adults. The data are 5,7,0,3,15,6,5,5,9,3,8,10,5,2,0,12: a) Compute the mean, median, and mode. Mean = (5+7+0+3+15+6+5+9+3+8+10+5+2+0+12) 15 = 90 15 =6 Median = 5 Mode = 5 • The mean, median and mode are all valid measures of central tendency • But, under different conditions, some measures of central tendency become more appropriate to use the others. • Mean ( Arithmetic)
  • 14. Page 14 of 37 The mean (or average) is the most popular and well known measure of central tendency.It can be used with both discrete and continuous data, although its use is most often with continuous data.The mean is equal to the sum of all the values in the data set divided by the number of values in the data set. • Median The median is the middle score for a set of data that has been arranged in order of magnitude.The median is less affected by outliers and skewed data. • Mode The mode is the most frequent score in our data set.On a histogram it represents the higher bar in a bar chart or histogram. Sometimes consider the mode as being the most popular option b) Mean, median and mode are used to calculating central tendencies of any data/distribution. These numbers quickly summarize the data. So they are also called the estimates.
  • 15. Page 15 of 37 Mean helps us to quantify average value in the data. (This is highly susceptible to outliers i.e. extreme values). Median helps us to identify the range of the data. i.e. 50% of the data lies below or above median value. (Median is also called as 50th percentile). Mode is used to identify most frequent values. Let’s take an example. Consider number of children per household in USA.It would make sense to consider median and mode values but it also depends on the question we need to answer. Median will tell us how many children does 50% of the population has.Mode will tell us how many children most of the households have. Mean, for example, average number of children per household is 2.5… Does this number make sense? Can anyone have two and half children? Then why do we consider computing averages in such cases? The averages are computed for conducting some statistical tests. Consider scenarios in which we have to compare the number of children an American household and British household has. We behavior some statistical tests (t-tests etc.) to conclude are these number statistically significantly different or they are similar.
  • 16. Page 16 of 37 So Median, Mode and mean has its own advantages and limitations. We must choose proper estimates to answer real world questions.
  • 17. Page 17 of 37 5.0 TASK 4 a) Stem-and-leaf plots  sample 1 Stem Leaf 1 1 2 6 7 2 9  sample 2 Stem Leaf 1 7 8 2 0 2 3  sample 3 Stem Leaf 0 6 2 4 9 3 7 9  Sample 3 has the largest amount of variation because the stem-and-leaf plots in widely spread  Sample 2 has the smallest amount of variation because the central location for the stem-and leaf plots has little dispersion.
  • 18. Page 18 of 37 (a)  Sample 1: Mean = (11 + 12+ 16 + 17 + 29 ) ÷ 5 = 17 Variance = (11 – 17)2 + (12-17)2 + (16-17)2 + (17-17)2 + (29-17)2 = 25.2 5  Sample 2: Mean = ( 17 + 18 + 20 + 22 + 23 ) ÷ 5 = 20 Variance = (17 – 20 )2 + (18-20)2 + (20-20)2 + (22-20)2 + (23-20)2 = 5.2 5  Sample 3: Mean = ( 6 + 24 + 29 + 37 + 39 ) ÷ 5 = 27 Variance = (6 – 27 )2 + (24-27)2 + (29-27)2 + (37-27)2 + (39-27)2 = 139.6 5 Conclusion: My answer in (a) is correct.
  • 19. Page 19 of 37 6.0 TASK 5 Statistics are sets of mathematical equations that are used to analyze what is happening in the world around us. You've heard that today we live in the Information Age where we understand a great deal about the world around us. Much of this information was determined mathematically by using statistics. When used correctly, statistics tell us any trends in what happened in the past and can be useful in predicting what may happen in the future. Let's look at some examples of how statistics shape your life when you don't even know it. 1. Weather Forecasts Do you watch the weather forecast sometime during the day? How do you use that information? Have you ever heard the forecaster talk about weather models? These computer models are built using statistics that compare prior weather conditions with current weather to predict future weather. 2. Emergency Preparedness
  • 20. Page 20 of 37 What happens if the forecast indicates that a hurricane is imminent or that tornadoes are likely to occur? Emergency management agencies move into high gear to be ready to rescue people. Emergency teams rely on statistics to tell them when danger may occur. 3. Predicting Disease Lots of times on the news reports, statistics about a disease are reported. If the reporter simply reports the number of people who either have the disease or who have died from it, it's an interesting fact but it might not mean much to your life. But when statistics become involved, you have a better idea of how that disease may affect you. For example, studies have shown that 85 to 95 percent of lung cancers are smoking related. The statistic should tell you that almost all lung cancers are related to smoking and that if you want to have a good chance of avoiding lung cancer, you shouldn't smoke. 4. Medical Studies
  • 21. Page 21 of 37 Scientists must show a statistically valid rate of effectiveness before any drug can be prescribed. Statistics are behind every medical study you hear about. 5. Genetics Many people are afflicted with diseases that come from their genetic make-up and these diseases can potentially be passed on to their children. Statistics are critical in determining the chances of a new baby being affected by the disease. 6. Political Campaigns Whenever there's an election, the news organizations consult their models when they try to predict who the winner is. Candidates consult voter polls to determine where and how they campaign. Statistics play a part in who your elected government officials will be 7. Insurance You know that in order to drive your car you are required by law to have car insurance. If you have a mortgage on your house, you must have it insured as well. The rate that an insurance company charges you is based upon statistics from all drivers or homeowners in your area.
  • 22. Page 22 of 37 8. Consumer Goods Wal-Mart, a worldwide leading retailer, keeps track of everything they sell and use statistics to calculate what to ship to each store and when. From analyzing their vast store of information, for example, Wal-Mart decided that people buy strawberry Pop Tarts when a hurricane is predicted in Florida! So they ship this product to Florida stores based upon the weather forecast. 9. Quality Testing Companies make thousands of products every day and each company must make sure that a good quality item is sold. But a company can't test each and every item that they ship to you, the consumer. So the company uses statistics to test just a few, called a sample, of what they make. If the sample passes quality tests, then the company assumes that all the items made in the group, called a batch, are good. 10. Stock Market
  • 23. Page 23 of 37 Another topic that you hear a lot about in the news is the stock market. Stock analysts also use statistical computer models to forecast what is happening in the economy.
  • 24. Page 24 of 37 7.0 REFERENCE 1. Textbook BBA 2001 2. https://www.quora.com/What-are-the-advantages-of-mean-median-and-mode 3. http://www.pqsystems.com/qualityadvisor/DataAnalysisTools/interpretation/histogram _shape.php 4. http://www.mathworksheetscenter.com/mathtips/statsareimportant.html 5. https://en.wikipedia.org/wiki/Statistics 6. http://www.learnnc.org/lp/pages/3188 7. http://info.dogpile.com/dogpl.305.10/search/web?q=use+of+statistics+in+daily+life&a d.network=g&ad.keyword=use%20of%20statistics%20in%20daily%20life&ad.creative =83492475543&ad.position=1o1&ad.placement=&ad.matchtype=b&ad.aceid=&ad.ism obile=&ad.device=c&ad.devicemodel=&ad.adgroupid=18778071183&cid=278051703 &ad.segment=dogpl.305.10
  • 25. Page 25 of 37 8.0 Coursework 2.1 Please describe strengths and weaknesses of basic sampling techniques. The following table provides a summary of strengths and weaknesses of basic sampling techniques. Non-probability sampling Techniques Strengths Weaknesses Convenience sampling Less expensive, less time consuming, most convenient Selection bias, sample not representative, not recommended for descriptive or causal research Judgemental sampling Low cost, convenient, not time consuming Does not allow generalisation, subjective Quota sampling Sample can be controlled for certain characteristics Selection bias, no assurance of representativeness Snowball sampling Can estimate rare characteristics Time consuming
  • 27. Page 27 of 37 Probability sampling Techniques Strengths Weaknesses Simple random sampling Easily applied. Result can be projected on population Difficult to obtain sampling frame, expensive, sometimes no assurance of representativeness Systematic sampling Easier to implement than simple random sampling Can decrease representativeness if certain patterns exist in sampling frame Stratified sampling Includes all important subpopulations, precision is improved Difficult to select relevant stratification variables, not feasible to stratify on many variables, expensive Cluster sampling Easy to implement, cost effective and work is reduced Imprecise, difficult to compute and to interpret results
  • 28. Page 28 of 37 2.2 Please describe secondary data. Secondary data are normally published data collected by other parties. Government agencies such as Bank Negara, the Department of Statistics, Ministry of International Trade and Industry and other agencies publish their data regularly and provide secondary sources of data to many researchers. In addition, bulletins, journals, newspapers and other publications also provide useful secondary data to researchers. However, some of the secondary data are not current. A researcher needs to choose wisely the secondary data for his research. One advantage of secondary data is that it is easily accessible from the internet, journals, annual reports and newspaper. It is relatively inexpensive because there is no fieldwork required. It also requires less time to collect. Some data such as import and export data are only available from secondary sources. However, there are some disadvantages of secondary data as well. The secondary data may lack accuracy because the measurement procedure and the method of data collection are not explained by the previous researchers. The data may be biased because the original purpose of data collection is not known. Finally, the data may not meet the specific needs and objectives of the current research, or there may be too many constraints involved.
  • 33. Page 33 of 37 7.0 TASK 5.0 There are 10 everyday reasons why statistics are important. Statistics are sets of mathematical equations that are used to analyze what is happening in the world around us.
  • 34. Page 34 of 37 You've heard that today we live in the Information Age where we understand a great deal about the world around us. Much of this information was determined mathematically by using statistics. When used correctly, statistics tell us any trends in what happened in the past and can be useful in predicting what may happen in the future. Let's look at some examples of how statistics shape your life when you don't even know it. Statistics are sets of mathematical equations that are used to analyze what is happening in the world around us. You've heard that today we live in the Information Age where we understand a great deal about the world around us. Much of this information was determined mathematically by using statistics. When used correctly, statistics tell us any trends in what happened in the past and can be useful in predicting what may happen in the future. Let's look at some examples of how statistics shape your life when you don't even know it. 1. Weather Forecasts Do you watch the weather forecast sometime during the day? How do you use that information? Have you ever heard the forecaster talk about weather models? These
  • 35. Page 35 of 37 computer models are built using statistics that compare prior weather conditions with current weather to predict future weather. 2. Emergency Preparedness What happens if the forecast indicates that a hurricane is imminent or that tornadoes are likely to occur? Emergency management agencies move into high gear to be ready to rescue people. Emergency teams rely on statistics to tell them when danger may occur. 3. Predicting Disease Lots of times on the news reports, statistics about a disease are reported. If the reporter simply reports the number of people who either have the disease or who have died from it, it's an interesting fact but it might not mean much to your life. But when statistics become involved, you have a better idea of how that disease may affect you. For example, studies have shown that 85 to 95 percent of lung cancers are smoking related. The statistic should tell you that almost all lung cancers are related to smoking and that if you want to have a good chance of avoiding lung cancer, you shouldn't smoke.
  • 36. Page 36 of 37 4. Medical Studies Scientists must show a statistically valid rate of effectiveness before any drug can be prescribed. Statistics are behind every medical study you hear about. 5. Genetics Many people are afflicted with diseases that come from their genetic make-up and these diseases can potentially be passed on to their children. Statistics are critical in determining the chances of a new baby being affected by the disease. 6. Political Campaigns Whenever there's an election, the news organizations consult their models when they try to predict who the winner is. Candidates consult voter polls to determine where and how they campaign. Statistics play a part in who your elected government officials will be 7. Insurance You know that in order to drive your car you are required by law to have car insurance. If you have a mortgage on your house, you must have it insured as well. The rate that an insurance company charges you is based upon statistics from all drivers or homeowners in your area.
  • 37. Page 37 of 37 8. Consumer Goods Wal-Mart, a worldwide leading retailer, keeps track of everything they sell and use statistics to calculate what to ship to each store and when. From analyzing their vast store of information, for example, Wal-Mart decided that people buy strawberry Pop Tarts when a hurricane is predicted in Florida! So they ship this product to Florida stores based upon the weather forecast. 9. Quality Testing Companies make thousands of products every day and each company must make sure that a good quality item is sold. But a company can't test each and every item that they ship to you, the consumer. So the company uses statistics to test just a few, called a sample, of what they make. If the sample passes quality tests, then the company assumes that all the items made in the group, called a batch, are good. 10. Stock Market Another topic that you hear a lot about in the news is the stock market. Stock analysts also use statistical computer models to forecast what is happening in the economy.