Downloaded 194 times
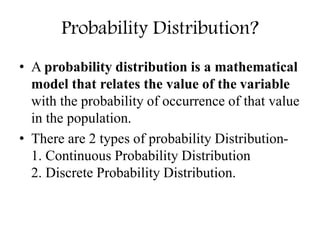
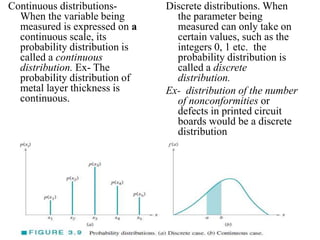
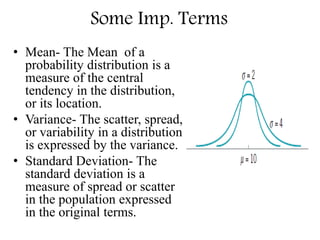


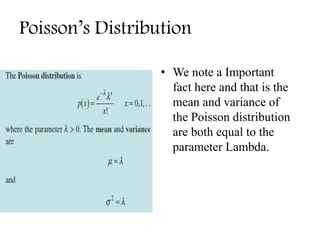


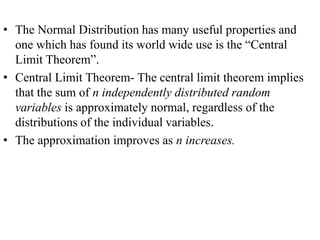
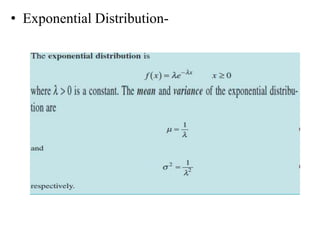


This document discusses different types of probability distributions used in statistics. There are two main types: continuous and discrete distributions. Continuous distributions are used when variables are measured on a continuous scale, while discrete distributions are used when variables can only take certain values. Some important continuous distributions mentioned are the normal, lognormal, and exponential distributions. Important discrete distributions include the binomial, hypergeometric, and Poisson distributions. Key terms like mean, variance, and standard deviation are also defined. Examples are provided to illustrate how these probability distributions are applied in fields like quality control and reliability engineering.


![Attack surfaces and attack tress[inform]](https://cdn.slidesharecdn.com/ss_thumbnails/lecture03-260108015941-a4dee53b-thumbnail.jpg?width=640&height=640&fit=bounds)

