Download as PDF, PPTX


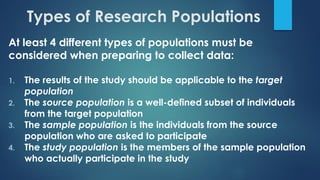
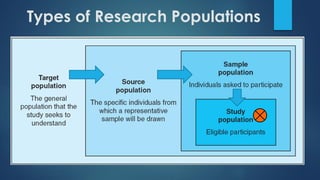
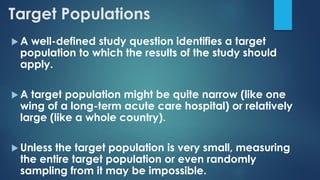
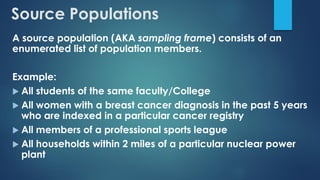
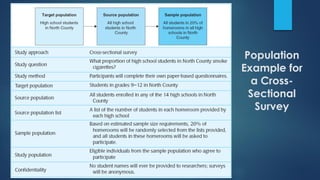


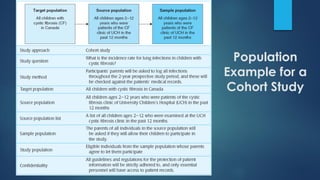

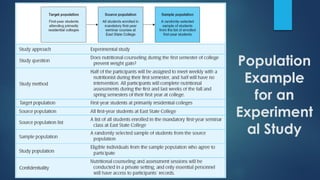

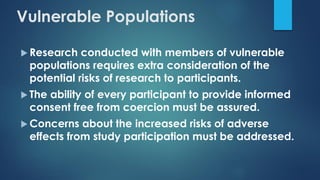


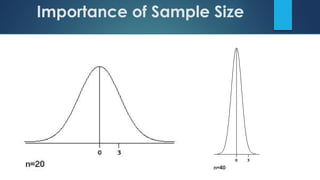

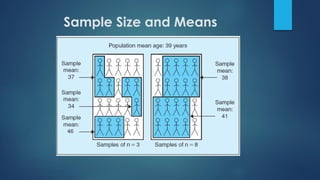

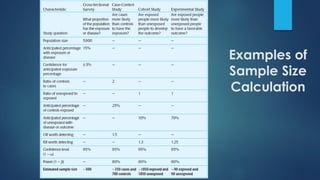
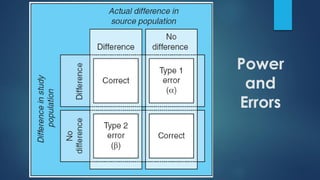


This document discusses population sampling methods for healthcare research. It defines target, source, sample, and study populations and provides examples of each. Several types of probability sampling techniques are mentioned. Vulnerable populations require extra consideration in research due to increased risks. Sample size is important, as larger samples better reflect the true population and provide more statistical power. Sample size calculators can estimate appropriate sample sizes based on study design and expected population characteristics. Statistical power must be considered to ensure sample sizes are large enough to detect real effects if present. The study approach may need revising if power is insufficient.