Download as PDF, PPTX


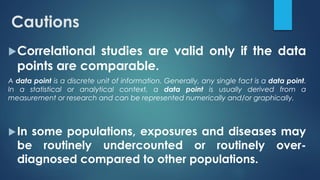
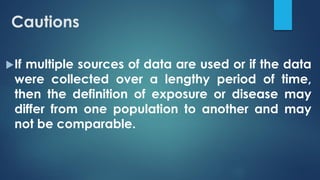

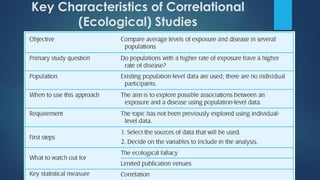


The document provides an overview of correlational studies, detailing their methodology, data management, analysis techniques, and the importance of using population-level data to study relationships between exposures and disease outcomes. It emphasizes the need for representative populations in cross-sectional surveys and cautions against the ecological fallacy when interpreting group data. Key statistical methods such as Pearson and Spearman correlation coefficients are outlined for analyzing the strength and direction of associations.


