SlideShare a Scribd company logo
1 of 110
Measure of association in case controls study
• The measure of association in case control study is Odds
Ratio(OR)
OR
4/7/2024
=
odds of disease in exposed
odds of disease in unexposed
Measure of association…con
Odds = the chances of something happening
the chances of it not happening
4/7/2024
Measure of association…cont
OR= ad/bc
If OR=1, it is null hypothesis
If OR>1, the exposure is a risk factor
If OR<1, the exposure is protective
4/7/2024
Cohort study
• A group of persons
– sharing the same experience
– followed for a specified period of time
• Examples
– birth cohort
– workers at a chemical industry
– graduating university class
– Attendants of this course
Cohort Studies
• Disease free exposed and non-exposed people
are followed up and then outcome events are
picked up when they occur
• Measure and compare the incidence of disease
in two or more study cohorts
• Usually prospective or forward looking.
• Some times also called longitudinal studies.
Disease among
exposed?
Disease among non-
exposed?
Usually prospective
Cohort study
Population
at risk
Exposed
Not Exposed
Types of Cohort Studies
• Based on the starting point of the study
• Prospective: Healthy cohort (free of the disease)
assembled and followed. More reliable than
retrospective
• Retrospective (historical): the study is initiated at a
point in time after both the exposure and disease have
already occurred.
• It is constructed retrospectively through existing records
Prospective Cohort Study
+
-
ill well
Health
exp
+
-
exp
Disease
occurrence
Study starts
Exposure
occurrence
Prospective assessment
of disease
Selection based
on exposure
Retrospective Cohort Study
Study
takes place
Disease
occurrence
Exposure
occurrence
Retrospective assessment
of exposure and disease
+
-
+ -
ill
exp
Advantages of cohort studies
• Directly measure risk or rate
• Temporal r/s between exposure & disease is clear
• Less susceptible to selection bias because outcome not
known
• Well suited to rare exposures
• Several outcomes can be examined in one study
Disadvantages of cohort studies
• Large sample size
• Longer latency period
• Loss to follow up
• Exposure can change over time
• It difficult to assess multiple exposures
• Expensive and Time consuming
Measures of association in Cohort Studies
Diseased
Not
Disease Total
Incidence Rates of
Disease
Exposed a b a + b a/a + b
Not
Exposed
c d c + d c/c + d
4/7/2024
Cont’d
• Relative Risk (RR) = Iexp / Inon-exp
= [a/(a+b)] / [c/(c+d)]
4/7/2024
Experimental/Intervention Studies
• Investigator assigns subjects to exposure and
non-exposure and makes follow up to measure
for the occurrence of a disease/ out come of
interest
o It is usually prospective.
o Provides high quality data
o Random allocation
Source: partially adapted from WHO, 1993
Design of an Experimental Study
Investigator
determines
exposure status
When to choose an experimental design?
• When:
–the research question cannot be answered by
observational studies
–earlier observational studies have not
answered the research question
–existing knowledge is not sufficient to
determine clinical or public health policy
–an experiment is likely to provide an
important extension of this knowledge
Types of Experimental Studies
• Randomized Clinical Trial (RCT)
Randomized Clinical Trial (RCT)
• Randomization is done on individuals
– Each subject is given an equal chance of being assigned to
either treatment or control group.
Blinding
• Double-blind = Neither the participants nor the investigators
responsible for outcome assessment, know the group to which
participant has been assigned
• Single-blind = The investigator alone is aware of the groups to
which participant has been assigned
Direction of inquiry
Manipulation
Problems of Intervention Studies
• More difficult to design and conduct
• Ethical issues
– Withholding
– Exposing
• Feasibility
– Very large sample size required
• Cost
– Very expensive
Advantages of Intervention Studies
• GOLD STANDARD = Randomized, placebo
controlled, blinded clinical trials
• The ability to assign exposure
• The ability to control confounding
• Findings can be replicated = Generalizability
The hierarchy of epidemiological research
Methods… Study Design
Which study design to use depends on:
The research question to be answered
The resource and research facilities available
Any study design has its own strength and
limitation
Some research questions can be answered by
using different designs
23
Sampling methods and
Sample size determination
• After knowing whom to involve in study,
researcher need how to identify subjects and
how many of them to involve in the study
24
Sample Size
• Sample Size: The number of study subjects
selected to represent a given study
population.
• Sample size should be sufficient to represent
the characteristics of interest of the study
population.
• Common questions:
– “How many subjects should I study?”
25
When deciding on sample size:
∆
Sample size = Precision = Cost
PRECISION COST
26
Sample Size: One Variable
n=sample size
s or σ = standard deviation
d=desired precision
27
Estimation of Single mean
28
• Suppose that for a certain group of cancer
patients, we are interested in estimating the
mean age of diagnosis. We would like a 95% CI
of 5 years wide. If the population SD is 12 years,
how large should our sample be?
29
• Suppose d=1
• Then the sample size increases
30
Methods… Sample Size Determination
Single Population Proportion
In order to calculate the required sample size, you need to
know the following facts for proportion
Previous prevalence or proportion of the problem (p), If
you cannot guess the proportion, take it as 50%.
Allowable margin of error (d) (1% -5% )- deviate from the
true proportion in the population as a whole.
Level confidence interval (95% or 99% )
The size of the population that the sample has to
represent
31
Estimation of Single Proportion
32
• Suppose that you are interested to know the
proportion of infants who breastfed >18 months
of age in a rural area. Suppose that in a similar
area, the proportion (p) of breastfed infants was
found to be 0.20. What sample size is required to
estimate the true proportion within ±3% with
95% confidence. Let p=0.20, d=0.03, α=5%
33
• Suppose there is no prior information about
the proportion who breastfeed
• Assume p=q=0.5 (most conservative)
• Then the required sample size increases
34
• If you studied more than two dependent
variable you have use the variable which can
give maximum sample size
• Using software ( Epi info)
35
36
Methods…Sampling Techniques
What is sampling?
Why we need to use sampling?
Sampling
• The process of selecting a portion of the population
to represent the entire population.
• A main concern in sampling:
– Ensure that the sample represents the population, and
– The findings can be generalized.
A representative sample: has all the important
characteristics of the population from which it is
drawn
Advantages of sampling:
• Feasibility: Sampling may be the only feasible method
of collecting information.
• Reduced cost: Sampling reduces demands on resource
such as finance, personnel, and material.
• Greater accuracy: Sampling may lead to better accuracy
(quality) of collecting data
• Greater speed: Data can be collected and summarized
more quickly (time saving)
Disadvantages of sampling:
• There is always a sampling error.
• Sampling may create a feeling of discrimination
within the population.
Sampling Methods
Two broad divisions:
A. Non-probability sampling methods
B. Probability sampling methods
A. Non-probability sampling
• In non-probability sampling, every subjects has an
unknown chance of being selected.
• There is an assumption that there is an even
distribution of a characteristic of interest within the
population.
• Despite these drawbacks, non-probability
sampling methods can be useful when
descriptive comments about the sample itself
are desired.
• Secondly, they are quick, inexpensive and
convenient.
• There are also other circumstances, such as in
researches, when it is unfeasible or impractical
to conduct probability sampling.
The most common types of non-
probability sampling
1. Convenience sampling
2. Quota sampling
3. Judgment sampling
4. Snow ball sampling
1. Convenience Sampling
• For convenience, the study units that are available
easily and conveniently at the time of data collection
are selected
• Many clinic-based studies
• The advantage is that the method is easy to use, but
that advantage is greatly offset by the presence of bias.
2. Quota sampling
• This is one of the most common forms of non-
probability sampling.
• Sampling is done until a specific number of units
(quotas) for different categories of populations
have been selected.
• It is really a means for satisfying sample size
objectives for certain sub-populations.
• The main argument against quota sampling is that
it does not meet the basic requirement of
randomness.
• Some units may have no chance of selection or
the chance of selection may be unknown.
B. Probability sampling
• Involves random selection of a sample
• A sample is obtained in a way that ensures
every member of the population to have a
known, non zero probability of being included
in the sample.
• Selection of a sample from a population, based
on chance.
• Probability sampling is:
– more complex,
– more time-consuming and
– usually more costly than non-probability
sampling.
• However, because study samples are
randomly selected and their probability of
inclusion can be calculated,
– reliable estimates can be produced and
– inferences can be made about the population.
Most common probability
sampling methods
1. Simple random sampling
2. Systematic random sampling
3. Stratified random sampling
4. Cluster sampling
5. Multi-stage sampling
1. Simple random sampling
• Involves random selection
• Each member of a population has an equal
chance of being included in the sample.
• To use a SRS method:
– Make a numbered list of all the units in the
population
– Each unit should be numbered from 1 to N (where
N is the size of the population)
– Select the required number.
The randomness of the sample is ensured by:
•use of “lottery’ methods
•a table of random numbers
•Computer programs
Example
• Suppose your school has 500 students and
you need to conduct a short survey on the
quality of the food served in the cafeteria.
• You decide that a sample of 10 students
should be sufficient for your purposes.
• In order to get your sample, you assign a
number from 1 to 500 to each student in
your school.
• To select the sample, you use a table of
randomly generated numbers.
• Pick a starting point in the table (a row and
column number) and look at the random
numbers that appear there. In this case, since
the data run into three digits, the random
numbers would need to contain three digits as
well.
• Ignore all random numbers after 500 because
they do not correspond to any of the students in
the school.
• Remember that the sample is without
replacement, so if a number recurs, skip over it
and use the next random number.
• The first 10 different numbers between 001 and
500 make up your sample.
• SRS has certain limitations:
– Requires a sampling frame.
– Difficult if the reference population is dispersed.
– Minority subgroups of interest may not be
selected.
2. Systematic random sampling
• Sometimes called interval sampling,-
means that there is a gap, or interval,
between each selected unit in the
sample
• The selection is systematic rather than
randomly
• Important if the reference population is
arranged in some order
• Taking individuals at fixed intervals (every kth)
called sampling fraction,
Steps in systematic random sampling
1. Number the units frame from 1 to N (where N is the
total population size).
2. Determine the sampling interval (K) by dividing the
number of units in the population for the desired
sample size
3. Select the first number included in your sample
between one and K at random.
4. Select every Kth unit after that first number
Note: Systematic sampling should not be used when a
cyclic repetition is inherent in the sampling frame.
k=N/n (N-total &n-sample population)
3. Stratified random sampling
• It is done when the population is known to have
heterogeneity with regard to some factors and those factors
are used for stratification
• A population can be stratified by any variable prior to
sampling (e.g., age, sex, province of residence, income, etc.).
• Using stratified sampling, the population is divided into
homogeneous, mutually exclusive groups called strata
• A separate sample is taken independently from each stratum.
• Any of the sampling methods mentioned in this section (and
others that exist) can be used to sample within each stratum.
• Ensures an adequate sample size for sub-groups
• Each stratum is an independent population and you will
need to decide the sample size for each stratum
• Equal allocation:
– Allocate equal sample size to each stratum
• Proportionate allocation:
, j = 1, 2, ..., k where, k is
the number of strata and
– nj is sample size of the jth stratum
– Nj is population size of the jth stratum
– n = n1 + n2 + ...+ nk is the total sample size
– N = N1 + N2 + ...+ Nk is the total population
size
n
n
N
N
j j

4. Cluster sampling
• Sometimes it is too expensive to spread a sample
across the population as a whole.
• To reduce costs, researchers may choose a cluster
sampling technique
• The clusters should be homogeneous, unlike
stratified sampling where by the strata are
heterogeneous
Steps in cluster sampling
• Cluster sampling divides the population into groups
or clusters.
• A number of clusters are selected randomly to
represent the total population, and then all units
within selected clusters are included in the sample.
Example
• In a school-based study, we assume students of the
same school are homogeneous.
• We can select randomly sections and include all
students of the selected sections only
5. Multi-stage sampling
• Similar to the cluster sampling, except that it involves
picking a sample from within each chosen cluster,
rather than including all units in the cluster. This
type of sampling requires at least two stages.
• First stage, large groups or clusters are identified and
selected. These clusters contain more population
units than needed
• Second stage, population units are picked from the
selected clusters (using any of sampling methods) for
a final sample.
• No need to have a list of all of the units in the
population.
• All you need is a list of clusters and list of the units in
the selected clusters.
• Multi-stage sampling saves a great amount of time and
effort by not having to create a list of all the units in a
population.
Data Collection
Data collection techniques –it is a techniques which allows
us to systematically collect information
• Using available information (record review)
• Observation
• Interview
• Administering written questionnaires
• Focus Group Discussions
• Other data collection methods
65
1. Using available data
• Morbidity reports
• Mortality reports
• Epidemic reports
• Epidemic investigations
• Laboratory data
• Special surveys
• Demographic data (census)
66
Sources of available data
• Health facilities
– Health center, hospital
• Immunization
• Childhood diseases
• MCH clinics
• etc
67
Advantage
• Collection is inexpensive
Disadvantage
• May not always be complete and precise
68
2. Observation
• Involves systematically selecting, watching,
and recording behavior and characteristics.
• Checklists or a list of question are usually
used.
• It is simply observing some health care
practice with out intervention/ interuption
69
3. Interviewing
• Involves oral questioning of respondents, either
individually or as a group.
• Answers are recorded by writing or by tape
recording the responses.
• Two types interview
– Face-to-face interview
– Telephone interview
70
4. Administering written questionnaires
• Also known as self-administered questionnaire
• Written questions are presented to be
answered by the respondents in written form.
5. Focus group discussions (FGDs)
 A group discussion on a specific topic and it is
used for qualitative data.
71
Bias in data collection and its possible causes
• BIAS is a distortion which results in the
information not being representative of the
true situation.
72
Possible sources of bias
1. Defective instruments - Poorly designed
questionnaires/tools
• Can be avoided by careful planning of the data
collection process and by pre-testing the data
collection tools
2. Observer bias- Related to data collectors
3. Selection bias
• High refusal rate
• Participants are self-selected
73
4. Information bias
• Poor recording, poor data extraction
• Incomplete data
• Recall (or memory) bias
5. Effect of the interviewer on the informant
– Informant may mistrust the interview
– Misleading answers
74
Variables
• Variables: is a characteristic of a person,
object or phenomenon on which observation
or measurement is made.
– Weight, height, age, income, etc., all are variables
• Qualitative Vs Quantitative Variables
75
Types of Variables
→Numerical and categorical
• Numerical: Information is measured by
assigning numbers
We can also divided numerical/quantitative
variable in to two:
• Discrete data and Continuous data/variable
Numerical Variables
a. Discrete variable: when numbers represent actual
measurable quantities rather than mere labels.
• Discrete data are restricted to taking only specified
values often integers or counts that differ by fixed
amounts.
e.g. Number of new AIDS cases reported during one year period,
– Number of beds available in a particular hospital
b. Continuous variable: represent measurable
quantities but are not restricted to taking on
certain specific values i.e. fractional values are
possible
 e.g. weight, cholesterol level, time, temperature
Categorical Variables …
• Categorical/Qualitative variable: Information is
measured by assigning names to items (events)
according to a set of rules, which result on
different types of data.
 two types: Nominal and ordinal
E.g.. Gender, blood group, Marital status
Dependent and independent variables …
• The variable that is used to describe or measure
the problem under study is called the dependent
variable.
• The variables that are used to describe or measure
the factors that are assumed to influence (or cause)
the problem are called independent variables.
Variables …
• For example, in a study of relationship between
smoking and lung cancer, "suffering from lung
cancer" (with the values yes, no) would be the
dependent variable and "smoking" (with the values
no, less than a packet/day, 1 to 2 packets/day, more
than 2 packets/day) would be the independent
variable.
Background variables
• In almost every study involving human
subjects, background variables, such as, age,
sex, educational status, monthly family
income, marital status and religion will be
included.
• These background variables are often related
to a number of independent variables, so that
they influence the problem indirectly.
• Hence they are called background variables or
background characteristics.
Example
A relationship is shown between the low level of
the mother’s education and malnutrition in
under 5s. However, family income may be
related to the mother’s education as well as to
malnutrition
Confounding variable:
• Relationship between low level of mother’s
education and malnutrition in under five
children
Mother’s
Education
(Independent)
Malnutrition
Dependent
Family Income
(Confounding
Variable)
83
Operationalizing variables
• Operationalizing variables means that you make
them ‘measurable'.
• Example: In a study on VCT acceptance, you
want to determine the level of knowledge
concerning HIV in order to find out to what
extent the factor ‘poor knowledge’ influences
willingness to be tested for HIV.
Cont’d
• The variable ‘level of knowledge’ cannot be
measured as such.
• You would need to develop a series of
questions to assess a person’s knowledge
• The answers to these questions form an
indicator of someone’s knowledge on this issue,
which can then be categorized.
Cont’d …
If 10 questions were asked, you might decide
that the knowledge of those with:
• 0 to 3 correct answers is poor,
• 4 to 6 correct answers is reasonable, and
• 7 to 10 correct answers is good.
To operationalize variables of interest: we use
Existing measures
Observation
Self report
Con…
• To ensure that everyone understands exactly
what has been measured and to ensure that
there will be consistency in the measurement
Cont’d …
E.g. “waiting time”
e.g. Is it when the patient enters the front door, or
when he has been registered and obtained his card?
Cont’d …
Operational definitions of variables are
used in order to:
• Avoid ambiguity
• Make the variables to be more
measurable
Questionnaire Design
Questionnaire(tools) is the set of questions
for obtaining information from respondents.
Respondents should able to Answer the
Question?
–may not remember(recall bias)
–may not understand the concepts of the item
used
–may feel too much effort involved
–The information requested is too sensitive(
social desirability bias). 90
What Should be the Structure of the Question?
• A question may be:-
A. Unstructured (open-ended) questions- that respondents answer in
their own words
o Completely unstructured - EX “What is your opinion of contraceptive use?”
o Sentence completion - Respondents complete an incomplete
sentence. For example,
“The most important consideration in my decision to use contraceptives is __________
Disadvantages
• some respondents give answers not relevant to your objective
• Time taking especially for large sample size
• Difficult for data processing and analysis
91
Questionnaires cont…
B. Structured(closed-ended)questions- specify the set of responses
 Yes/no questions: The respondent answers with “yes” or “no”.
 Multiple choice : The respondent has several options
 Scaled questions: Responses are graded on a continuum (example :
rate on a scale from 1 to 5, with 5 being the most preferred).
o Common types of scales is the Likert scale
Constructing closed ended questions
• Include all possible responses that might be expected
• Mutually exclusive
• Describe in cases might want to solicit multiple answers
92
• Hypothetical constructs:-Some variables are hypothetical
constructs,
– E.g. knowledge, behavior can be measured to some
degree indirectly.
Disadvantages
• Some might over look some important items
• Might have multiple answers
93
How can questions are wording properly
1. Define the issue ( in terms of who, what,
when, where, why, and how (the six Ws).
2. Use ordinary words
3. Avoid ambiguous words
4. Avoid leading questions
5. Avoid calculations
94
What Is the Proper Order of Questions?
• Questions should be asked in a logical order
– The opening questions should be interesting, simple, and
nonthreatening.
– Basic information should be obtained first,
– Difficult, sensitive, or complex questions should be placed late in
the sequence.
– General questions should precede specific questions.
Every questionnaire, should contain clear instructions and
introductory comments where appropriate
• Clear, specific and Precise
– E.g. What kind of home do you have? (Not clear)
– E.g. How far is the nearest health institution from your
home? (Not specific) 95
96
Pre-testing and pilot study
• A pre-test usually refers to a small-scale trail of a particular
research component.
• A pilot is the process of caring out the preliminary study, going
through the entire research procedure with the small sample
size.
• Important to identify potential problems in the proposed study.
 It enables to make some revision if necessary before actual data
collection.
 Money, time and manpower can be saved.
 Even the best questionnaire can be improved by pretesting.
• As a general rule, a questionnaire should not be used in the field
without extensive pretesting.
• The pretest groups should be similar to the respondents
• It is done out the actual study site
97
Plan for Data Processing and Analysis
• Data processing plan should involve:
– Checks: Completeness and internal consistency
checked again and can be corrected
• If too many portions data (>20%) left incomplete entire
questionnaire may be omitted
 Care must be taken on deciding to do so because this
threatens the validity of the study
• Inconsistent responses: check from interviewer, if due
to recording; correct the response, if not go to
respondent to clarify
98
Plan for data processing and analysis
Data Processing
 Categorizing the data
 Coding and recoding
 Summarizing of the data
Data analysis
 Determine frequency count
The first activity of analysis
 Cross tabulation
• Combines information on two or
more variables
Research Ethics
Ethics – is the branch of philosophy that deals
with distinctions between right and wrong-
with the moral consequences of human
actions.
99
Historical Perspectives cont…
The Common Rule requires:
• Prior ethics committee approval
• Written informed consent and documentation
• Equitable recruitment of research participants
• Special protection for vulnerable groups
100
Principles of Research Ethics
1. Respect for persons/autonomy
- a norm of respecting the decision-making
capacities of autonomous persons
2. Beneficence
-a group of norms for providing benefits and
balancing benefits against risks and costs
3. Justice
- a group of norms for distributing benefits, risks,
and costs fairly
4. Non-malfeasance : avoiding and preventing harm in
all person
5. Confidentiality : keeping the sensetive issues/secrets
of the study participants
101
Informed Consent
• Definition -consent given by a competent
individual who:
– has received the necessary information
– has adequately understood the information
– after considering the information, has arrived at a
decision without having been subjected to
coercion, undue influence or inducement.”
102
Informed Consent cont…
Essential Elements of Informed Consent
1) Description of the research objectives and purposes
2) Description of reasonably foreseeable risks
3) Description of expected benefits
4) Potentially advantageous alternatives to participation
5) Explanation of confidentiality
6) Whom to contact about the research and participants’ rights
7) Explanation that participation is voluntary
103
Plagiarism
• Plagiarism - is the use or close imitation of the
language and thoughts of another author and
the representation of them as one's own
original work
104
Work plan and Budget breakdown
WORK PLAN:- Display each activity that is necessary to successfully implement
the research project together with the responsible person and the time
needed for accomplishing each activity)
• Work plan summarizes (in a table, chart, graph) the various components of a
research project and how they fit together.
• Includes:
– Tasks to be performed
– When the task will be performed
– Who will perform the task
• Ways of presenting a work plan
• Work schedule
• GANNT chart
105
Work plan cont..
The Work Schedule
• Is a table
• Summarizes:
– tasks to be performed
– duration of each activity, and
– Included the responsible body.
106
Work plan cont..
The GANTT Chart
• Is a planning tool which describes graphically the order in which
various tasks must be completed and their duration of activity.
A typical Gantt chart includes the following information:
• The tasks to be performed
• Who is responsible for each task; and
• The time each task is expected to take.
• The length of each task is shown by a bar that extends over the
number of days, weeks or months the task is expected to take.
• The Gantt chart doesn’t show how various tasks are related.
107
GANTT Chart cont…
Activity Time (2016)
Octob Nov Dec Jan Feb
Activity 1
Activity 2
Activity 3
Activity 4
Activity 5
Budget
How should a budget be prepared?
• It is necessary to use the work plan as a starting point.
• Specify, for each activity in the work plan, what resources
are required.
• Determine for each resource needed the unit cost and the
total cost.
• The budget for the fieldwork component of the work plan will
include funds for personnel, transport and supplies.
The Budget Format
• The type of budget format to be used may vary
• Most donor organizations have their own special project
forms, which include a budget format.
109
Thank you for your attention
110

More Related Content

Similar to Research Methods 2 for Midwifery students .pptx

Similar to Research Methods 2 for Midwifery students .pptx (20)

AAU. Chapter.5 Sampling Methods.pptx
AAU. Chapter.5 Sampling Methods.pptxAAU. Chapter.5 Sampling Methods.pptx
AAU. Chapter.5 Sampling Methods.pptx
 
UPDATED-Quantitative-Methods for Prelims
UPDATED-Quantitative-Methods for PrelimsUPDATED-Quantitative-Methods for Prelims
UPDATED-Quantitative-Methods for Prelims
 
An overview of sampling
An overview of samplingAn overview of sampling
An overview of sampling
 
An overview of sampling
An overview of samplingAn overview of sampling
An overview of sampling
 
Study Session 15.pptx
Study Session 15.pptxStudy Session 15.pptx
Study Session 15.pptx
 
Sampling
SamplingSampling
Sampling
 
Sampling methodologies in research mrhod
Sampling methodologies in research mrhodSampling methodologies in research mrhod
Sampling methodologies in research mrhod
 
Sample and sampling techanique
Sample and sampling techaniqueSample and sampling techanique
Sample and sampling techanique
 
chapter_5.ppt
chapter_5.pptchapter_5.ppt
chapter_5.ppt
 
Methods.pdf
Methods.pdfMethods.pdf
Methods.pdf
 
Data collection
Data collectionData collection
Data collection
 
PPT Sampling editggggggggggggghhhhhh 1.pptx
PPT Sampling editggggggggggggghhhhhh 1.pptxPPT Sampling editggggggggggggghhhhhh 1.pptx
PPT Sampling editggggggggggggghhhhhh 1.pptx
 
STUDY DESIGNS.ppt
STUDY DESIGNS.pptSTUDY DESIGNS.ppt
STUDY DESIGNS.ppt
 
Chapter 6 Selecting a Sample
Chapter 6 Selecting a SampleChapter 6 Selecting a Sample
Chapter 6 Selecting a Sample
 
Sampling
SamplingSampling
Sampling
 
Understanding Clinical Trials
Understanding Clinical TrialsUnderstanding Clinical Trials
Understanding Clinical Trials
 
Research process and sampling
Research process and samplingResearch process and sampling
Research process and sampling
 
5.Sampling_Techniques.pptx
5.Sampling_Techniques.pptx5.Sampling_Techniques.pptx
5.Sampling_Techniques.pptx
 
Chapter 34 medical stat
Chapter 34 medical statChapter 34 medical stat
Chapter 34 medical stat
 
research sampling DR.RANGAPPA.S. ASHI ASSOCIATE Professor SDM institute of nu...
research sampling DR.RANGAPPA.S. ASHI ASSOCIATE Professor SDM institute of nu...research sampling DR.RANGAPPA.S. ASHI ASSOCIATE Professor SDM institute of nu...
research sampling DR.RANGAPPA.S. ASHI ASSOCIATE Professor SDM institute of nu...
 

More from Endex Tam

New Abortion care guidelines of 2022.pdf
New Abortion care guidelines of 2022.pdfNew Abortion care guidelines of 2022.pdf
New Abortion care guidelines of 2022.pdfEndex Tam
 
Research Methology for midwifery students .pptx
Research Methology for midwifery students .pptxResearch Methology for midwifery students .pptx
Research Methology for midwifery students .pptxEndex Tam
 
essenial newborn care for Mw students .pptx
essenial newborn care for Mw students .pptxessenial newborn care for Mw students .pptx
essenial newborn care for Mw students .pptxEndex Tam
 
Diseases of the central nervous system.pptx
Diseases of the central nervous system.pptxDiseases of the central nervous system.pptx
Diseases of the central nervous system.pptxEndex Tam
 
2. Neurologic disorder/health assessment.ppt
2. Neurologic disorder/health assessment.ppt2. Neurologic disorder/health assessment.ppt
2. Neurologic disorder/health assessment.pptEndex Tam
 
21-02_summary-of-the-verification-toolkit_11nov2021.pptx
21-02_summary-of-the-verification-toolkit_11nov2021.pptx21-02_summary-of-the-verification-toolkit_11nov2021.pptx
21-02_summary-of-the-verification-toolkit_11nov2021.pptxEndex Tam
 
HepB BD Experiences-Countries Planning BD Introduction_29-4-2021_final_04.05....
HepB BD Experiences-Countries Planning BD Introduction_29-4-2021_final_04.05....HepB BD Experiences-Countries Planning BD Introduction_29-4-2021_final_04.05....
HepB BD Experiences-Countries Planning BD Introduction_29-4-2021_final_04.05....Endex Tam
 
Tubal Sterilization for midwifery students(1).pptx
Tubal Sterilization for midwifery students(1).pptxTubal Sterilization for midwifery students(1).pptx
Tubal Sterilization for midwifery students(1).pptxEndex Tam
 
HIVTestingAlgorithmFourthGenerationScreeningAssayIncludingFollowupofReactiveH...
HIVTestingAlgorithmFourthGenerationScreeningAssayIncludingFollowupofReactiveH...HIVTestingAlgorithmFourthGenerationScreeningAssayIncludingFollowupofReactiveH...
HIVTestingAlgorithmFourthGenerationScreeningAssayIncludingFollowupofReactiveH...Endex Tam
 
Female Internal Genital organs 2018 (1).pdf
Female Internal Genital organs  2018 (1).pdfFemale Internal Genital organs  2018 (1).pdf
Female Internal Genital organs 2018 (1).pdfEndex Tam
 
Pelvis-Bony pelvis and soft tissue anatomy(1).pdf
Pelvis-Bony pelvis and soft tissue anatomy(1).pdfPelvis-Bony pelvis and soft tissue anatomy(1).pdf
Pelvis-Bony pelvis and soft tissue anatomy(1).pdfEndex Tam
 
CESAREAN SECTION (1) for midwifery students.pptx
CESAREAN SECTION (1) for midwifery students.pptxCESAREAN SECTION (1) for midwifery students.pptx
CESAREAN SECTION (1) for midwifery students.pptxEndex Tam
 
Normal physiology of labour and delivery .pptx
Normal physiology of labour and delivery .pptxNormal physiology of labour and delivery .pptx
Normal physiology of labour and delivery .pptxEndex Tam
 
Abdominal ultrasound for midwifery students .pptx
Abdominal ultrasound for midwifery students .pptxAbdominal ultrasound for midwifery students .pptx
Abdominal ultrasound for midwifery students .pptxEndex Tam
 
normal_puerperium_postnatal for midwifery .ppt
normal_puerperium_postnatal for midwifery .pptnormal_puerperium_postnatal for midwifery .ppt
normal_puerperium_postnatal for midwifery .pptEndex Tam
 
humanmilkstoragebanking1-200902050113.pptx
humanmilkstoragebanking1-200902050113.pptxhumanmilkstoragebanking1-200902050113.pptx
humanmilkstoragebanking1-200902050113.pptxEndex Tam
 
Postnatal care VISITS and normal postpartum .pptx
Postnatal care VISITS and normal postpartum .pptxPostnatal care VISITS and normal postpartum .pptx
Postnatal care VISITS and normal postpartum .pptxEndex Tam
 
normal and abnormal puerperium/postnatal period .pptx
normal and abnormal puerperium/postnatal period .pptxnormal and abnormal puerperium/postnatal period .pptx
normal and abnormal puerperium/postnatal period .pptxEndex Tam
 
IMNCI session 9 Assess and Classify Young Infant.pptx
IMNCI session 9 Assess and Classify Young Infant.pptxIMNCI session 9 Assess and Classify Young Infant.pptx
IMNCI session 9 Assess and Classify Young Infant.pptxEndex Tam
 
Health Assessment ON ABDOMEN (1) for midwifery students.pptx
Health Assessment ON ABDOMEN (1) for midwifery students.pptxHealth Assessment ON ABDOMEN (1) for midwifery students.pptx
Health Assessment ON ABDOMEN (1) for midwifery students.pptxEndex Tam
 

More from Endex Tam (20)

New Abortion care guidelines of 2022.pdf
New Abortion care guidelines of 2022.pdfNew Abortion care guidelines of 2022.pdf
New Abortion care guidelines of 2022.pdf
 
Research Methology for midwifery students .pptx
Research Methology for midwifery students .pptxResearch Methology for midwifery students .pptx
Research Methology for midwifery students .pptx
 
essenial newborn care for Mw students .pptx
essenial newborn care for Mw students .pptxessenial newborn care for Mw students .pptx
essenial newborn care for Mw students .pptx
 
Diseases of the central nervous system.pptx
Diseases of the central nervous system.pptxDiseases of the central nervous system.pptx
Diseases of the central nervous system.pptx
 
2. Neurologic disorder/health assessment.ppt
2. Neurologic disorder/health assessment.ppt2. Neurologic disorder/health assessment.ppt
2. Neurologic disorder/health assessment.ppt
 
21-02_summary-of-the-verification-toolkit_11nov2021.pptx
21-02_summary-of-the-verification-toolkit_11nov2021.pptx21-02_summary-of-the-verification-toolkit_11nov2021.pptx
21-02_summary-of-the-verification-toolkit_11nov2021.pptx
 
HepB BD Experiences-Countries Planning BD Introduction_29-4-2021_final_04.05....
HepB BD Experiences-Countries Planning BD Introduction_29-4-2021_final_04.05....HepB BD Experiences-Countries Planning BD Introduction_29-4-2021_final_04.05....
HepB BD Experiences-Countries Planning BD Introduction_29-4-2021_final_04.05....
 
Tubal Sterilization for midwifery students(1).pptx
Tubal Sterilization for midwifery students(1).pptxTubal Sterilization for midwifery students(1).pptx
Tubal Sterilization for midwifery students(1).pptx
 
HIVTestingAlgorithmFourthGenerationScreeningAssayIncludingFollowupofReactiveH...
HIVTestingAlgorithmFourthGenerationScreeningAssayIncludingFollowupofReactiveH...HIVTestingAlgorithmFourthGenerationScreeningAssayIncludingFollowupofReactiveH...
HIVTestingAlgorithmFourthGenerationScreeningAssayIncludingFollowupofReactiveH...
 
Female Internal Genital organs 2018 (1).pdf
Female Internal Genital organs  2018 (1).pdfFemale Internal Genital organs  2018 (1).pdf
Female Internal Genital organs 2018 (1).pdf
 
Pelvis-Bony pelvis and soft tissue anatomy(1).pdf
Pelvis-Bony pelvis and soft tissue anatomy(1).pdfPelvis-Bony pelvis and soft tissue anatomy(1).pdf
Pelvis-Bony pelvis and soft tissue anatomy(1).pdf
 
CESAREAN SECTION (1) for midwifery students.pptx
CESAREAN SECTION (1) for midwifery students.pptxCESAREAN SECTION (1) for midwifery students.pptx
CESAREAN SECTION (1) for midwifery students.pptx
 
Normal physiology of labour and delivery .pptx
Normal physiology of labour and delivery .pptxNormal physiology of labour and delivery .pptx
Normal physiology of labour and delivery .pptx
 
Abdominal ultrasound for midwifery students .pptx
Abdominal ultrasound for midwifery students .pptxAbdominal ultrasound for midwifery students .pptx
Abdominal ultrasound for midwifery students .pptx
 
normal_puerperium_postnatal for midwifery .ppt
normal_puerperium_postnatal for midwifery .pptnormal_puerperium_postnatal for midwifery .ppt
normal_puerperium_postnatal for midwifery .ppt
 
humanmilkstoragebanking1-200902050113.pptx
humanmilkstoragebanking1-200902050113.pptxhumanmilkstoragebanking1-200902050113.pptx
humanmilkstoragebanking1-200902050113.pptx
 
Postnatal care VISITS and normal postpartum .pptx
Postnatal care VISITS and normal postpartum .pptxPostnatal care VISITS and normal postpartum .pptx
Postnatal care VISITS and normal postpartum .pptx
 
normal and abnormal puerperium/postnatal period .pptx
normal and abnormal puerperium/postnatal period .pptxnormal and abnormal puerperium/postnatal period .pptx
normal and abnormal puerperium/postnatal period .pptx
 
IMNCI session 9 Assess and Classify Young Infant.pptx
IMNCI session 9 Assess and Classify Young Infant.pptxIMNCI session 9 Assess and Classify Young Infant.pptx
IMNCI session 9 Assess and Classify Young Infant.pptx
 
Health Assessment ON ABDOMEN (1) for midwifery students.pptx
Health Assessment ON ABDOMEN (1) for midwifery students.pptxHealth Assessment ON ABDOMEN (1) for midwifery students.pptx
Health Assessment ON ABDOMEN (1) for midwifery students.pptx
 

Recently uploaded

❤️♀️@ Jaipur Call Girls ❤️♀️@ Meghna Jaipur Call Girls Number CRTHNR Call G...
❤️♀️@ Jaipur Call Girls ❤️♀️@ Meghna Jaipur Call Girls Number CRTHNR   Call G...❤️♀️@ Jaipur Call Girls ❤️♀️@ Meghna Jaipur Call Girls Number CRTHNR   Call G...
❤️♀️@ Jaipur Call Girls ❤️♀️@ Meghna Jaipur Call Girls Number CRTHNR Call G...Gfnyt.com
 
Dehradun Call Girls Service 08854095900 Real Russian Girls Looking Models
Dehradun Call Girls Service 08854095900 Real Russian Girls Looking ModelsDehradun Call Girls Service 08854095900 Real Russian Girls Looking Models
Dehradun Call Girls Service 08854095900 Real Russian Girls Looking Modelsindiancallgirl4rent
 
Call Girl Raipur 📲 9999965857 ヅ10k NiGhT Call Girls In Raipur
Call Girl Raipur 📲 9999965857 ヅ10k NiGhT Call Girls In RaipurCall Girl Raipur 📲 9999965857 ヅ10k NiGhT Call Girls In Raipur
Call Girl Raipur 📲 9999965857 ヅ10k NiGhT Call Girls In Raipurgragmanisha42
 
Bangalore call girl 👯‍♀️@ Simran Independent Call Girls in Bangalore GIUXUZ...
Bangalore call girl  👯‍♀️@ Simran Independent Call Girls in Bangalore  GIUXUZ...Bangalore call girl  👯‍♀️@ Simran Independent Call Girls in Bangalore  GIUXUZ...
Bangalore call girl 👯‍♀️@ Simran Independent Call Girls in Bangalore GIUXUZ...Gfnyt
 
VIP Call Girl Sector 32 Noida Just Book Me 9711199171
VIP Call Girl Sector 32 Noida Just Book Me 9711199171VIP Call Girl Sector 32 Noida Just Book Me 9711199171
VIP Call Girl Sector 32 Noida Just Book Me 9711199171Call Girls Service Gurgaon
 
Call Girls Hyderabad Just Call 9907093804 Top Class Call Girl Service Available
Call Girls Hyderabad Just Call 9907093804 Top Class Call Girl Service AvailableCall Girls Hyderabad Just Call 9907093804 Top Class Call Girl Service Available
Call Girls Hyderabad Just Call 9907093804 Top Class Call Girl Service AvailableDipal Arora
 
❤️♀️@ Jaipur Call Girls ❤️♀️@ Jaispreet Call Girl Services in Jaipur QRYPCF ...
❤️♀️@ Jaipur Call Girls ❤️♀️@ Jaispreet Call Girl Services in Jaipur QRYPCF  ...❤️♀️@ Jaipur Call Girls ❤️♀️@ Jaispreet Call Girl Services in Jaipur QRYPCF  ...
❤️♀️@ Jaipur Call Girls ❤️♀️@ Jaispreet Call Girl Services in Jaipur QRYPCF ...Gfnyt.com
 
Punjab❤️Call girls in Mohali ☎️7435815124☎️ Call Girl service in Mohali☎️ Moh...
Punjab❤️Call girls in Mohali ☎️7435815124☎️ Call Girl service in Mohali☎️ Moh...Punjab❤️Call girls in Mohali ☎️7435815124☎️ Call Girl service in Mohali☎️ Moh...
Punjab❤️Call girls in Mohali ☎️7435815124☎️ Call Girl service in Mohali☎️ Moh...Sheetaleventcompany
 
VIP Call Girls Sector 67 Gurgaon Just Call Me 9711199012
VIP Call Girls Sector 67 Gurgaon Just Call Me 9711199012VIP Call Girls Sector 67 Gurgaon Just Call Me 9711199012
VIP Call Girls Sector 67 Gurgaon Just Call Me 9711199012Call Girls Service Gurgaon
 
Call Girls Service Faridabad 📲 9999965857 ヅ10k NiGhT Call Girls In Faridabad
Call Girls Service Faridabad 📲 9999965857 ヅ10k NiGhT Call Girls In FaridabadCall Girls Service Faridabad 📲 9999965857 ヅ10k NiGhT Call Girls In Faridabad
Call Girls Service Faridabad 📲 9999965857 ヅ10k NiGhT Call Girls In Faridabadgragmanisha42
 
Call Girl Amritsar ❤️♀️@ 8725944379 Amritsar Call Girls Near Me ❤️♀️@ Sexy Ca...
Call Girl Amritsar ❤️♀️@ 8725944379 Amritsar Call Girls Near Me ❤️♀️@ Sexy Ca...Call Girl Amritsar ❤️♀️@ 8725944379 Amritsar Call Girls Near Me ❤️♀️@ Sexy Ca...
Call Girl Amritsar ❤️♀️@ 8725944379 Amritsar Call Girls Near Me ❤️♀️@ Sexy Ca...Sheetaleventcompany
 
raisen Call Girls 👙 6297143586 👙 Genuine WhatsApp Number for Real Meet
raisen Call Girls 👙 6297143586 👙 Genuine WhatsApp Number for Real Meetraisen Call Girls 👙 6297143586 👙 Genuine WhatsApp Number for Real Meet
raisen Call Girls 👙 6297143586 👙 Genuine WhatsApp Number for Real MeetCall Girls Service
 
Jodhpur Call Girls 📲 9999965857 Jodhpur best beutiful hot girls full satisfie...
Jodhpur Call Girls 📲 9999965857 Jodhpur best beutiful hot girls full satisfie...Jodhpur Call Girls 📲 9999965857 Jodhpur best beutiful hot girls full satisfie...
Jodhpur Call Girls 📲 9999965857 Jodhpur best beutiful hot girls full satisfie...seemahedar019
 
👯‍♀️@ Bangalore call girl 👯‍♀️@ Jaspreet Russian Call Girls Service in Bangal...
👯‍♀️@ Bangalore call girl 👯‍♀️@ Jaspreet Russian Call Girls Service in Bangal...👯‍♀️@ Bangalore call girl 👯‍♀️@ Jaspreet Russian Call Girls Service in Bangal...
👯‍♀️@ Bangalore call girl 👯‍♀️@ Jaspreet Russian Call Girls Service in Bangal...Gfnyt
 
Enjoyment ★ 8854095900 Indian Call Girls In Dehradun 🍆🍌 By Dehradun Call Girl ★
Enjoyment ★ 8854095900 Indian Call Girls In Dehradun 🍆🍌 By Dehradun Call Girl ★Enjoyment ★ 8854095900 Indian Call Girls In Dehradun 🍆🍌 By Dehradun Call Girl ★
Enjoyment ★ 8854095900 Indian Call Girls In Dehradun 🍆🍌 By Dehradun Call Girl ★indiancallgirl4rent
 
(Ajay) Call Girls in Dehradun- 8854095900 Escorts Service 50% Off with Cash O...
(Ajay) Call Girls in Dehradun- 8854095900 Escorts Service 50% Off with Cash O...(Ajay) Call Girls in Dehradun- 8854095900 Escorts Service 50% Off with Cash O...
(Ajay) Call Girls in Dehradun- 8854095900 Escorts Service 50% Off with Cash O...indiancallgirl4rent
 
💚😋Mumbai Escort Service Call Girls, ₹5000 To 25K With AC💚😋
💚😋Mumbai Escort Service Call Girls, ₹5000 To 25K With AC💚😋💚😋Mumbai Escort Service Call Girls, ₹5000 To 25K With AC💚😋
💚😋Mumbai Escort Service Call Girls, ₹5000 To 25K With AC💚😋Sheetaleventcompany
 
Nanded Call Girls 👙 6297143586 👙 Genuine WhatsApp Number for Real Meet
Nanded Call Girls 👙 6297143586 👙 Genuine WhatsApp Number for Real MeetNanded Call Girls 👙 6297143586 👙 Genuine WhatsApp Number for Real Meet
Nanded Call Girls 👙 6297143586 👙 Genuine WhatsApp Number for Real MeetCall Girls Service
 
Udaipur Call Girls 📲 9999965857 Call Girl in Udaipur
Udaipur Call Girls 📲 9999965857 Call Girl in UdaipurUdaipur Call Girls 📲 9999965857 Call Girl in Udaipur
Udaipur Call Girls 📲 9999965857 Call Girl in Udaipurseemahedar019
 
Call Girls Thane Just Call 9907093804 Top Class Call Girl Service Available
Call Girls Thane Just Call 9907093804 Top Class Call Girl Service AvailableCall Girls Thane Just Call 9907093804 Top Class Call Girl Service Available
Call Girls Thane Just Call 9907093804 Top Class Call Girl Service AvailableDipal Arora
 

Recently uploaded (20)

❤️♀️@ Jaipur Call Girls ❤️♀️@ Meghna Jaipur Call Girls Number CRTHNR Call G...
❤️♀️@ Jaipur Call Girls ❤️♀️@ Meghna Jaipur Call Girls Number CRTHNR   Call G...❤️♀️@ Jaipur Call Girls ❤️♀️@ Meghna Jaipur Call Girls Number CRTHNR   Call G...
❤️♀️@ Jaipur Call Girls ❤️♀️@ Meghna Jaipur Call Girls Number CRTHNR Call G...
 
Dehradun Call Girls Service 08854095900 Real Russian Girls Looking Models
Dehradun Call Girls Service 08854095900 Real Russian Girls Looking ModelsDehradun Call Girls Service 08854095900 Real Russian Girls Looking Models
Dehradun Call Girls Service 08854095900 Real Russian Girls Looking Models
 
Call Girl Raipur 📲 9999965857 ヅ10k NiGhT Call Girls In Raipur
Call Girl Raipur 📲 9999965857 ヅ10k NiGhT Call Girls In RaipurCall Girl Raipur 📲 9999965857 ヅ10k NiGhT Call Girls In Raipur
Call Girl Raipur 📲 9999965857 ヅ10k NiGhT Call Girls In Raipur
 
Bangalore call girl 👯‍♀️@ Simran Independent Call Girls in Bangalore GIUXUZ...
Bangalore call girl  👯‍♀️@ Simran Independent Call Girls in Bangalore  GIUXUZ...Bangalore call girl  👯‍♀️@ Simran Independent Call Girls in Bangalore  GIUXUZ...
Bangalore call girl 👯‍♀️@ Simran Independent Call Girls in Bangalore GIUXUZ...
 
VIP Call Girl Sector 32 Noida Just Book Me 9711199171
VIP Call Girl Sector 32 Noida Just Book Me 9711199171VIP Call Girl Sector 32 Noida Just Book Me 9711199171
VIP Call Girl Sector 32 Noida Just Book Me 9711199171
 
Call Girls Hyderabad Just Call 9907093804 Top Class Call Girl Service Available
Call Girls Hyderabad Just Call 9907093804 Top Class Call Girl Service AvailableCall Girls Hyderabad Just Call 9907093804 Top Class Call Girl Service Available
Call Girls Hyderabad Just Call 9907093804 Top Class Call Girl Service Available
 
❤️♀️@ Jaipur Call Girls ❤️♀️@ Jaispreet Call Girl Services in Jaipur QRYPCF ...
❤️♀️@ Jaipur Call Girls ❤️♀️@ Jaispreet Call Girl Services in Jaipur QRYPCF  ...❤️♀️@ Jaipur Call Girls ❤️♀️@ Jaispreet Call Girl Services in Jaipur QRYPCF  ...
❤️♀️@ Jaipur Call Girls ❤️♀️@ Jaispreet Call Girl Services in Jaipur QRYPCF ...
 
Punjab❤️Call girls in Mohali ☎️7435815124☎️ Call Girl service in Mohali☎️ Moh...
Punjab❤️Call girls in Mohali ☎️7435815124☎️ Call Girl service in Mohali☎️ Moh...Punjab❤️Call girls in Mohali ☎️7435815124☎️ Call Girl service in Mohali☎️ Moh...
Punjab❤️Call girls in Mohali ☎️7435815124☎️ Call Girl service in Mohali☎️ Moh...
 
VIP Call Girls Sector 67 Gurgaon Just Call Me 9711199012
VIP Call Girls Sector 67 Gurgaon Just Call Me 9711199012VIP Call Girls Sector 67 Gurgaon Just Call Me 9711199012
VIP Call Girls Sector 67 Gurgaon Just Call Me 9711199012
 
Call Girls Service Faridabad 📲 9999965857 ヅ10k NiGhT Call Girls In Faridabad
Call Girls Service Faridabad 📲 9999965857 ヅ10k NiGhT Call Girls In FaridabadCall Girls Service Faridabad 📲 9999965857 ヅ10k NiGhT Call Girls In Faridabad
Call Girls Service Faridabad 📲 9999965857 ヅ10k NiGhT Call Girls In Faridabad
 
Call Girl Amritsar ❤️♀️@ 8725944379 Amritsar Call Girls Near Me ❤️♀️@ Sexy Ca...
Call Girl Amritsar ❤️♀️@ 8725944379 Amritsar Call Girls Near Me ❤️♀️@ Sexy Ca...Call Girl Amritsar ❤️♀️@ 8725944379 Amritsar Call Girls Near Me ❤️♀️@ Sexy Ca...
Call Girl Amritsar ❤️♀️@ 8725944379 Amritsar Call Girls Near Me ❤️♀️@ Sexy Ca...
 
raisen Call Girls 👙 6297143586 👙 Genuine WhatsApp Number for Real Meet
raisen Call Girls 👙 6297143586 👙 Genuine WhatsApp Number for Real Meetraisen Call Girls 👙 6297143586 👙 Genuine WhatsApp Number for Real Meet
raisen Call Girls 👙 6297143586 👙 Genuine WhatsApp Number for Real Meet
 
Jodhpur Call Girls 📲 9999965857 Jodhpur best beutiful hot girls full satisfie...
Jodhpur Call Girls 📲 9999965857 Jodhpur best beutiful hot girls full satisfie...Jodhpur Call Girls 📲 9999965857 Jodhpur best beutiful hot girls full satisfie...
Jodhpur Call Girls 📲 9999965857 Jodhpur best beutiful hot girls full satisfie...
 
👯‍♀️@ Bangalore call girl 👯‍♀️@ Jaspreet Russian Call Girls Service in Bangal...
👯‍♀️@ Bangalore call girl 👯‍♀️@ Jaspreet Russian Call Girls Service in Bangal...👯‍♀️@ Bangalore call girl 👯‍♀️@ Jaspreet Russian Call Girls Service in Bangal...
👯‍♀️@ Bangalore call girl 👯‍♀️@ Jaspreet Russian Call Girls Service in Bangal...
 
Enjoyment ★ 8854095900 Indian Call Girls In Dehradun 🍆🍌 By Dehradun Call Girl ★
Enjoyment ★ 8854095900 Indian Call Girls In Dehradun 🍆🍌 By Dehradun Call Girl ★Enjoyment ★ 8854095900 Indian Call Girls In Dehradun 🍆🍌 By Dehradun Call Girl ★
Enjoyment ★ 8854095900 Indian Call Girls In Dehradun 🍆🍌 By Dehradun Call Girl ★
 
(Ajay) Call Girls in Dehradun- 8854095900 Escorts Service 50% Off with Cash O...
(Ajay) Call Girls in Dehradun- 8854095900 Escorts Service 50% Off with Cash O...(Ajay) Call Girls in Dehradun- 8854095900 Escorts Service 50% Off with Cash O...
(Ajay) Call Girls in Dehradun- 8854095900 Escorts Service 50% Off with Cash O...
 
💚😋Mumbai Escort Service Call Girls, ₹5000 To 25K With AC💚😋
💚😋Mumbai Escort Service Call Girls, ₹5000 To 25K With AC💚😋💚😋Mumbai Escort Service Call Girls, ₹5000 To 25K With AC💚😋
💚😋Mumbai Escort Service Call Girls, ₹5000 To 25K With AC💚😋
 
Nanded Call Girls 👙 6297143586 👙 Genuine WhatsApp Number for Real Meet
Nanded Call Girls 👙 6297143586 👙 Genuine WhatsApp Number for Real MeetNanded Call Girls 👙 6297143586 👙 Genuine WhatsApp Number for Real Meet
Nanded Call Girls 👙 6297143586 👙 Genuine WhatsApp Number for Real Meet
 
Udaipur Call Girls 📲 9999965857 Call Girl in Udaipur
Udaipur Call Girls 📲 9999965857 Call Girl in UdaipurUdaipur Call Girls 📲 9999965857 Call Girl in Udaipur
Udaipur Call Girls 📲 9999965857 Call Girl in Udaipur
 
Call Girls Thane Just Call 9907093804 Top Class Call Girl Service Available
Call Girls Thane Just Call 9907093804 Top Class Call Girl Service AvailableCall Girls Thane Just Call 9907093804 Top Class Call Girl Service Available
Call Girls Thane Just Call 9907093804 Top Class Call Girl Service Available
 

Research Methods 2 for Midwifery students .pptx

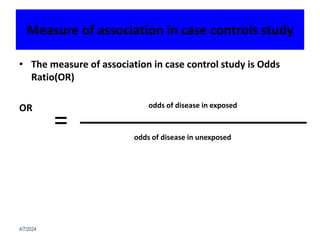
  • 1. Measure of association in case controls study • The measure of association in case control study is Odds Ratio(OR) OR 4/7/2024 = odds of disease in exposed odds of disease in unexposed
  • 2. Measure of association…con Odds = the chances of something happening the chances of it not happening 4/7/2024
  • 3. Measure of association…cont OR= ad/bc If OR=1, it is null hypothesis If OR>1, the exposure is a risk factor If OR<1, the exposure is protective 4/7/2024
  • 4. Cohort study • A group of persons – sharing the same experience – followed for a specified period of time • Examples – birth cohort – workers at a chemical industry – graduating university class – Attendants of this course
  • 5. Cohort Studies • Disease free exposed and non-exposed people are followed up and then outcome events are picked up when they occur • Measure and compare the incidence of disease in two or more study cohorts • Usually prospective or forward looking. • Some times also called longitudinal studies.
  • 6. Disease among exposed? Disease among non- exposed? Usually prospective Cohort study Population at risk Exposed Not Exposed
  • 7. Types of Cohort Studies • Based on the starting point of the study • Prospective: Healthy cohort (free of the disease) assembled and followed. More reliable than retrospective • Retrospective (historical): the study is initiated at a point in time after both the exposure and disease have already occurred. • It is constructed retrospectively through existing records
  • 8. Prospective Cohort Study + - ill well Health exp + - exp Disease occurrence Study starts Exposure occurrence Prospective assessment of disease Selection based on exposure
  • 9. Retrospective Cohort Study Study takes place Disease occurrence Exposure occurrence Retrospective assessment of exposure and disease + - + - ill exp
  • 10. Advantages of cohort studies • Directly measure risk or rate • Temporal r/s between exposure & disease is clear • Less susceptible to selection bias because outcome not known • Well suited to rare exposures • Several outcomes can be examined in one study
  • 11. Disadvantages of cohort studies • Large sample size • Longer latency period • Loss to follow up • Exposure can change over time • It difficult to assess multiple exposures • Expensive and Time consuming
  • 12. Measures of association in Cohort Studies Diseased Not Disease Total Incidence Rates of Disease Exposed a b a + b a/a + b Not Exposed c d c + d c/c + d 4/7/2024
  • 13. Cont’d • Relative Risk (RR) = Iexp / Inon-exp = [a/(a+b)] / [c/(c+d)] 4/7/2024
  • 14. Experimental/Intervention Studies • Investigator assigns subjects to exposure and non-exposure and makes follow up to measure for the occurrence of a disease/ out come of interest o It is usually prospective. o Provides high quality data o Random allocation
  • 15. Source: partially adapted from WHO, 1993 Design of an Experimental Study Investigator determines exposure status
  • 16. When to choose an experimental design? • When: –the research question cannot be answered by observational studies –earlier observational studies have not answered the research question –existing knowledge is not sufficient to determine clinical or public health policy –an experiment is likely to provide an important extension of this knowledge
  • 17. Types of Experimental Studies • Randomized Clinical Trial (RCT)
  • 18. Randomized Clinical Trial (RCT) • Randomization is done on individuals – Each subject is given an equal chance of being assigned to either treatment or control group. Blinding • Double-blind = Neither the participants nor the investigators responsible for outcome assessment, know the group to which participant has been assigned • Single-blind = The investigator alone is aware of the groups to which participant has been assigned
  • 20. Problems of Intervention Studies • More difficult to design and conduct • Ethical issues – Withholding – Exposing • Feasibility – Very large sample size required • Cost – Very expensive
  • 21. Advantages of Intervention Studies • GOLD STANDARD = Randomized, placebo controlled, blinded clinical trials • The ability to assign exposure • The ability to control confounding • Findings can be replicated = Generalizability
  • 22. The hierarchy of epidemiological research
  • 23. Methods… Study Design Which study design to use depends on: The research question to be answered The resource and research facilities available Any study design has its own strength and limitation Some research questions can be answered by using different designs 23
  • 24. Sampling methods and Sample size determination • After knowing whom to involve in study, researcher need how to identify subjects and how many of them to involve in the study 24
  • 25. Sample Size • Sample Size: The number of study subjects selected to represent a given study population. • Sample size should be sufficient to represent the characteristics of interest of the study population. • Common questions: – “How many subjects should I study?” 25
  • 26. When deciding on sample size: ∆ Sample size = Precision = Cost PRECISION COST 26
  • 27. Sample Size: One Variable n=sample size s or σ = standard deviation d=desired precision 27
  • 29. • Suppose that for a certain group of cancer patients, we are interested in estimating the mean age of diagnosis. We would like a 95% CI of 5 years wide. If the population SD is 12 years, how large should our sample be? 29
  • 30. • Suppose d=1 • Then the sample size increases 30
  • 31. Methods… Sample Size Determination Single Population Proportion In order to calculate the required sample size, you need to know the following facts for proportion Previous prevalence or proportion of the problem (p), If you cannot guess the proportion, take it as 50%. Allowable margin of error (d) (1% -5% )- deviate from the true proportion in the population as a whole. Level confidence interval (95% or 99% ) The size of the population that the sample has to represent 31
  • 32. Estimation of Single Proportion 32
  • 33. • Suppose that you are interested to know the proportion of infants who breastfed >18 months of age in a rural area. Suppose that in a similar area, the proportion (p) of breastfed infants was found to be 0.20. What sample size is required to estimate the true proportion within ±3% with 95% confidence. Let p=0.20, d=0.03, α=5% 33
  • 34. • Suppose there is no prior information about the proportion who breastfeed • Assume p=q=0.5 (most conservative) • Then the required sample size increases 34
  • 35. • If you studied more than two dependent variable you have use the variable which can give maximum sample size • Using software ( Epi info) 35
  • 36. 36 Methods…Sampling Techniques What is sampling? Why we need to use sampling?
  • 37. Sampling • The process of selecting a portion of the population to represent the entire population. • A main concern in sampling: – Ensure that the sample represents the population, and – The findings can be generalized. A representative sample: has all the important characteristics of the population from which it is drawn
  • 38. Advantages of sampling: • Feasibility: Sampling may be the only feasible method of collecting information. • Reduced cost: Sampling reduces demands on resource such as finance, personnel, and material. • Greater accuracy: Sampling may lead to better accuracy (quality) of collecting data • Greater speed: Data can be collected and summarized more quickly (time saving)
  • 39. Disadvantages of sampling: • There is always a sampling error. • Sampling may create a feeling of discrimination within the population.
  • 40. Sampling Methods Two broad divisions: A. Non-probability sampling methods B. Probability sampling methods
  • 41. A. Non-probability sampling • In non-probability sampling, every subjects has an unknown chance of being selected. • There is an assumption that there is an even distribution of a characteristic of interest within the population.
  • 42. • Despite these drawbacks, non-probability sampling methods can be useful when descriptive comments about the sample itself are desired. • Secondly, they are quick, inexpensive and convenient. • There are also other circumstances, such as in researches, when it is unfeasible or impractical to conduct probability sampling.
  • 43. The most common types of non- probability sampling 1. Convenience sampling 2. Quota sampling 3. Judgment sampling 4. Snow ball sampling
  • 44. 1. Convenience Sampling • For convenience, the study units that are available easily and conveniently at the time of data collection are selected • Many clinic-based studies • The advantage is that the method is easy to use, but that advantage is greatly offset by the presence of bias.
  • 45. 2. Quota sampling • This is one of the most common forms of non- probability sampling. • Sampling is done until a specific number of units (quotas) for different categories of populations have been selected. • It is really a means for satisfying sample size objectives for certain sub-populations. • The main argument against quota sampling is that it does not meet the basic requirement of randomness. • Some units may have no chance of selection or the chance of selection may be unknown.
  • 46. B. Probability sampling • Involves random selection of a sample • A sample is obtained in a way that ensures every member of the population to have a known, non zero probability of being included in the sample. • Selection of a sample from a population, based on chance.
  • 47. • Probability sampling is: – more complex, – more time-consuming and – usually more costly than non-probability sampling. • However, because study samples are randomly selected and their probability of inclusion can be calculated, – reliable estimates can be produced and – inferences can be made about the population.
  • 48. Most common probability sampling methods 1. Simple random sampling 2. Systematic random sampling 3. Stratified random sampling 4. Cluster sampling 5. Multi-stage sampling
  • 49. 1. Simple random sampling • Involves random selection • Each member of a population has an equal chance of being included in the sample.
  • 50. • To use a SRS method: – Make a numbered list of all the units in the population – Each unit should be numbered from 1 to N (where N is the size of the population) – Select the required number.
  • 51. The randomness of the sample is ensured by: •use of “lottery’ methods •a table of random numbers •Computer programs
  • 52. Example • Suppose your school has 500 students and you need to conduct a short survey on the quality of the food served in the cafeteria. • You decide that a sample of 10 students should be sufficient for your purposes. • In order to get your sample, you assign a number from 1 to 500 to each student in your school.
  • 53. • To select the sample, you use a table of randomly generated numbers. • Pick a starting point in the table (a row and column number) and look at the random numbers that appear there. In this case, since the data run into three digits, the random numbers would need to contain three digits as well.
  • 54. • Ignore all random numbers after 500 because they do not correspond to any of the students in the school. • Remember that the sample is without replacement, so if a number recurs, skip over it and use the next random number. • The first 10 different numbers between 001 and 500 make up your sample.
  • 55. • SRS has certain limitations: – Requires a sampling frame. – Difficult if the reference population is dispersed. – Minority subgroups of interest may not be selected.
  • 56. 2. Systematic random sampling • Sometimes called interval sampling,- means that there is a gap, or interval, between each selected unit in the sample • The selection is systematic rather than randomly
  • 57. • Important if the reference population is arranged in some order • Taking individuals at fixed intervals (every kth) called sampling fraction,
  • 58. Steps in systematic random sampling 1. Number the units frame from 1 to N (where N is the total population size). 2. Determine the sampling interval (K) by dividing the number of units in the population for the desired sample size 3. Select the first number included in your sample between one and K at random. 4. Select every Kth unit after that first number Note: Systematic sampling should not be used when a cyclic repetition is inherent in the sampling frame. k=N/n (N-total &n-sample population)
  • 59. 3. Stratified random sampling • It is done when the population is known to have heterogeneity with regard to some factors and those factors are used for stratification • A population can be stratified by any variable prior to sampling (e.g., age, sex, province of residence, income, etc.). • Using stratified sampling, the population is divided into homogeneous, mutually exclusive groups called strata • A separate sample is taken independently from each stratum. • Any of the sampling methods mentioned in this section (and others that exist) can be used to sample within each stratum. • Ensures an adequate sample size for sub-groups • Each stratum is an independent population and you will need to decide the sample size for each stratum
  • 60. • Equal allocation: – Allocate equal sample size to each stratum • Proportionate allocation: , j = 1, 2, ..., k where, k is the number of strata and – nj is sample size of the jth stratum – Nj is population size of the jth stratum – n = n1 + n2 + ...+ nk is the total sample size – N = N1 + N2 + ...+ Nk is the total population size n n N N j j 
  • 61. 4. Cluster sampling • Sometimes it is too expensive to spread a sample across the population as a whole. • To reduce costs, researchers may choose a cluster sampling technique • The clusters should be homogeneous, unlike stratified sampling where by the strata are heterogeneous
  • 62. Steps in cluster sampling • Cluster sampling divides the population into groups or clusters. • A number of clusters are selected randomly to represent the total population, and then all units within selected clusters are included in the sample. Example • In a school-based study, we assume students of the same school are homogeneous. • We can select randomly sections and include all students of the selected sections only
  • 63. 5. Multi-stage sampling • Similar to the cluster sampling, except that it involves picking a sample from within each chosen cluster, rather than including all units in the cluster. This type of sampling requires at least two stages. • First stage, large groups or clusters are identified and selected. These clusters contain more population units than needed • Second stage, population units are picked from the selected clusters (using any of sampling methods) for a final sample.
  • 64. • No need to have a list of all of the units in the population. • All you need is a list of clusters and list of the units in the selected clusters. • Multi-stage sampling saves a great amount of time and effort by not having to create a list of all the units in a population.
  • 65. Data Collection Data collection techniques –it is a techniques which allows us to systematically collect information • Using available information (record review) • Observation • Interview • Administering written questionnaires • Focus Group Discussions • Other data collection methods 65
  • 66. 1. Using available data • Morbidity reports • Mortality reports • Epidemic reports • Epidemic investigations • Laboratory data • Special surveys • Demographic data (census) 66
  • 67. Sources of available data • Health facilities – Health center, hospital • Immunization • Childhood diseases • MCH clinics • etc 67
  • 68. Advantage • Collection is inexpensive Disadvantage • May not always be complete and precise 68
  • 69. 2. Observation • Involves systematically selecting, watching, and recording behavior and characteristics. • Checklists or a list of question are usually used. • It is simply observing some health care practice with out intervention/ interuption 69
  • 70. 3. Interviewing • Involves oral questioning of respondents, either individually or as a group. • Answers are recorded by writing or by tape recording the responses. • Two types interview – Face-to-face interview – Telephone interview 70
  • 71. 4. Administering written questionnaires • Also known as self-administered questionnaire • Written questions are presented to be answered by the respondents in written form. 5. Focus group discussions (FGDs)  A group discussion on a specific topic and it is used for qualitative data. 71
  • 72. Bias in data collection and its possible causes • BIAS is a distortion which results in the information not being representative of the true situation. 72
  • 73. Possible sources of bias 1. Defective instruments - Poorly designed questionnaires/tools • Can be avoided by careful planning of the data collection process and by pre-testing the data collection tools 2. Observer bias- Related to data collectors 3. Selection bias • High refusal rate • Participants are self-selected 73
  • 74. 4. Information bias • Poor recording, poor data extraction • Incomplete data • Recall (or memory) bias 5. Effect of the interviewer on the informant – Informant may mistrust the interview – Misleading answers 74
  • 75. Variables • Variables: is a characteristic of a person, object or phenomenon on which observation or measurement is made. – Weight, height, age, income, etc., all are variables • Qualitative Vs Quantitative Variables 75
  • 76. Types of Variables →Numerical and categorical • Numerical: Information is measured by assigning numbers We can also divided numerical/quantitative variable in to two: • Discrete data and Continuous data/variable
  • 77. Numerical Variables a. Discrete variable: when numbers represent actual measurable quantities rather than mere labels. • Discrete data are restricted to taking only specified values often integers or counts that differ by fixed amounts. e.g. Number of new AIDS cases reported during one year period, – Number of beds available in a particular hospital b. Continuous variable: represent measurable quantities but are not restricted to taking on certain specific values i.e. fractional values are possible  e.g. weight, cholesterol level, time, temperature
  • 78. Categorical Variables … • Categorical/Qualitative variable: Information is measured by assigning names to items (events) according to a set of rules, which result on different types of data.  two types: Nominal and ordinal E.g.. Gender, blood group, Marital status
  • 79. Dependent and independent variables … • The variable that is used to describe or measure the problem under study is called the dependent variable. • The variables that are used to describe or measure the factors that are assumed to influence (or cause) the problem are called independent variables.
  • 80. Variables … • For example, in a study of relationship between smoking and lung cancer, "suffering from lung cancer" (with the values yes, no) would be the dependent variable and "smoking" (with the values no, less than a packet/day, 1 to 2 packets/day, more than 2 packets/day) would be the independent variable.
  • 81. Background variables • In almost every study involving human subjects, background variables, such as, age, sex, educational status, monthly family income, marital status and religion will be included. • These background variables are often related to a number of independent variables, so that they influence the problem indirectly. • Hence they are called background variables or background characteristics.
  • 82. Example A relationship is shown between the low level of the mother’s education and malnutrition in under 5s. However, family income may be related to the mother’s education as well as to malnutrition
  • 83. Confounding variable: • Relationship between low level of mother’s education and malnutrition in under five children Mother’s Education (Independent) Malnutrition Dependent Family Income (Confounding Variable) 83
  • 84. Operationalizing variables • Operationalizing variables means that you make them ‘measurable'. • Example: In a study on VCT acceptance, you want to determine the level of knowledge concerning HIV in order to find out to what extent the factor ‘poor knowledge’ influences willingness to be tested for HIV.
  • 85. Cont’d • The variable ‘level of knowledge’ cannot be measured as such. • You would need to develop a series of questions to assess a person’s knowledge • The answers to these questions form an indicator of someone’s knowledge on this issue, which can then be categorized.
  • 86. Cont’d … If 10 questions were asked, you might decide that the knowledge of those with: • 0 to 3 correct answers is poor, • 4 to 6 correct answers is reasonable, and • 7 to 10 correct answers is good. To operationalize variables of interest: we use Existing measures Observation Self report
  • 87. Con… • To ensure that everyone understands exactly what has been measured and to ensure that there will be consistency in the measurement
  • 88. Cont’d … E.g. “waiting time” e.g. Is it when the patient enters the front door, or when he has been registered and obtained his card?
  • 89. Cont’d … Operational definitions of variables are used in order to: • Avoid ambiguity • Make the variables to be more measurable
  • 90. Questionnaire Design Questionnaire(tools) is the set of questions for obtaining information from respondents. Respondents should able to Answer the Question? –may not remember(recall bias) –may not understand the concepts of the item used –may feel too much effort involved –The information requested is too sensitive( social desirability bias). 90
  • 91. What Should be the Structure of the Question? • A question may be:- A. Unstructured (open-ended) questions- that respondents answer in their own words o Completely unstructured - EX “What is your opinion of contraceptive use?” o Sentence completion - Respondents complete an incomplete sentence. For example, “The most important consideration in my decision to use contraceptives is __________ Disadvantages • some respondents give answers not relevant to your objective • Time taking especially for large sample size • Difficult for data processing and analysis 91
  • 92. Questionnaires cont… B. Structured(closed-ended)questions- specify the set of responses  Yes/no questions: The respondent answers with “yes” or “no”.  Multiple choice : The respondent has several options  Scaled questions: Responses are graded on a continuum (example : rate on a scale from 1 to 5, with 5 being the most preferred). o Common types of scales is the Likert scale Constructing closed ended questions • Include all possible responses that might be expected • Mutually exclusive • Describe in cases might want to solicit multiple answers 92
  • 93. • Hypothetical constructs:-Some variables are hypothetical constructs, – E.g. knowledge, behavior can be measured to some degree indirectly. Disadvantages • Some might over look some important items • Might have multiple answers 93
  • 94. How can questions are wording properly 1. Define the issue ( in terms of who, what, when, where, why, and how (the six Ws). 2. Use ordinary words 3. Avoid ambiguous words 4. Avoid leading questions 5. Avoid calculations 94
  • 95. What Is the Proper Order of Questions? • Questions should be asked in a logical order – The opening questions should be interesting, simple, and nonthreatening. – Basic information should be obtained first, – Difficult, sensitive, or complex questions should be placed late in the sequence. – General questions should precede specific questions. Every questionnaire, should contain clear instructions and introductory comments where appropriate • Clear, specific and Precise – E.g. What kind of home do you have? (Not clear) – E.g. How far is the nearest health institution from your home? (Not specific) 95
  • 96. 96 Pre-testing and pilot study • A pre-test usually refers to a small-scale trail of a particular research component. • A pilot is the process of caring out the preliminary study, going through the entire research procedure with the small sample size. • Important to identify potential problems in the proposed study.  It enables to make some revision if necessary before actual data collection.  Money, time and manpower can be saved.  Even the best questionnaire can be improved by pretesting. • As a general rule, a questionnaire should not be used in the field without extensive pretesting. • The pretest groups should be similar to the respondents • It is done out the actual study site
  • 97. 97 Plan for Data Processing and Analysis • Data processing plan should involve: – Checks: Completeness and internal consistency checked again and can be corrected • If too many portions data (>20%) left incomplete entire questionnaire may be omitted  Care must be taken on deciding to do so because this threatens the validity of the study • Inconsistent responses: check from interviewer, if due to recording; correct the response, if not go to respondent to clarify
  • 98. 98 Plan for data processing and analysis Data Processing  Categorizing the data  Coding and recoding  Summarizing of the data Data analysis  Determine frequency count The first activity of analysis  Cross tabulation • Combines information on two or more variables
  • 99. Research Ethics Ethics – is the branch of philosophy that deals with distinctions between right and wrong- with the moral consequences of human actions. 99
  • 100. Historical Perspectives cont… The Common Rule requires: • Prior ethics committee approval • Written informed consent and documentation • Equitable recruitment of research participants • Special protection for vulnerable groups 100
  • 101. Principles of Research Ethics 1. Respect for persons/autonomy - a norm of respecting the decision-making capacities of autonomous persons 2. Beneficence -a group of norms for providing benefits and balancing benefits against risks and costs 3. Justice - a group of norms for distributing benefits, risks, and costs fairly 4. Non-malfeasance : avoiding and preventing harm in all person 5. Confidentiality : keeping the sensetive issues/secrets of the study participants 101
  • 102. Informed Consent • Definition -consent given by a competent individual who: – has received the necessary information – has adequately understood the information – after considering the information, has arrived at a decision without having been subjected to coercion, undue influence or inducement.” 102
  • 103. Informed Consent cont… Essential Elements of Informed Consent 1) Description of the research objectives and purposes 2) Description of reasonably foreseeable risks 3) Description of expected benefits 4) Potentially advantageous alternatives to participation 5) Explanation of confidentiality 6) Whom to contact about the research and participants’ rights 7) Explanation that participation is voluntary 103
  • 104. Plagiarism • Plagiarism - is the use or close imitation of the language and thoughts of another author and the representation of them as one's own original work 104
  • 105. Work plan and Budget breakdown WORK PLAN:- Display each activity that is necessary to successfully implement the research project together with the responsible person and the time needed for accomplishing each activity) • Work plan summarizes (in a table, chart, graph) the various components of a research project and how they fit together. • Includes: – Tasks to be performed – When the task will be performed – Who will perform the task • Ways of presenting a work plan • Work schedule • GANNT chart 105
  • 106. Work plan cont.. The Work Schedule • Is a table • Summarizes: – tasks to be performed – duration of each activity, and – Included the responsible body. 106
  • 107. Work plan cont.. The GANTT Chart • Is a planning tool which describes graphically the order in which various tasks must be completed and their duration of activity. A typical Gantt chart includes the following information: • The tasks to be performed • Who is responsible for each task; and • The time each task is expected to take. • The length of each task is shown by a bar that extends over the number of days, weeks or months the task is expected to take. • The Gantt chart doesn’t show how various tasks are related. 107
  • 108. GANTT Chart cont… Activity Time (2016) Octob Nov Dec Jan Feb Activity 1 Activity 2 Activity 3 Activity 4 Activity 5
  • 109. Budget How should a budget be prepared? • It is necessary to use the work plan as a starting point. • Specify, for each activity in the work plan, what resources are required. • Determine for each resource needed the unit cost and the total cost. • The budget for the fieldwork component of the work plan will include funds for personnel, transport and supplies. The Budget Format • The type of budget format to be used may vary • Most donor organizations have their own special project forms, which include a budget format. 109
  • 110. Thank you for your attention 110