Downloaded 2,125 times
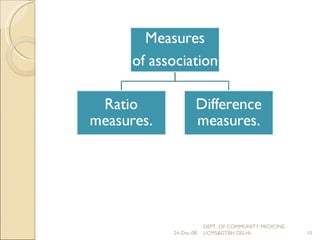
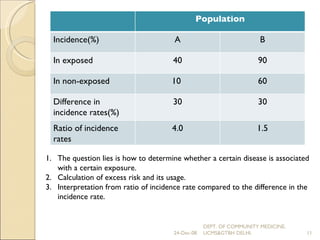
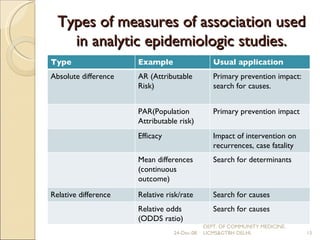
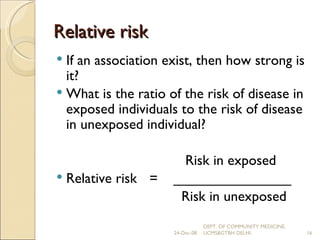
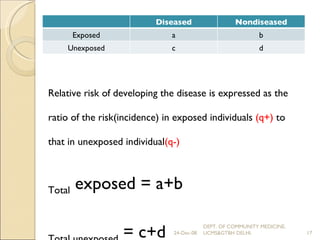
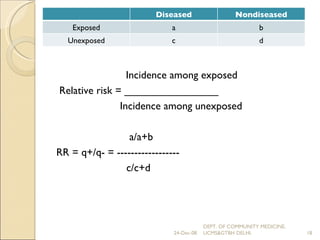
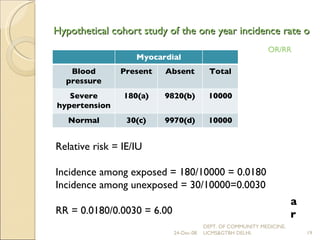
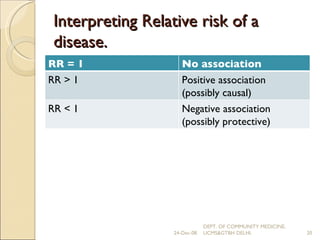
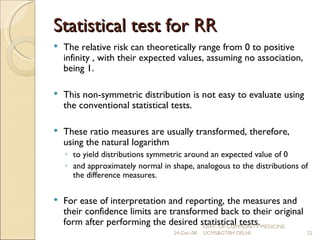
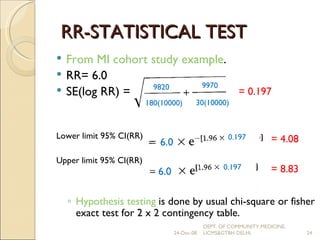
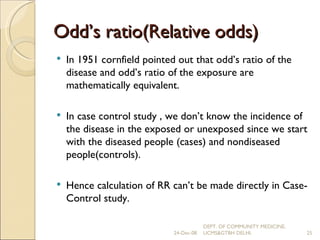
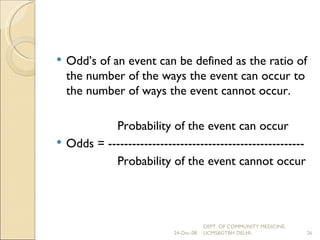
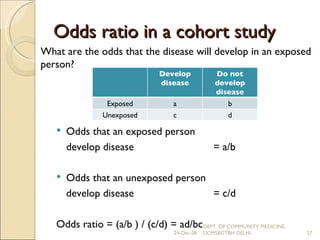
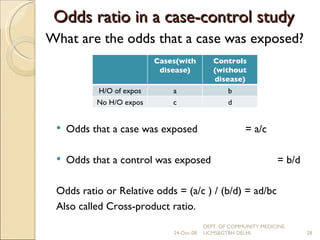
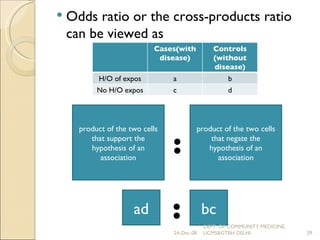
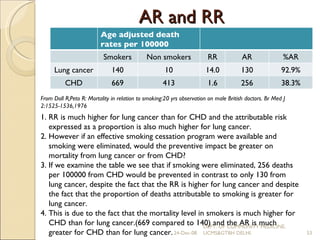


The document discusses various measures used to assess the strength and nature of associations between variables in epidemiological studies. It describes difference measures like absolute risk and ratio measures like relative risk and odds ratio. It explains how relative risk is calculated in cohort studies and how odds ratio is used as a measure of association in case-control studies. The relationship between relative risk and odds ratio is also covered.


![ONFH[AVN HIP] -TRIPLE REGIME -A NOVAL SURGICAL CONCEPT .pptx](https://cdn.slidesharecdn.com/ss_thumbnails/onfhavnhip2026koaconcalicutdrgokuldevdrmashraf-260210064517-213ec005-thumbnail.jpg?width=640&height=640&fit=bounds)


