The document discusses key concepts related to sampling and sample size, including:
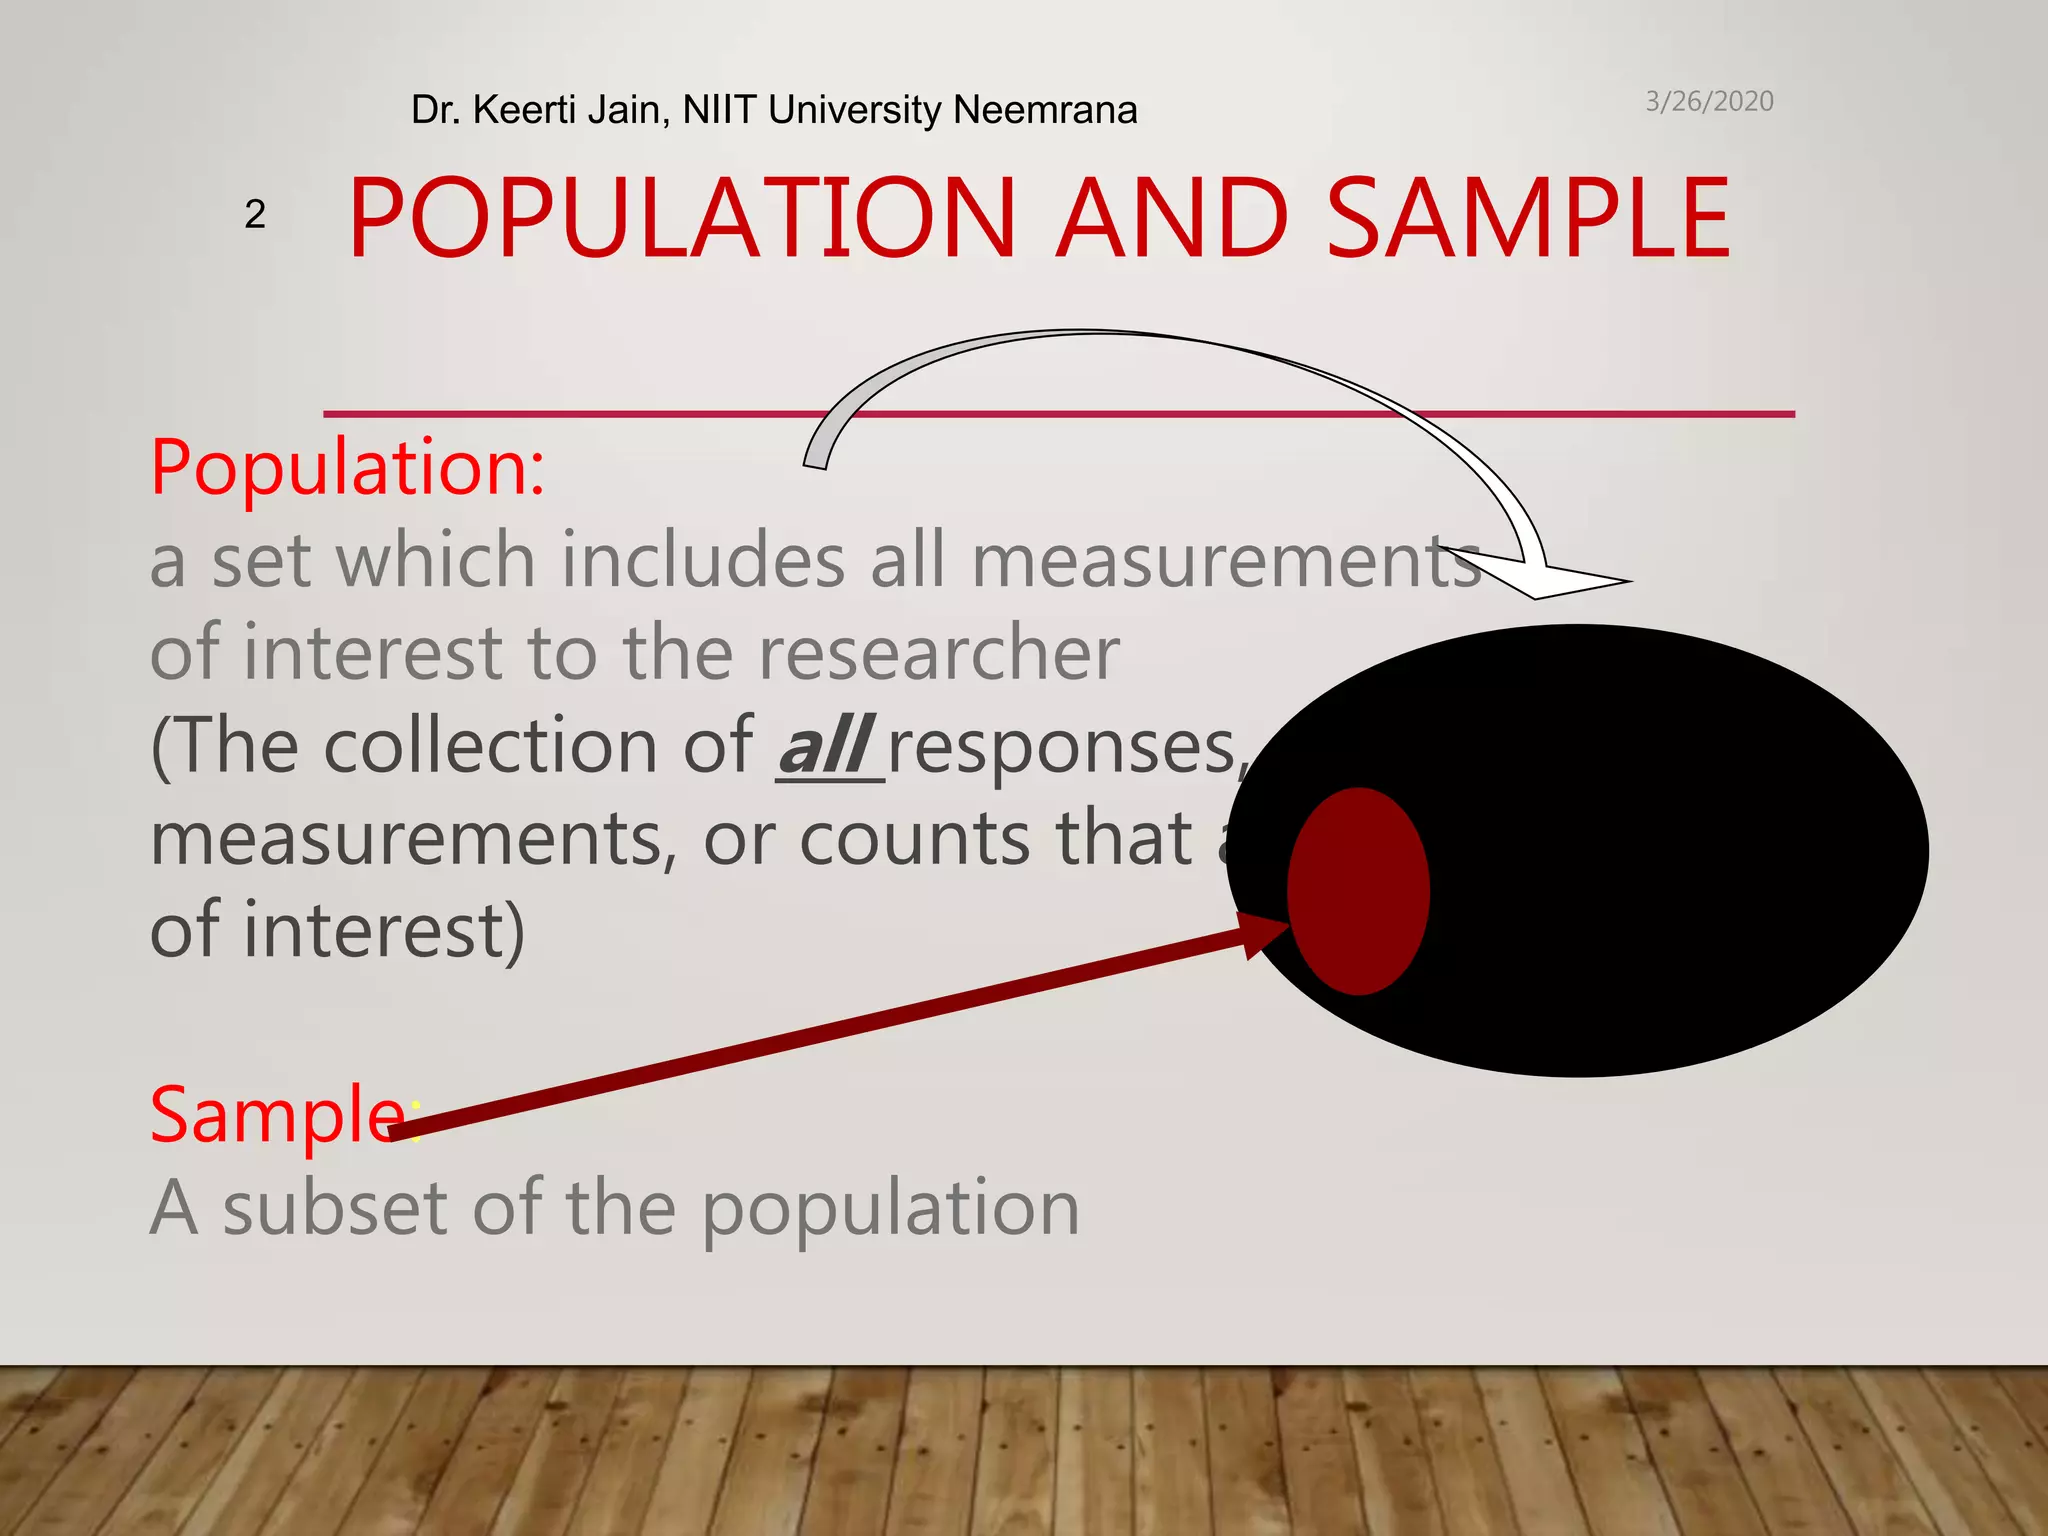
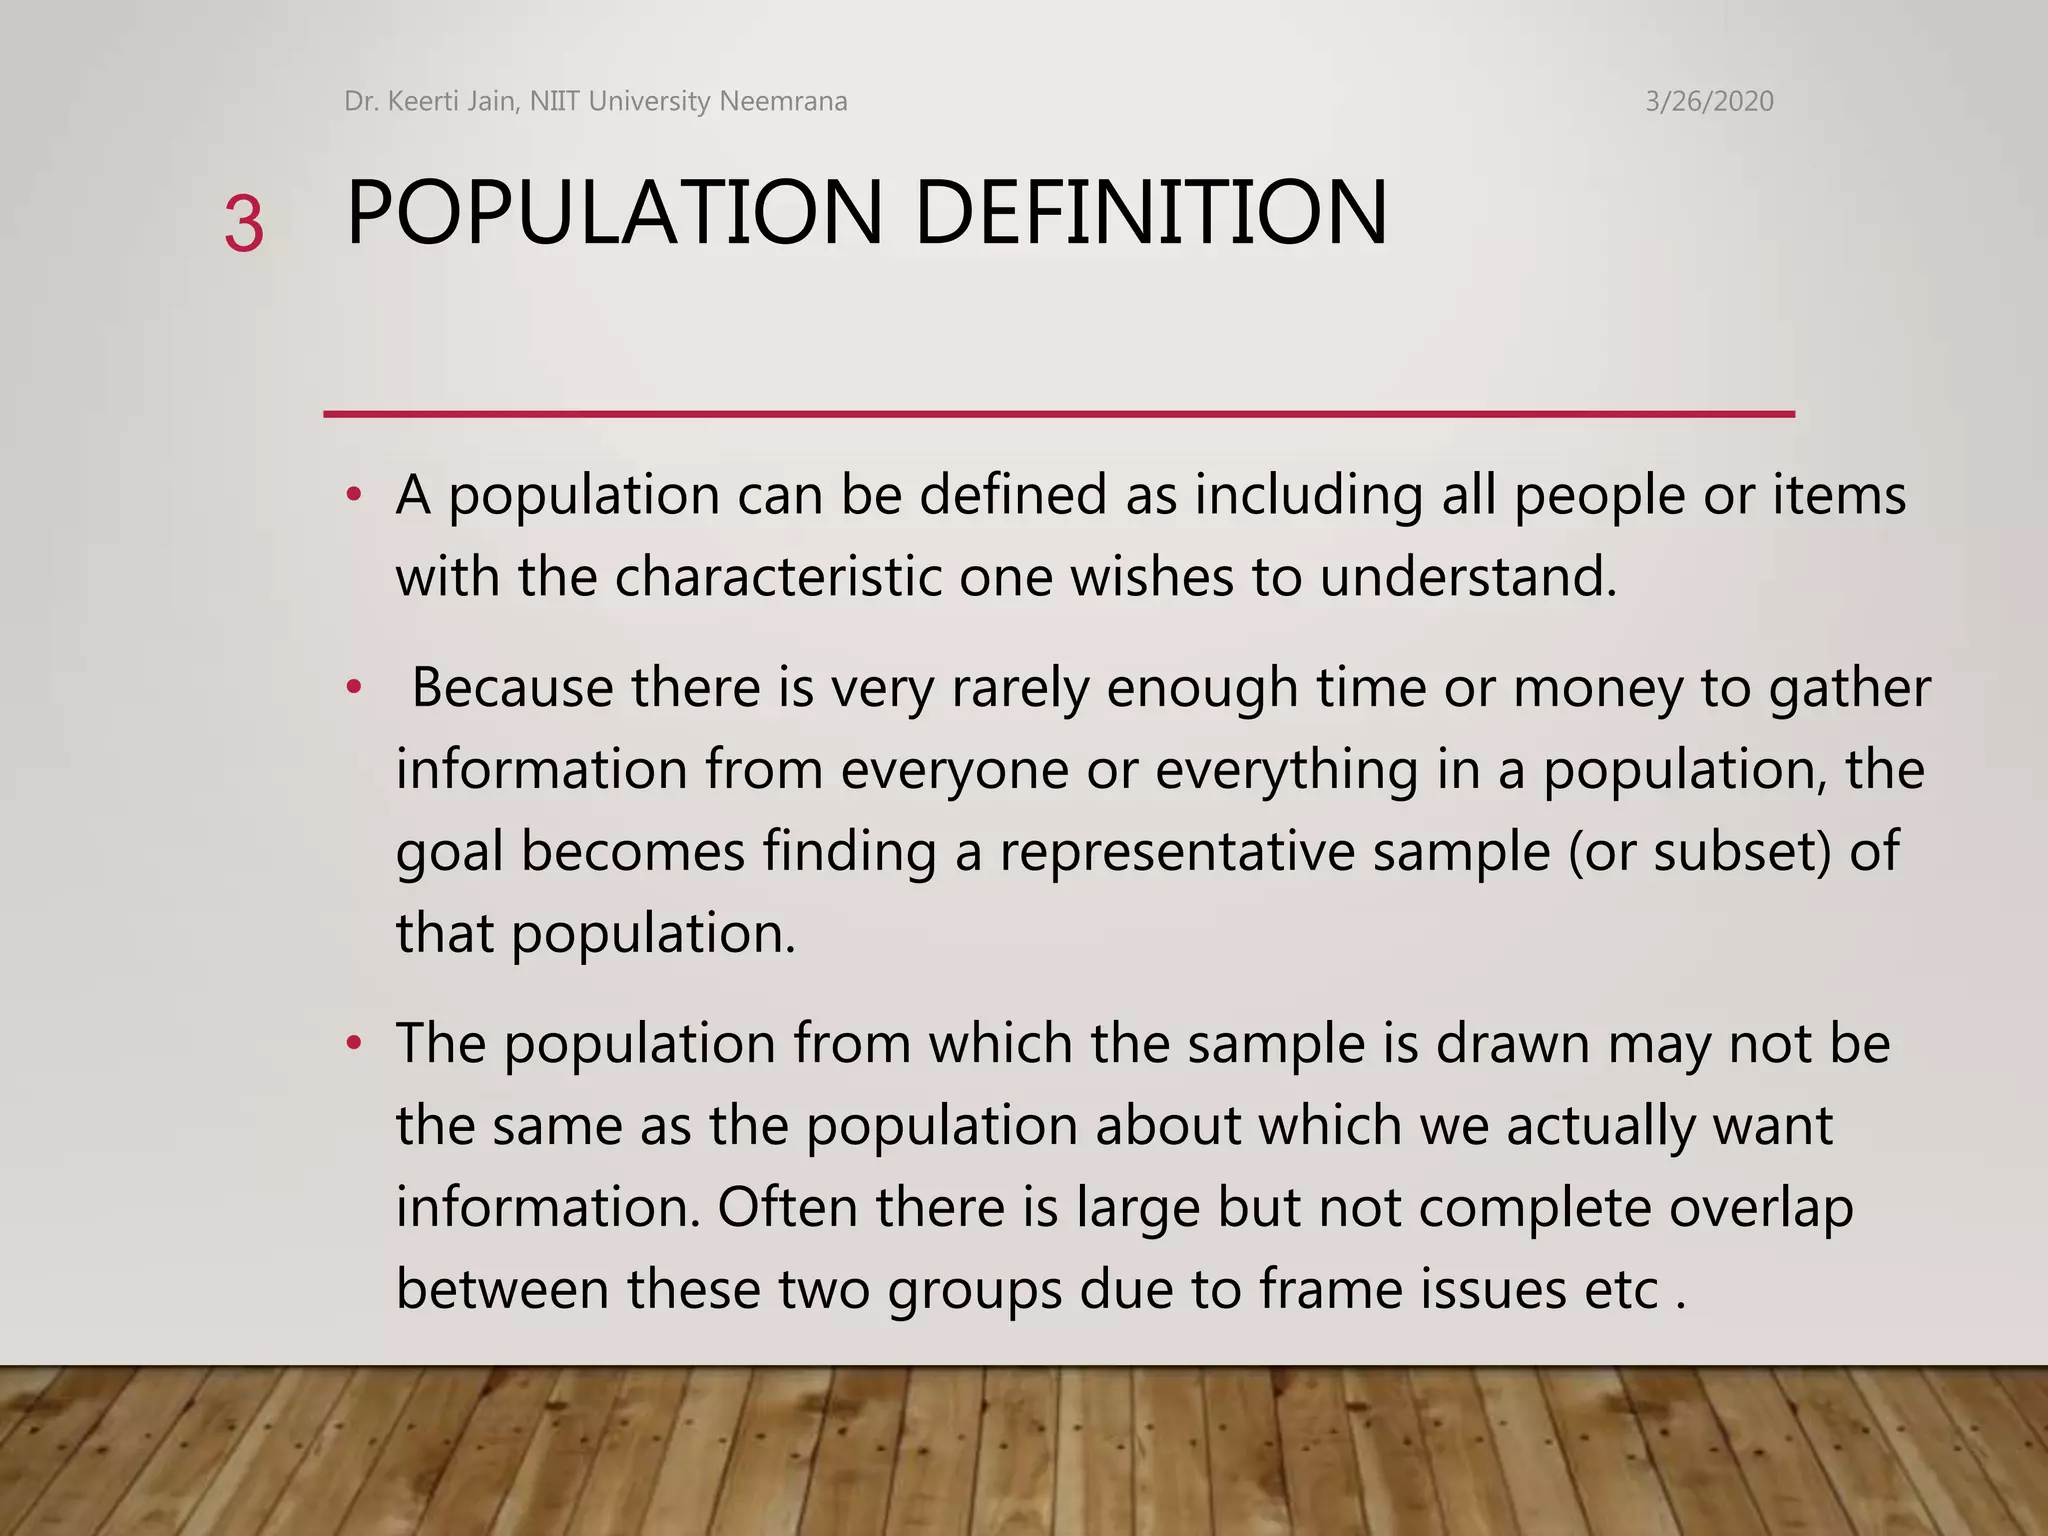
- The difference between a population and a sample, with a sample being a subset of the population.
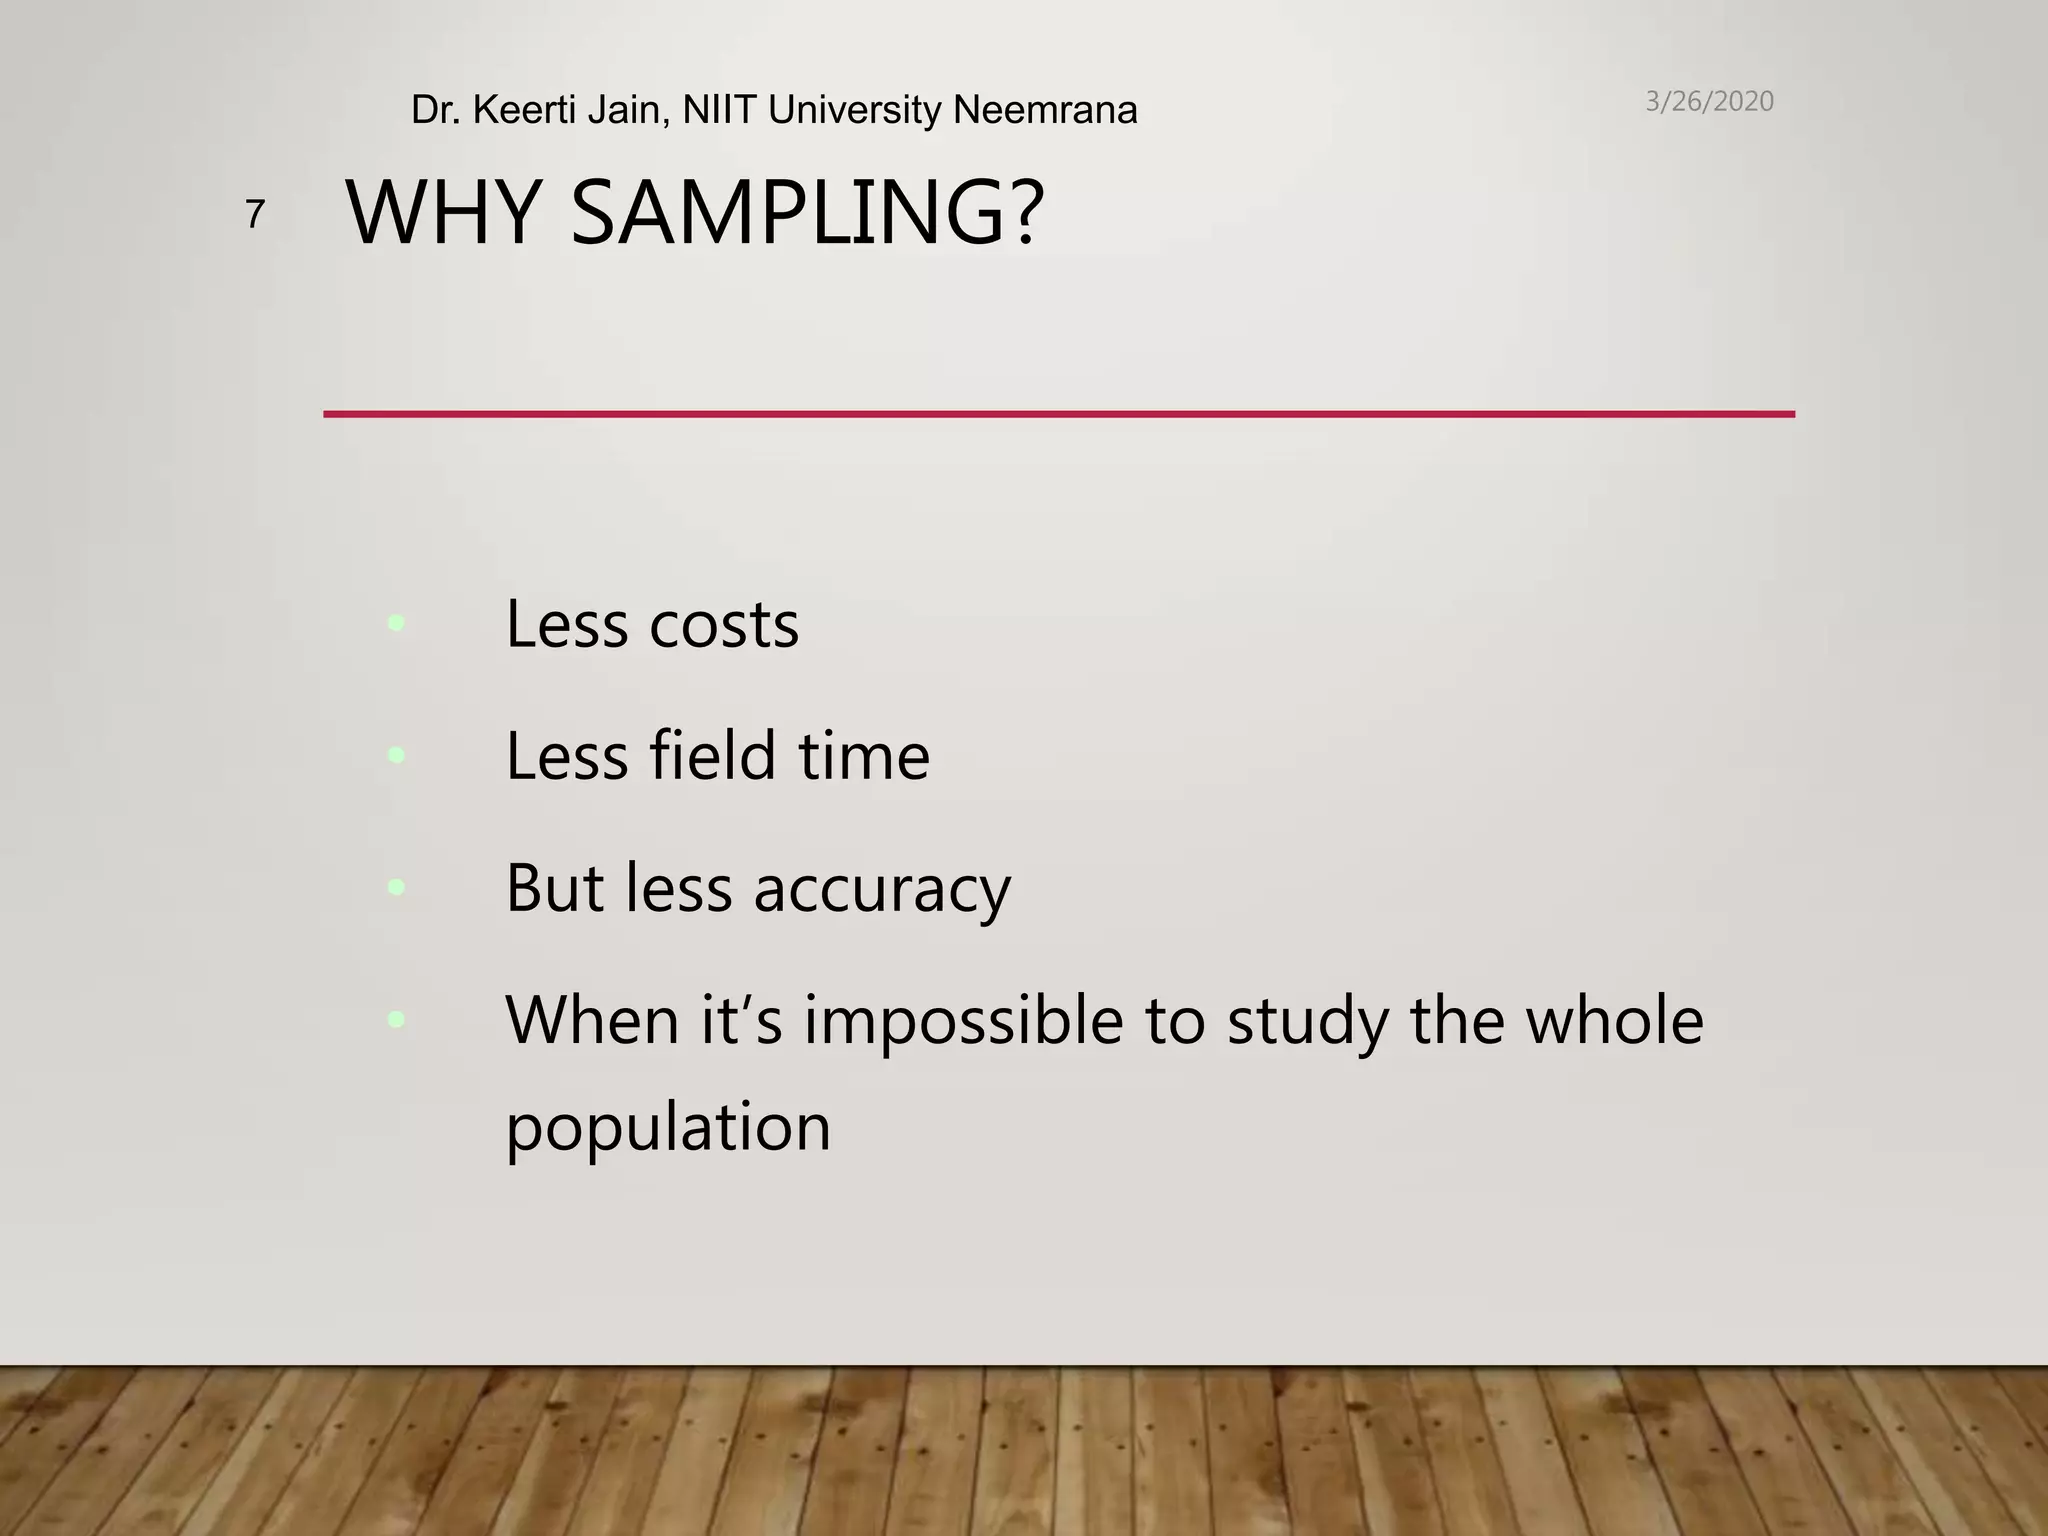
- Factors that influence sample representativeness, such as sampling procedure, sample size, and participation rate.
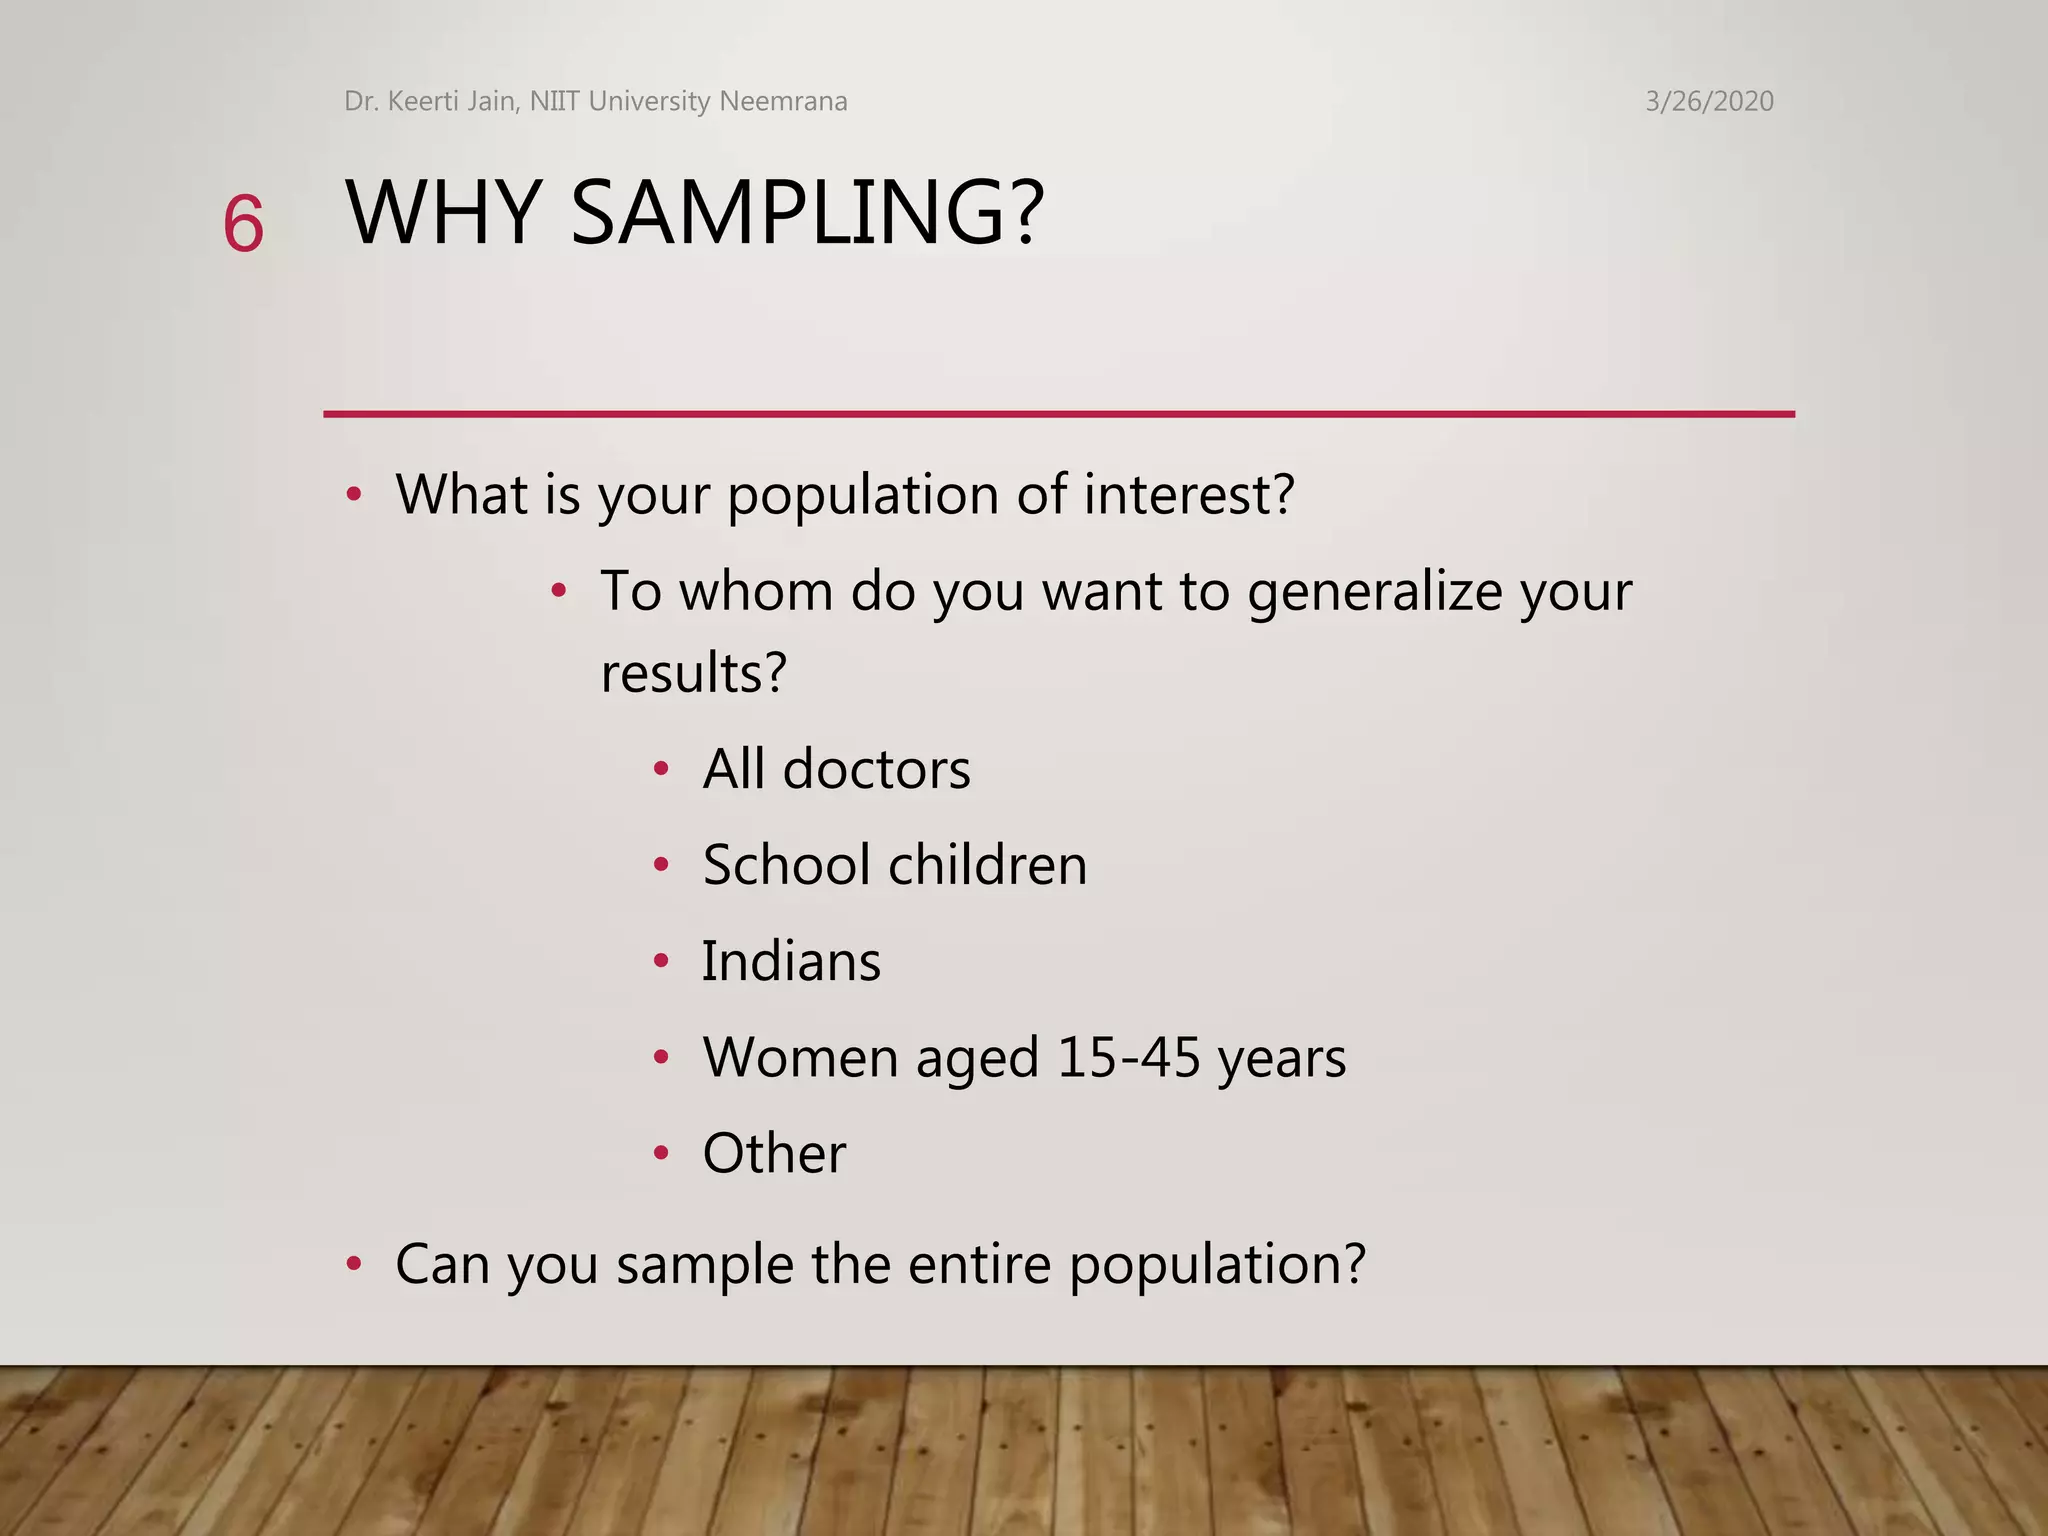
- The importance of defining the target population, sampling frame, sampling method, and determining an appropriate sample size.
- The two main types of sampling techniques - probability sampling and non-probability sampling. Probability sampling allows results to be generalized while non-probability sampling does not.
- Formulas for calculating sample sizes needed for estimating population means, comparing two independent samples, and estimating proportions.
- Examples


![ict_presentation_final_final_final[1].pptx](https://cdn.slidesharecdn.com/ss_thumbnails/ictpresentationfinalfinalfinal1-251230145259-2b4839bd-thumbnail.jpg?width=640&height=640&fit=bounds)


