Download to read offline


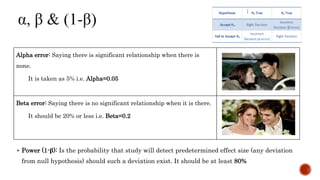

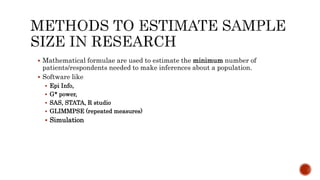


The document outlines the importance of sample size estimation in research, emphasizing the need for representative samples to ensure findings are generalizable to the population. It discusses various statistical concepts such as confidence levels, power, alpha and beta errors, and the methods available for estimation including software tools. Additionally, it highlights the significance of correct sampling techniques and the balance between sample size and data redundancy in qualitative research.