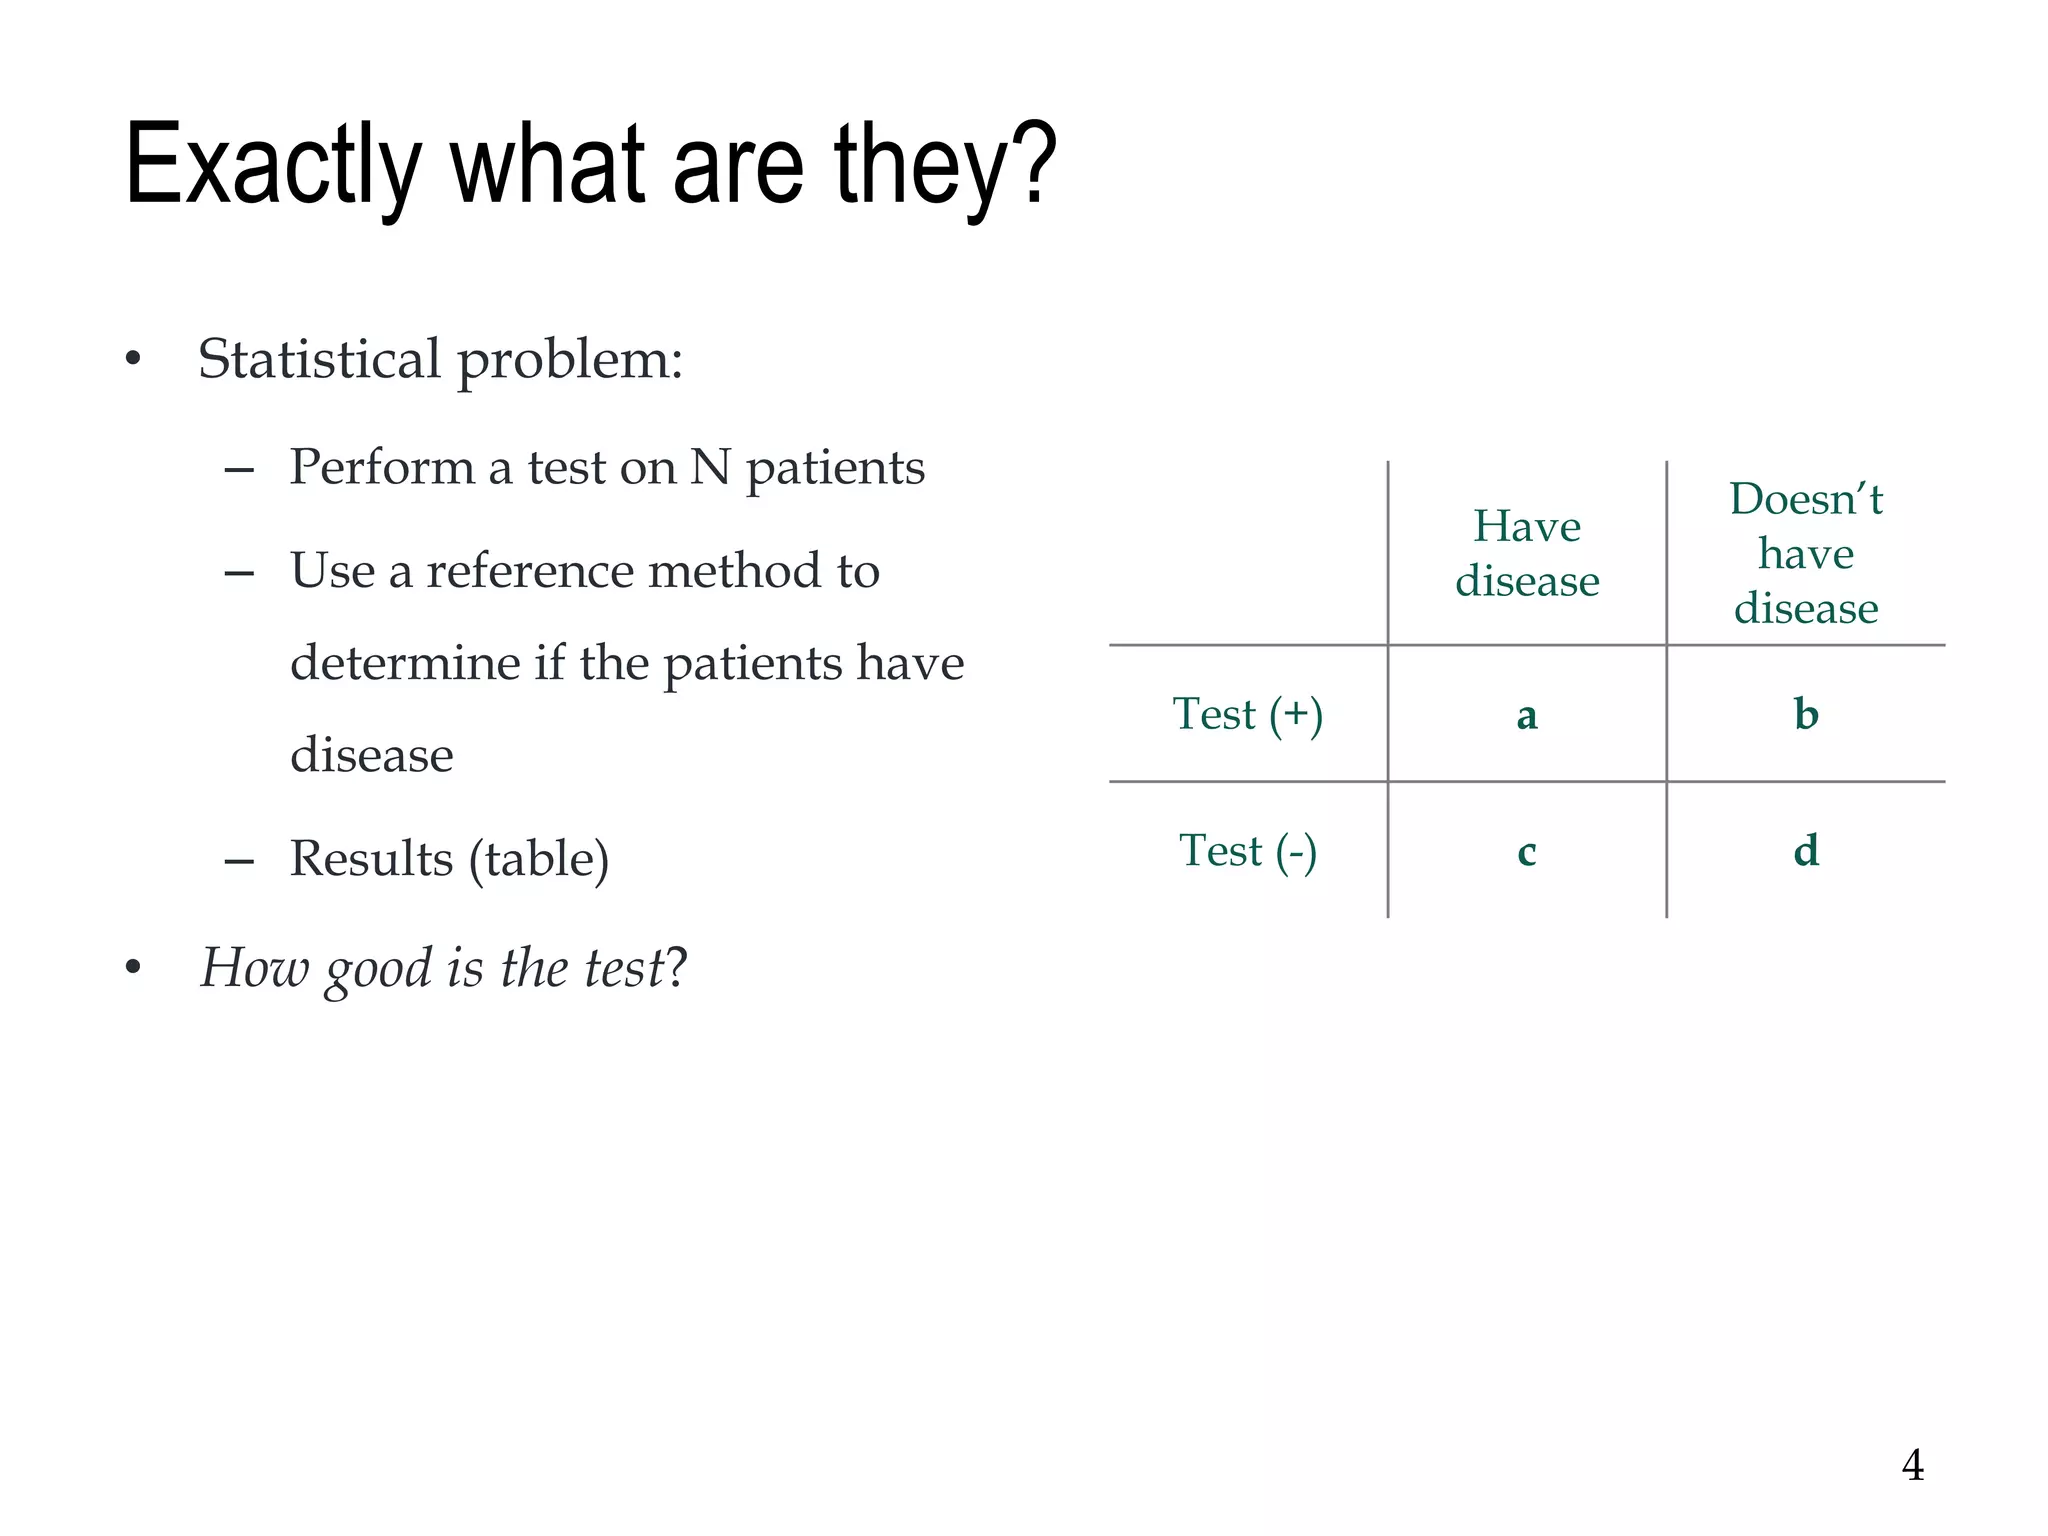
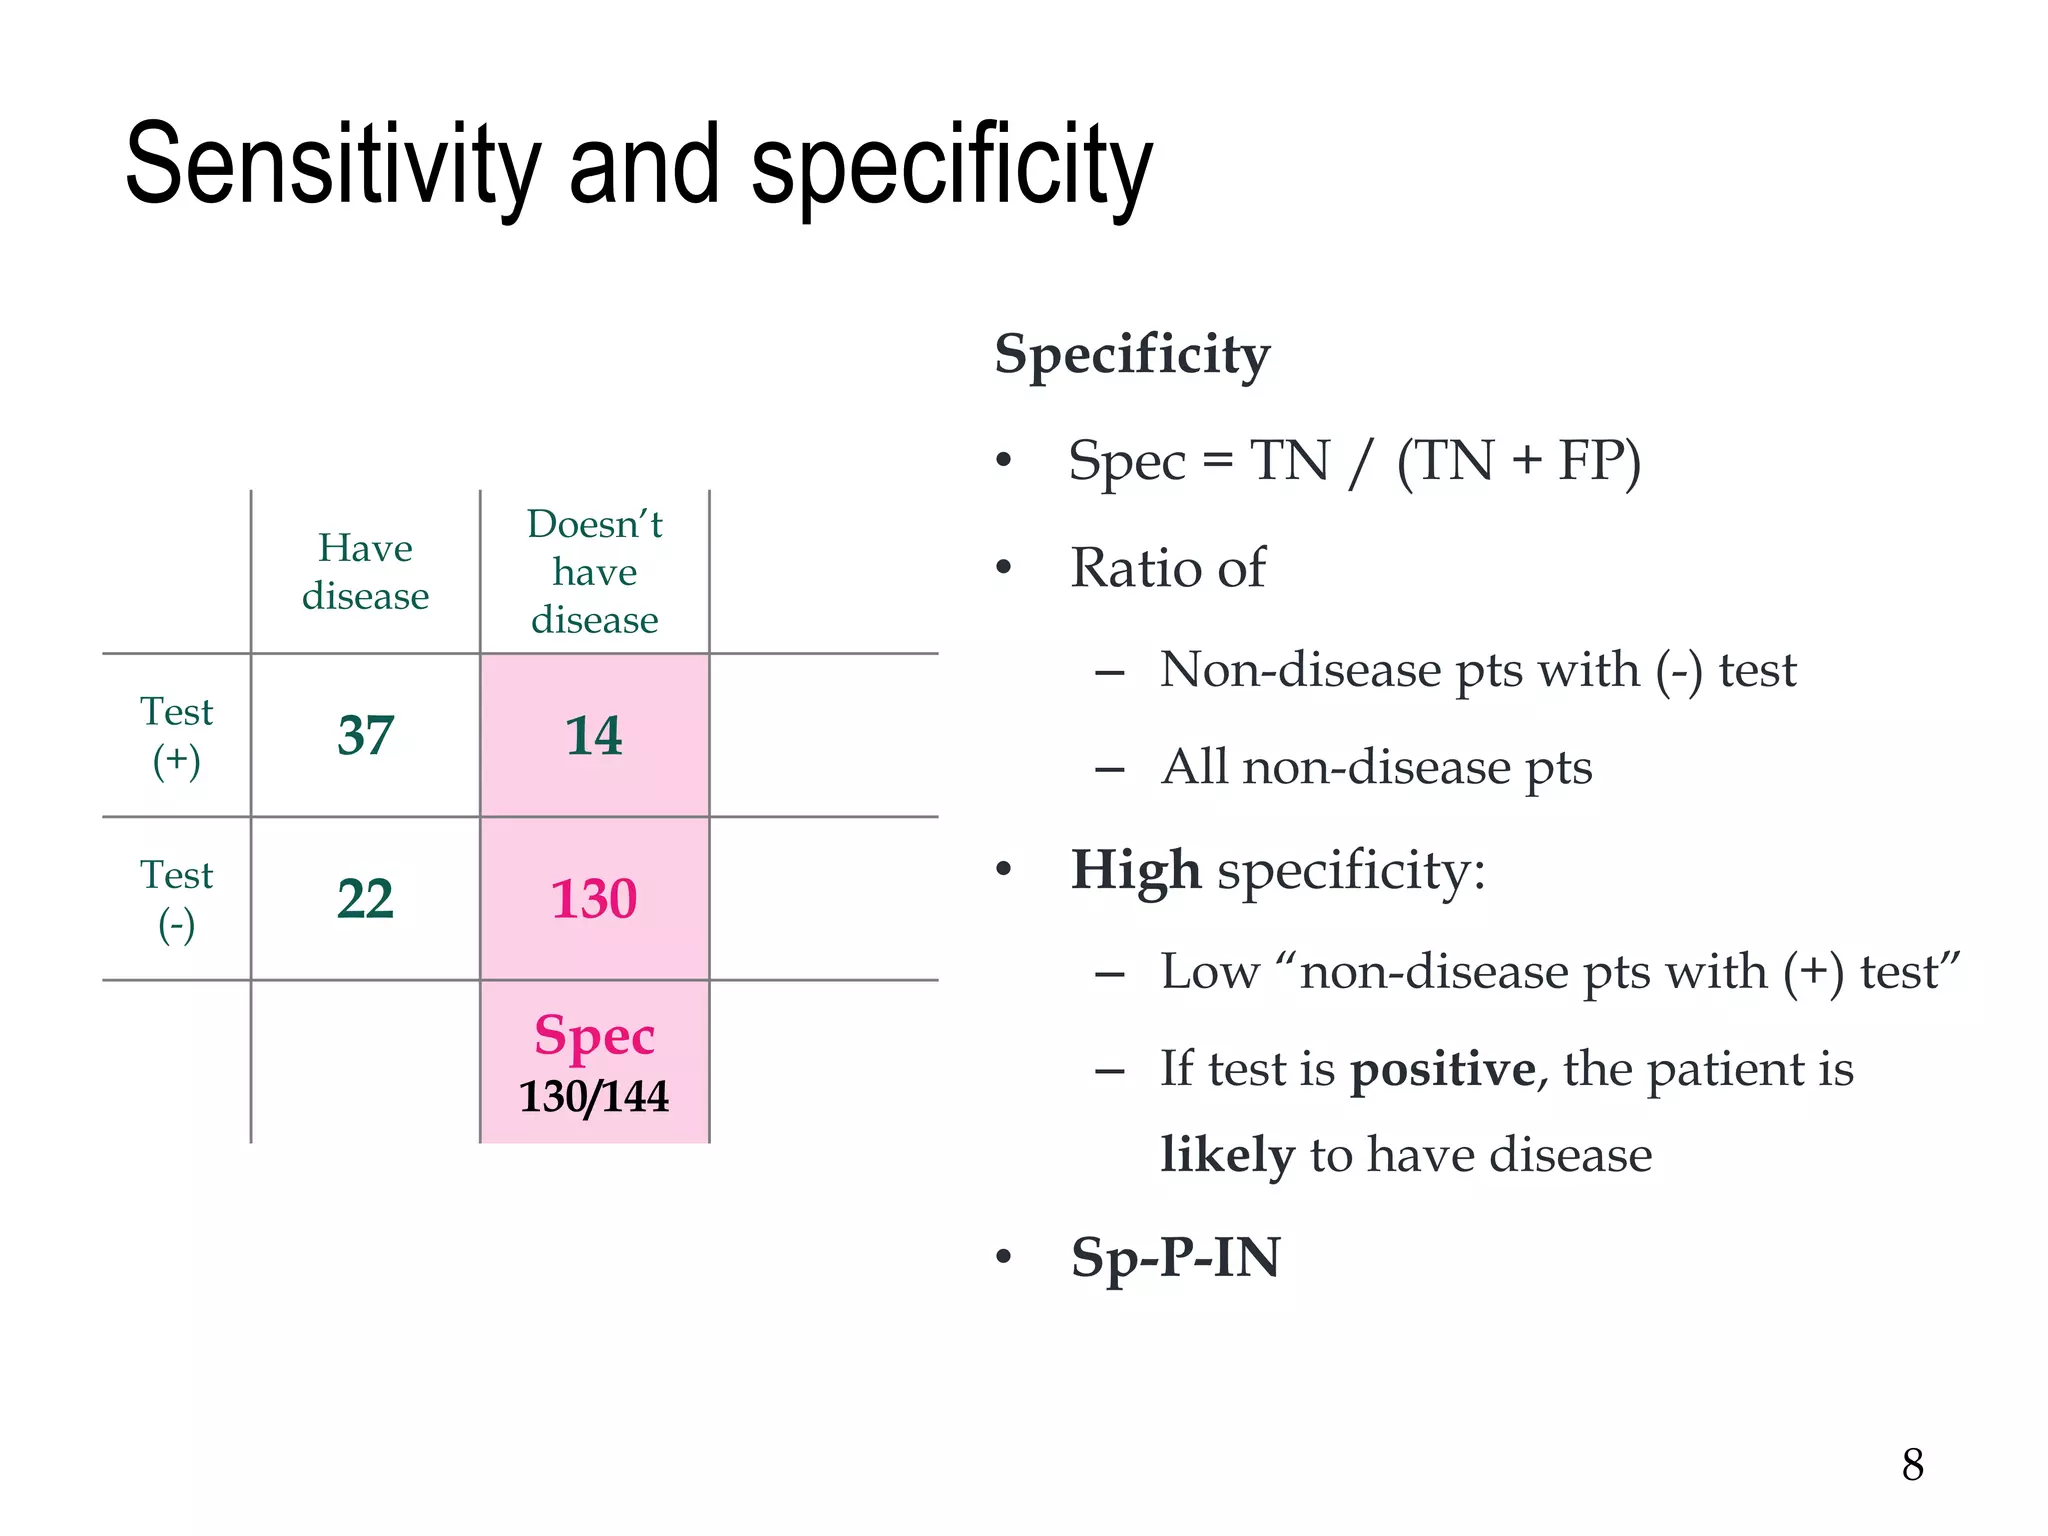
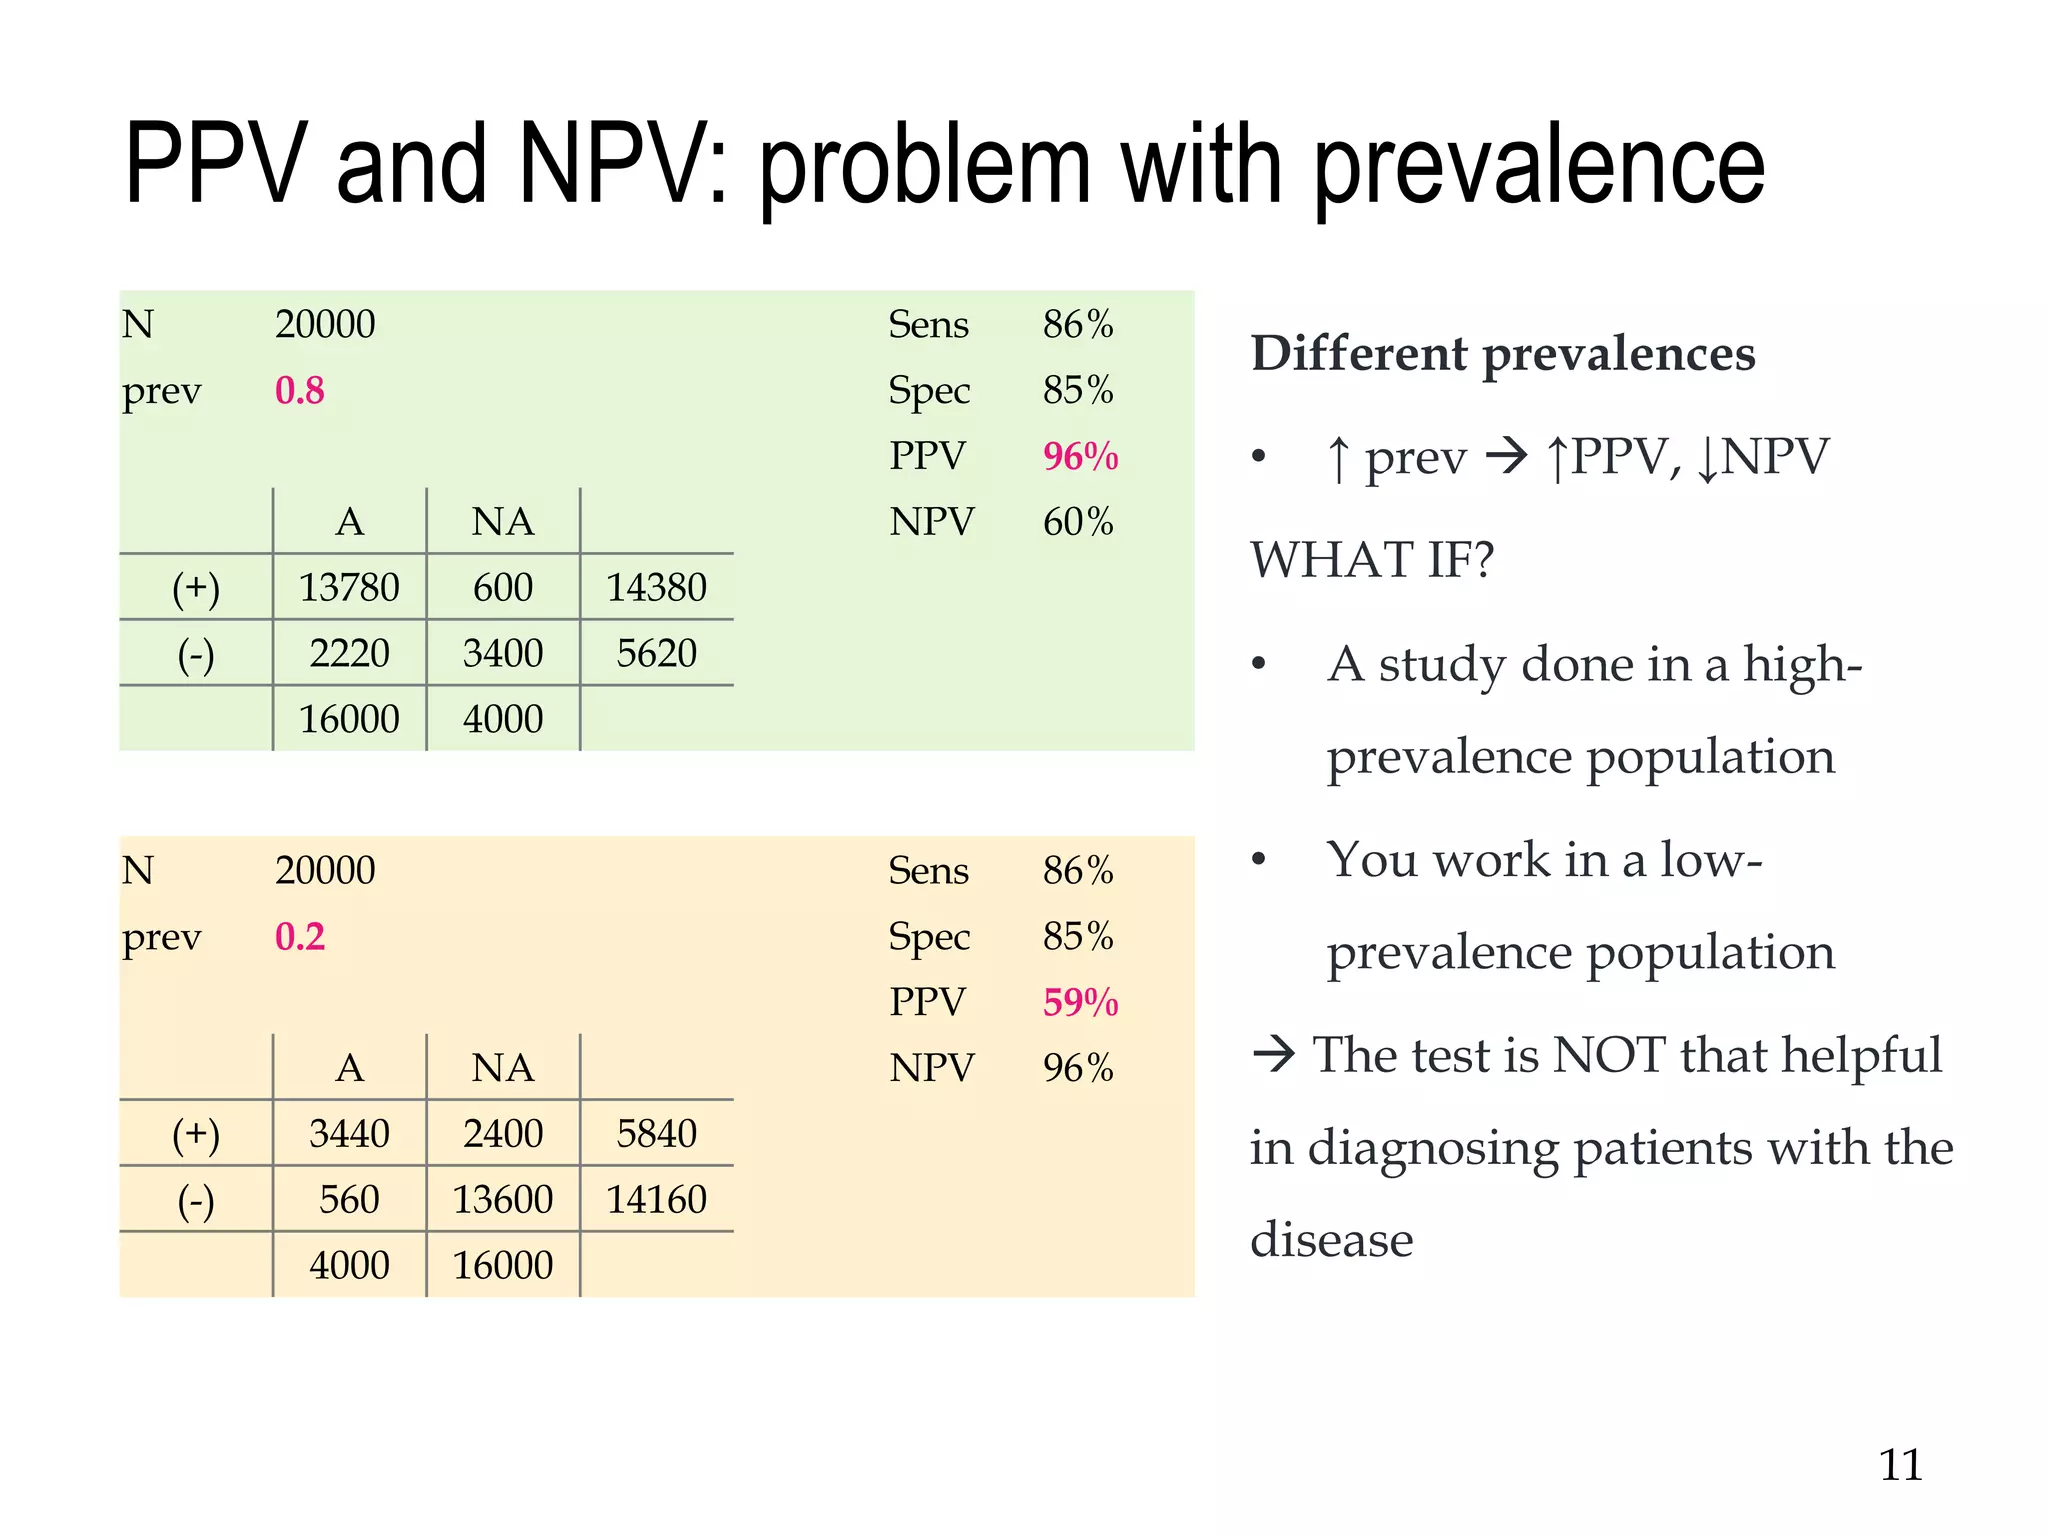
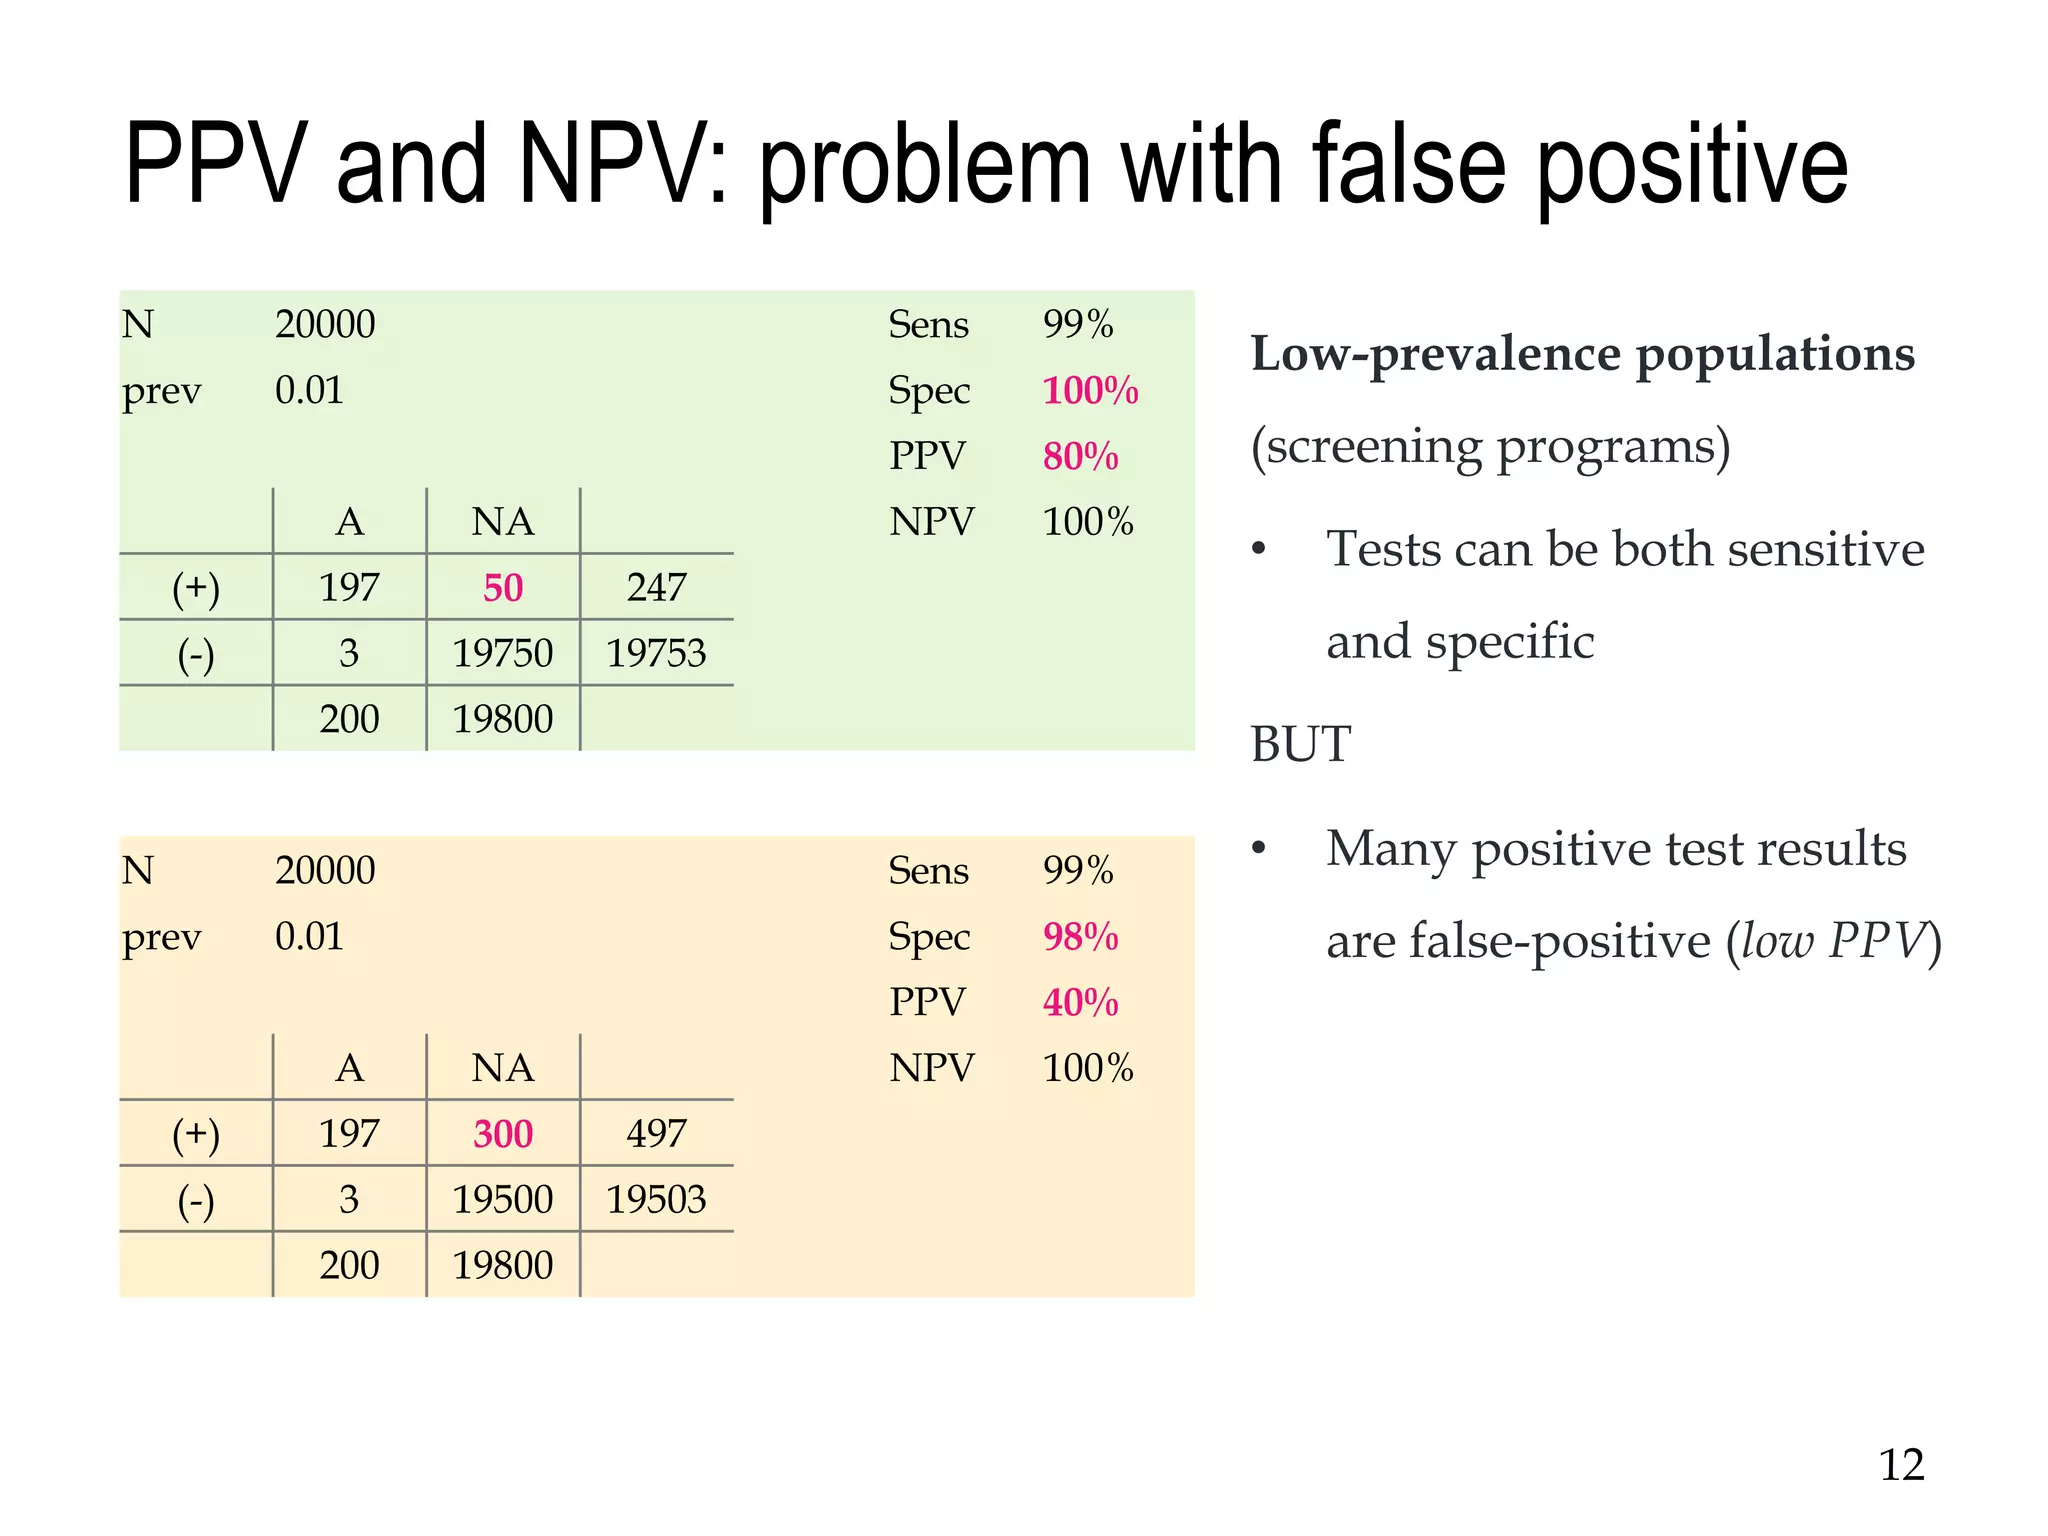
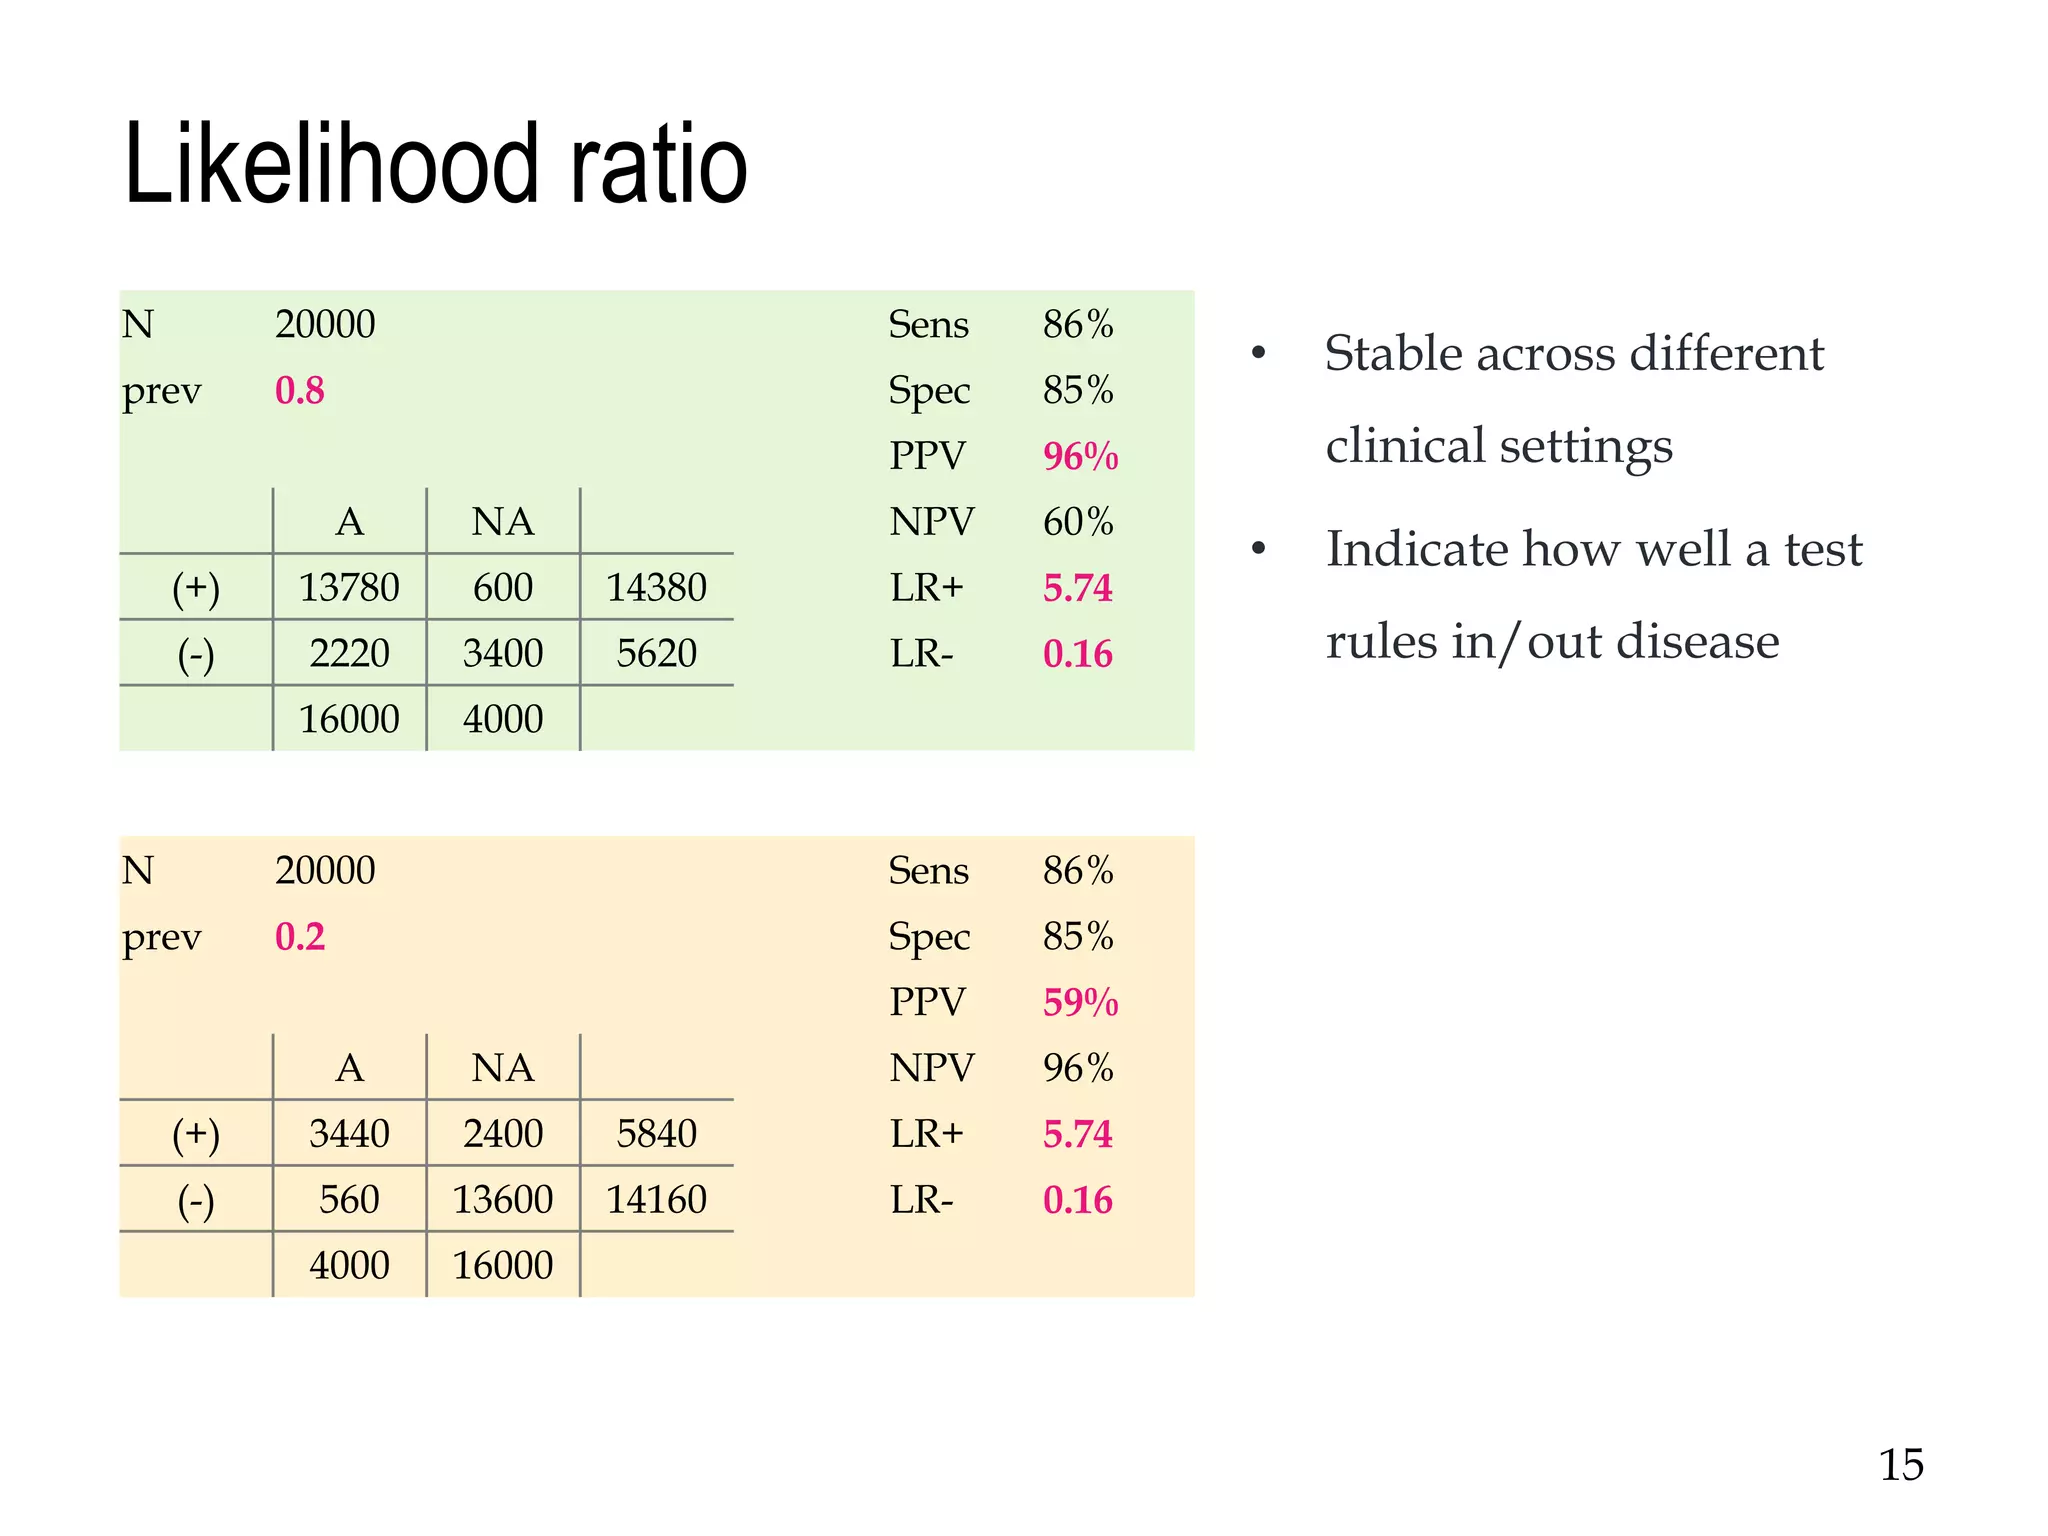
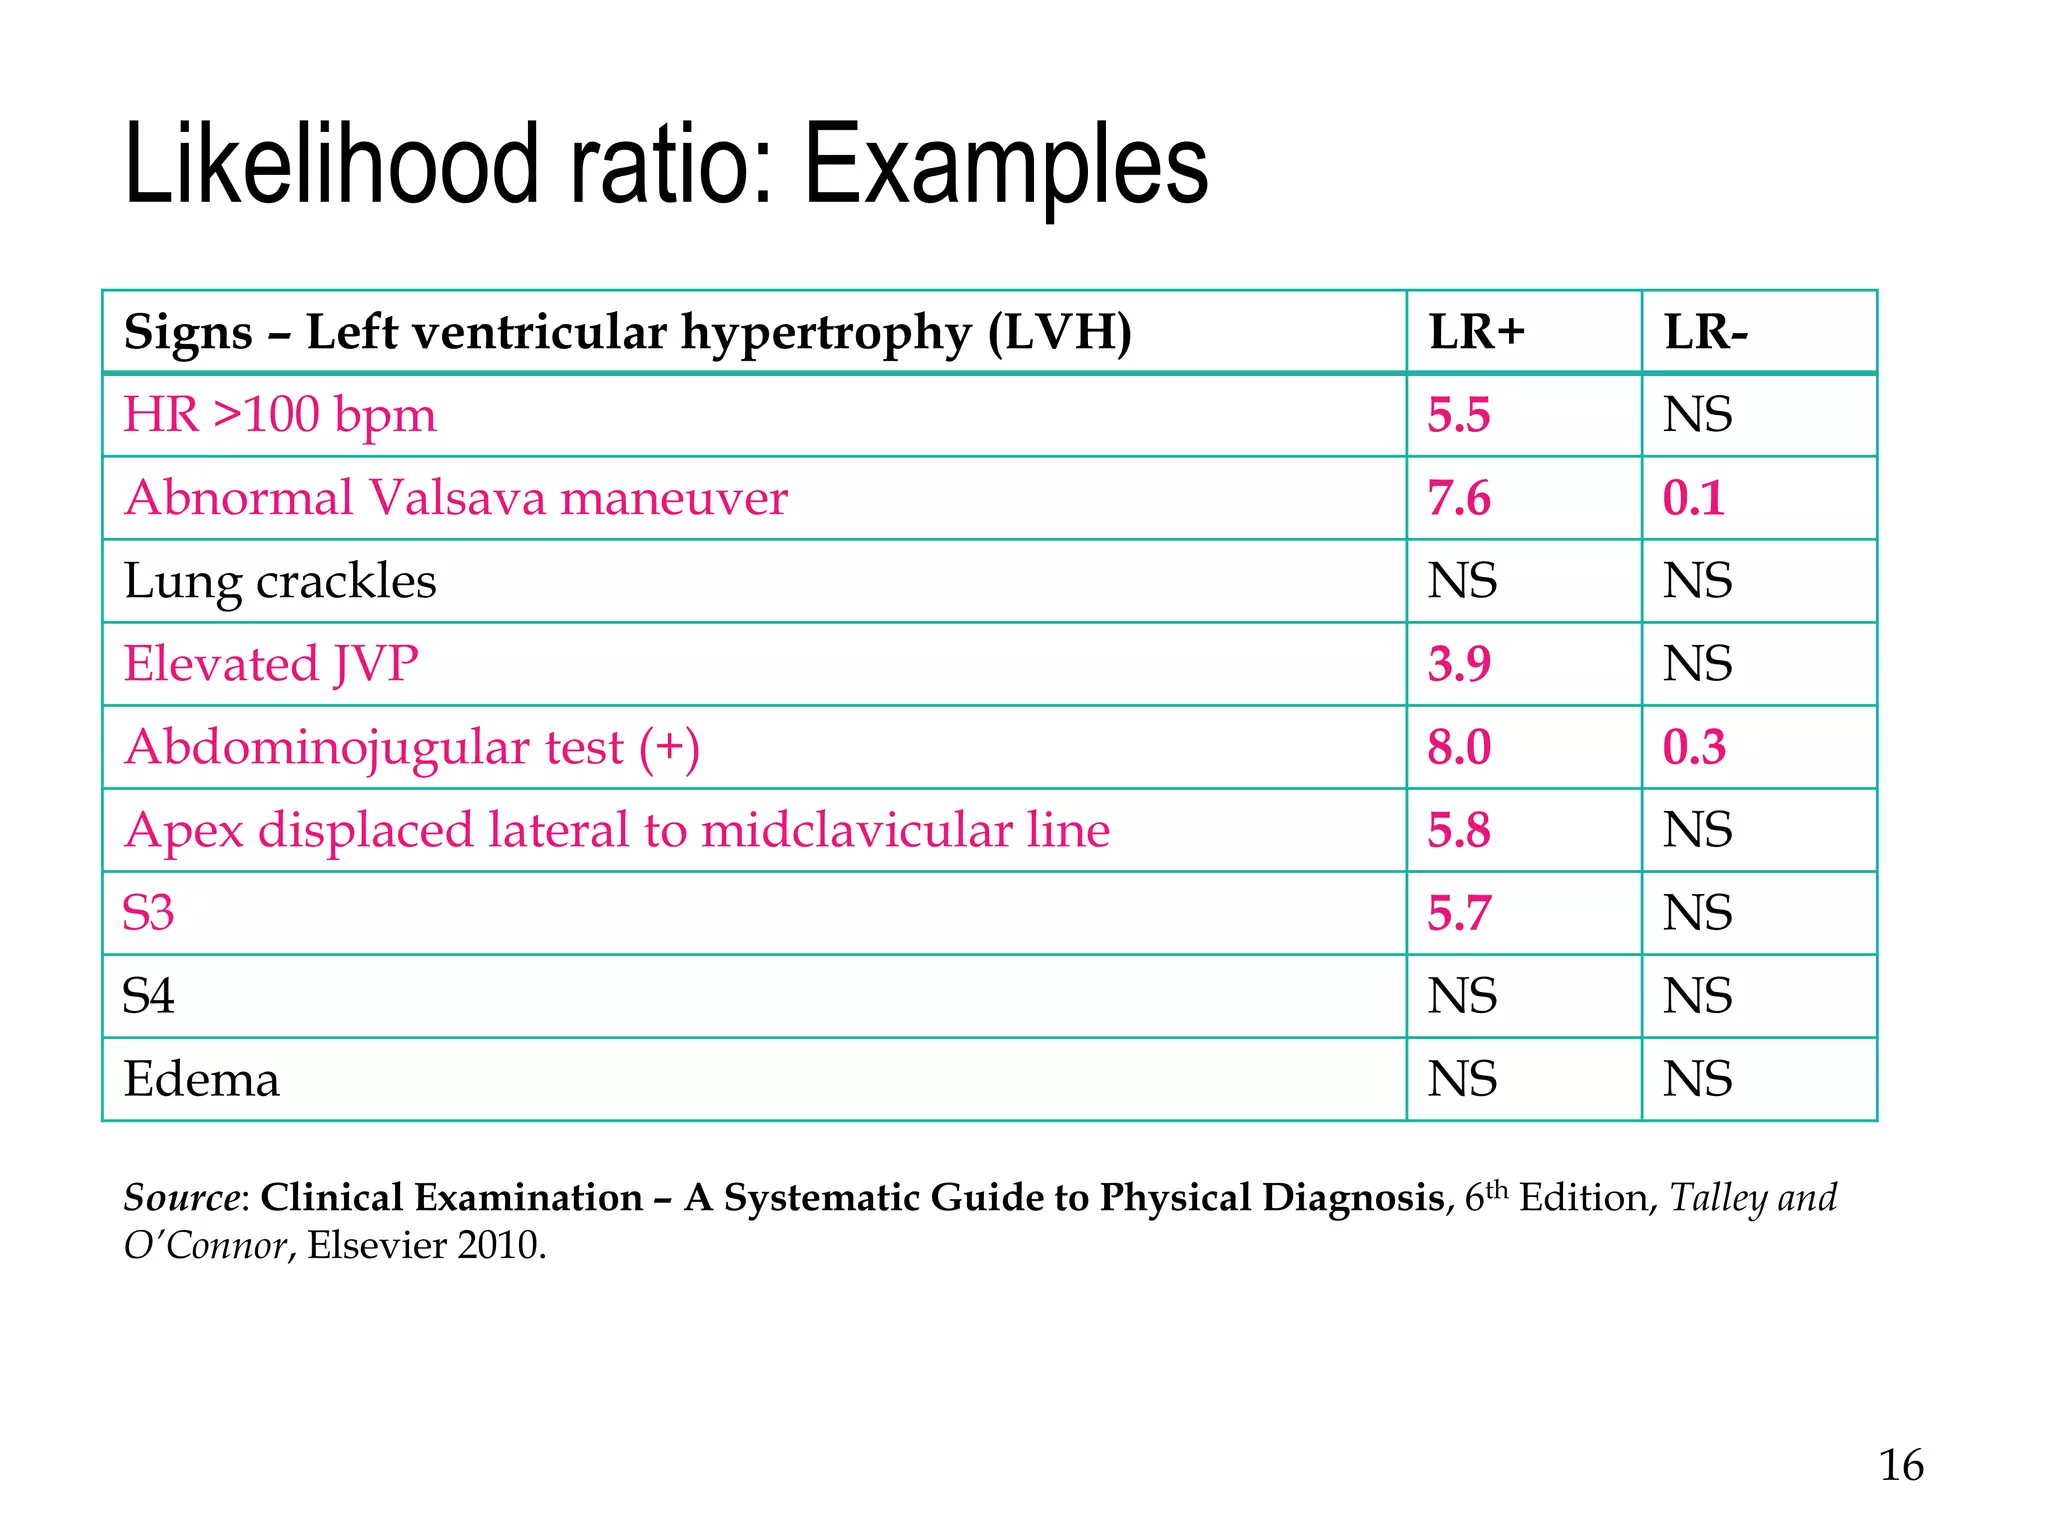
Measuring diagnostic accuracy
Hoang Bao Long, M.D.
Clincal Research Coordinator
Oxford University Clinical Research Unit - Hanoi
Introduction
• Clinical question: “Is this diagnostic method accurate?”
• Diagnosis:
– Clinical signs, maneuvers
– Laboratory tests
• “Can I use this to …”
– RULE IN: The patient suffers from a certain disease?
– RULE OUT: The patient doesn’t suffer from a certain disease?
2
Rapid HIV Tests
Source: Evaluation of the Performance Characteristics of 6 Rapid HIV Antibody Tests, Delaney
et al, Clinical Infectious Diseases 2011.
3
Exactly what are they?
• Statistical problem:
– Perform a test on N patients
– Use a reference method to
determine if the patients have
disease
– Results (table)
• How good is the test?
Have
disease
Doesn’t
have
disease
Test (+) a b
Test (-) c d
4
Basic concepts
5
Have disease Doesn’t have disease
Test (+)
TRUE POSITIVE
(TP)
FALSE POSITIVE
(FP)
Test (-)
FALSE NEGATIVE
(FN)
TRUE NEGATIVE
(TN)
Basic concepts
6
Have disease Doesn’t have disease
Test (+) 37 14
Test (-) 22 130
Sensitivity and specificity
7
Have
disease
Doesn’t
have
disease
Test
(+) 37 14
Test
(-) 22 130
Sens
37/59
Sensitivity
• Sens = TP / (TP + FN)
• Ratio of
– Disease pts with (+) test
– All disease pts
• High sensitivity:
– Low “disease pts with (-) test”
– If test is negative, the patient is
unlikely to have disease
• Sn-N-OUT
Sensitivity and specificity
8
Have
disease
Doesn’t
have
disease
Test
(+) 37 14
Test
(-) 22 130
Spec
130/144
Specificity
• Spec = TN / (TN + FP)
• Ratio of
– Non-disease pts with (-) test
– All non-disease pts
• High specificity:
– Low “non-disease pts with (+) test”
– If test is positive, the patient is
likely to have disease
• Sp-P-IN
Sensitivity and specificity
• Sens and Spec:
– Very good parameters in diagnostic studies
– Not prevalence-dependent  can be generalized
• However, a clinical physician would want to know
– If test (+): how likely the patient has the disease?  PPV
– If test (-): how likely the patient doesn’t have the disease?  NPV
9
PPV and NPV
10
Have
disease
Doesn’t
have
disease
Test
(+) 37 14 PPV
37/51
Test
(-) 22 130 NPV
130/152
𝑝𝑟𝑒𝑡𝑒𝑠𝑡 𝑝𝑟𝑜𝑏𝑎𝑏𝑖𝑙𝑖𝑡𝑦 =
𝑑𝑖𝑠𝑒𝑎𝑠𝑒
𝑡𝑜𝑡𝑎𝑙
 PPV & NPV: depend on pre-test
probability (or prevalence)
Positive predictive value (PPV)
• PPV = TP / (TP + FP)
• Ratio of
– No (+) pts with disease
– All (+) pts
Negative predictive value (NPV)
• NPV = TN / (TN + FN)
• Ratio of
– No (-) pts with no-disease
– All (-) pts
PPV and NPV: problem with prevalence
11
N 20000 Sens 86%
prev 0.8 Spec 85%
PPV 96%
A NA NPV 60%
(+) 13780 600 14380
(-) 2220 3400 5620
16000 4000
N 20000 Sens 86%
prev 0.2 Spec 85%
PPV 59%
A NA NPV 96%
(+) 3440 2400 5840
(-) 560 13600 14160
4000 16000
Different prevalences
• ↑ prev  ↑PPV, ↓NPV
WHAT IF?
• A study done in a high-
prevalence population
• You work in a low-
prevalence population
 The test is NOT that helpful
in diagnosing patients with the
disease
PPV and NPV: problem with false positive
Low-prevalence populations
(screening programs)
• Tests can be both sensitive
and specific
BUT
• Many positive test results
are false-positive (low PPV)
12
N 20000 Sens 99%
prev 0.01 Spec 100%
PPV 80%
A NA NPV 100%
(+) 197 50 247
(-) 3 19750 19753
200 19800
N 20000 Sens 99%
prev 0.01 Spec 98%
PPV 40%
A NA NPV 100%
(+) 197 300 497
(-) 3 19500 19503
200 19800
Indicate how well a test rules in/out disease
• Sens and Spec CANNOT
– High SENS + NEG: Rule OUT (SnNOUT)
– High SPEC + POS: Rule IN (SpPIN)
– Strength: not prevalence-depedent
• NPV and PPV CAN
– High PPV: Positive patients likely TO HAVE the disease
– High NPV: Negative patients likely NOT TO HAVE the disease
– Weaknesses: prevalence-depedent  in low-prevalence populations
• Not that helpful in ruling in
• Many false-positive
13
Likelihood ratio
14
Have
disease
Doesn’t
have
disease
Test
(+) 37 14
Test
(-) 22 130
Sens
37/59
1-Spec
130/144
LR+
Sens/
(1-Spec)
1-Sens
22/59
Spec
14/144
LR-
(1-Sens)/
Spec
Positive likelihood ratio (LR+)
• LR+ = Sens / (1-Spec)
• Ruling in:
– LR+ >2: good
– LR+ >10: extremely good
Negative likelihood ratio (LR-)
• LR- = (1-Sens) / Spec
• Ruling out:
– LR- <0.5: good
– LR- <0.1: extremely good
Likelihood ratio
15
N 20000 Sens 86%
prev 0.8 Spec 85%
PPV 96%
A NA NPV 60%
(+) 13780 600 14380 LR+ 5.74
(-) 2220 3400 5620 LR- 0.16
16000 4000
N 20000 Sens 86%
prev 0.2 Spec 85%
PPV 59%
A NA NPV 96%
(+) 3440 2400 5840 LR+ 5.74
(-) 560 13600 14160 LR- 0.16
4000 16000
• Stable across different
clinical settings
• Indicate how well a test
rules in/out disease
Likelihood ratio: Examples
Signs – Left ventricular hypertrophy (LVH) LR+ LR-
HR >100 bpm 5.5 NS
Abnormal Valsava maneuver 7.6 0.1
Lung crackles NS NS
Elevated JVP 3.9 NS
Abdominojugular test (+) 8.0 0.3
Apex displaced lateral to midclavicular line 5.8 NS
S3 5.7 NS
S4 NS NS
Edema NS NS
16
Source: Clinical Examination – A Systematic Guide to Physical Diagnosis, 6th Edition, Talley and
O’Connor, Elsevier 2010.
References
1. Evidence-based Practice Across the Health Professional, 1st Edition,
Hoffmann, Elsevier 2010.
2. Evidence-based Medicine – How to Practice and Teach It, 4th
Edition, Straus, Elsevier 2011.
– Pre-test odds, post-test odds
– Pre-test probability, post-test probability
– ROC curve
17
THE END
Thank you for listening!

Measuring Diagnostic Accuracy

  • 1.
    Measuring diagnostic accuracy HoangBao Long, M.D. Clincal Research Coordinator Oxford University Clinical Research Unit - Hanoi
  • 2.
    Introduction • Clinical question:“Is this diagnostic method accurate?” • Diagnosis: – Clinical signs, maneuvers – Laboratory tests • “Can I use this to …” – RULE IN: The patient suffers from a certain disease? – RULE OUT: The patient doesn’t suffer from a certain disease? 2
  • 3.
    Rapid HIV Tests Source:Evaluation of the Performance Characteristics of 6 Rapid HIV Antibody Tests, Delaney et al, Clinical Infectious Diseases 2011. 3
  • 4.
    Exactly what arethey? • Statistical problem: – Perform a test on N patients – Use a reference method to determine if the patients have disease – Results (table) • How good is the test? Have disease Doesn’t have disease Test (+) a b Test (-) c d 4
  • 5.
    Basic concepts 5 Have diseaseDoesn’t have disease Test (+) TRUE POSITIVE (TP) FALSE POSITIVE (FP) Test (-) FALSE NEGATIVE (FN) TRUE NEGATIVE (TN)
  • 6.
    Basic concepts 6 Have diseaseDoesn’t have disease Test (+) 37 14 Test (-) 22 130
  • 7.
    Sensitivity and specificity 7 Have disease Doesn’t have disease Test (+)37 14 Test (-) 22 130 Sens 37/59 Sensitivity • Sens = TP / (TP + FN) • Ratio of – Disease pts with (+) test – All disease pts • High sensitivity: – Low “disease pts with (-) test” – If test is negative, the patient is unlikely to have disease • Sn-N-OUT
  • 8.
    Sensitivity and specificity 8 Have disease Doesn’t have disease Test (+)37 14 Test (-) 22 130 Spec 130/144 Specificity • Spec = TN / (TN + FP) • Ratio of – Non-disease pts with (-) test – All non-disease pts • High specificity: – Low “non-disease pts with (+) test” – If test is positive, the patient is likely to have disease • Sp-P-IN
  • 9.
    Sensitivity and specificity •Sens and Spec: – Very good parameters in diagnostic studies – Not prevalence-dependent  can be generalized • However, a clinical physician would want to know – If test (+): how likely the patient has the disease?  PPV – If test (-): how likely the patient doesn’t have the disease?  NPV 9
  • 10.
    PPV and NPV 10 Have disease Doesn’t have disease Test (+)37 14 PPV 37/51 Test (-) 22 130 NPV 130/152 𝑝𝑟𝑒𝑡𝑒𝑠𝑡 𝑝𝑟𝑜𝑏𝑎𝑏𝑖𝑙𝑖𝑡𝑦 = 𝑑𝑖𝑠𝑒𝑎𝑠𝑒 𝑡𝑜𝑡𝑎𝑙  PPV & NPV: depend on pre-test probability (or prevalence) Positive predictive value (PPV) • PPV = TP / (TP + FP) • Ratio of – No (+) pts with disease – All (+) pts Negative predictive value (NPV) • NPV = TN / (TN + FN) • Ratio of – No (-) pts with no-disease – All (-) pts
  • 11.
    PPV and NPV:problem with prevalence 11 N 20000 Sens 86% prev 0.8 Spec 85% PPV 96% A NA NPV 60% (+) 13780 600 14380 (-) 2220 3400 5620 16000 4000 N 20000 Sens 86% prev 0.2 Spec 85% PPV 59% A NA NPV 96% (+) 3440 2400 5840 (-) 560 13600 14160 4000 16000 Different prevalences • ↑ prev  ↑PPV, ↓NPV WHAT IF? • A study done in a high- prevalence population • You work in a low- prevalence population  The test is NOT that helpful in diagnosing patients with the disease
  • 12.
    PPV and NPV:problem with false positive Low-prevalence populations (screening programs) • Tests can be both sensitive and specific BUT • Many positive test results are false-positive (low PPV) 12 N 20000 Sens 99% prev 0.01 Spec 100% PPV 80% A NA NPV 100% (+) 197 50 247 (-) 3 19750 19753 200 19800 N 20000 Sens 99% prev 0.01 Spec 98% PPV 40% A NA NPV 100% (+) 197 300 497 (-) 3 19500 19503 200 19800
  • 13.
    Indicate how wella test rules in/out disease • Sens and Spec CANNOT – High SENS + NEG: Rule OUT (SnNOUT) – High SPEC + POS: Rule IN (SpPIN) – Strength: not prevalence-depedent • NPV and PPV CAN – High PPV: Positive patients likely TO HAVE the disease – High NPV: Negative patients likely NOT TO HAVE the disease – Weaknesses: prevalence-depedent  in low-prevalence populations • Not that helpful in ruling in • Many false-positive 13
  • 14.
    Likelihood ratio 14 Have disease Doesn’t have disease Test (+) 3714 Test (-) 22 130 Sens 37/59 1-Spec 130/144 LR+ Sens/ (1-Spec) 1-Sens 22/59 Spec 14/144 LR- (1-Sens)/ Spec Positive likelihood ratio (LR+) • LR+ = Sens / (1-Spec) • Ruling in: – LR+ >2: good – LR+ >10: extremely good Negative likelihood ratio (LR-) • LR- = (1-Sens) / Spec • Ruling out: – LR- <0.5: good – LR- <0.1: extremely good
  • 15.
    Likelihood ratio 15 N 20000Sens 86% prev 0.8 Spec 85% PPV 96% A NA NPV 60% (+) 13780 600 14380 LR+ 5.74 (-) 2220 3400 5620 LR- 0.16 16000 4000 N 20000 Sens 86% prev 0.2 Spec 85% PPV 59% A NA NPV 96% (+) 3440 2400 5840 LR+ 5.74 (-) 560 13600 14160 LR- 0.16 4000 16000 • Stable across different clinical settings • Indicate how well a test rules in/out disease
  • 16.
    Likelihood ratio: Examples Signs– Left ventricular hypertrophy (LVH) LR+ LR- HR >100 bpm 5.5 NS Abnormal Valsava maneuver 7.6 0.1 Lung crackles NS NS Elevated JVP 3.9 NS Abdominojugular test (+) 8.0 0.3 Apex displaced lateral to midclavicular line 5.8 NS S3 5.7 NS S4 NS NS Edema NS NS 16 Source: Clinical Examination – A Systematic Guide to Physical Diagnosis, 6th Edition, Talley and O’Connor, Elsevier 2010.
  • 17.
    References 1. Evidence-based PracticeAcross the Health Professional, 1st Edition, Hoffmann, Elsevier 2010. 2. Evidence-based Medicine – How to Practice and Teach It, 4th Edition, Straus, Elsevier 2011. – Pre-test odds, post-test odds – Pre-test probability, post-test probability – ROC curve 17
  • 18.
    THE END Thank youfor listening!