Presentation1.pptx, radiological imaging of gout disease.
•Download as PPTX, PDF•
31 likes•6,714 views

This document summarizes the radiological imaging findings of gout. It describes how plain radiographs, ultrasound, CT, and MRI can be used to detect features of gout such as tophi, bone erosions, and synovitis. Plain radiographs are often normal in early disease but can detect chronic changes like tophi and erosions. Ultrasound is more sensitive for bone erosions and can detect changes earlier. CT and MRI allow visualization of tophi and can detect bone erosions and edema earlier than plain films. The document includes examples of imaging findings from different modalities.

Recommended
Recommended
More Related Content
What's hot
What's hot (20)
Viewers also liked
Viewers also liked (14)
Similar to Presentation1.pptx, radiological imaging of gout disease.
Similar to Presentation1.pptx, radiological imaging of gout disease. (20)
More from Abdellah Nazeer
More from Abdellah Nazeer (20)
Recently uploaded
Recently uploaded (20)
Presentation1.pptx, radiological imaging of gout disease.
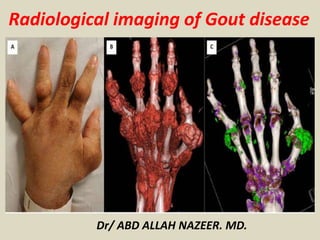
- 1. Dr/ ABD ALLAH NAZEER. MD. Radiological imaging of Gout disease
- 2. Gout is a crystal arthropathy due to deposition of monosodium urate crystals in and around the joints. Epidemiology Typically occurs in those above 40 years. There is a strong male predilection of 20:1. Pathology Characterised by monosodium urate crystals (negatively birefringent) deposition in periarticular soft tissues. The synovial fluid is generally a poor solvent for monosodium urate and therefore causes crystallization at low temperatures. The crystals are chemotactic and activate complement. There are five recognised stages of gout: asymptomatic hyperuricaemia acute gouty arthritis intercritical gout (between acute attacks) chronic tophaceous gout gouty nephropathy
- 3. Risk factors obesity hyperuricaemia: only a small proportion of hyper uricaemic patients develop gout and often takes 20-30 years to develop alcohol intake myeloproliferative disorders chemotherapy Lesch-Nyhan syndrome medications thiazides hyperparathyroidism Location Usually has an asymmetrical polyarticular distribution: joints: 1st MTP joint most common (known as podagra when it involves this joint); hands and feet are also common less common: bones, tendon, bursa
- 4. IMAGING TECHNIQUES IN GOUT 1. Plain radiographs Evaluation and monitoring skeletal and soft tissue changes in gout has been based on plain radiographs. Plain radiographic features of chronic tophaceous gout include visualization of tophi as soft-tissue or intraosseous masses and nondemineralizing erosive arthropathy with erosions that are well defined with sclerotic or overhanging margins. Extra-articular erosions and intraosseous calcifications can also be seen. The joint space is preserved until advanced disease. During the first gouty attack, plain radiographs only demonstrate soft tissue swelling, the features described above are only detected on advanced stages (typically 15 years after the onset of the disease). Early identification of bone and joint affection as well as early treatment could improve the prognosis because it has been shown that severe disease is strongly associated with loss of functional capacity. As bone alterations and tophi occur before they are detectable on plain radiographs, other techniques capable of detecting alterations in earlier stages are necessary. In this way, a study has demonstrated that 56% of patients with gout showed alterations on advanced imaging techniques (US, CT, MRI) that were undetectable on plain radiographs.
- 5. 2. Ultrasound US can detect bone erosions three times more frequent than plain radiographs and also changes in early stages. Recent studies suggest that US is more sensible but less specific than plain radiographs. Apart form that, US can guide the puncture of tophi and aspiration of synovial liquid. Ultrasonography findings in gout include: Double-contour sign: hyperechoic and irregular band over the superficial margin of the joint cartilage, produced by the deposition of UMS crystals on the surface of hyaline cartilage of the joint which increases its thickness. Hyperechoic cloudy areas in the synovial. Bone erosions, defined in US as interruptions of the hyperechoic surface of bone, visible in two perpendicular planes. Tophi. Increased power Doppler signal in the synovium can differentiate active from inactive inflammation. 3. Computed Tomography Computed tomography (CT) allows visualization of both articular and subcutaneous tophi as masses of around 170 Hounsfield units density, this makes it possible to distinguish them from other nodules. CT is superior to MRI and plain radiograph in the detection of bone erosions and can play a role in guiding aspiration of synovial liquid and other noninvasive procedures.
- 6. Magnetic Resonance Imaging Although findings are nonspecific, Magnetic Resonance Imaging (MRI) allows early detection of tophi and bone erosions in asymptomatic gout even when plain radiograph shows no alterations. Bone edema, synovial involvement, enhancement after Gadolinium and joint effusion can also be assessed. Possible complications such as menisci tears or ligamentous sprain can also be evaluated. However, gout features are very variable and can mimic a tumor or infection. This is why it is important to know its radiologic appearance not only to monitored evolution but also to detect gout in asymptomatic patients. Surprisingly, few studies in literature describe the features of gout in MRI. In this work we describe the spectrum of MRI findings in patients with tophaceous gout. Tophi. Tophi are defined as amorphous aggregates of urate crystals and protein matrix surrounded by inflammatory tissue. In MRI they appear as soft tissue masses of variable signal en T2 weighted images, frequently heterogeneous and of low signal. In T1 weighted images they are homogeneous and hypointense. They may show peripheral or nodular enhancement due to increased vascularization and granulomatous tissue. Tophi can appear anywhere in the joint, and can be identified in intrasynovial, intraosseous, intratendinous or intraligamentous locations as well as in para-articular extraligamentous situation.
- 7. Synovitis Synovitis is defined as an area in the synovial compartment that shows above normal post-gadolinium enhancement of a thickness greater than the width of the normal synovium (enhancement is judged by comparison of T1 weighted images obtained before and after intravenous gadolinium contrast). When no alteration of the synovium is present, synovial membrane appears to be very thin and can not be seen. After gadolinium administration normal synovium shows very thin enhancement. In our study we consider the synovial thickness to be normal when it is less than 1mm and linear enhancement is seen. Pathologic synovium is considered when it is greater than 2mm or has nodular foci of increased synovial thickness and enhances after gadolinium. Synovial signal in tophaceous gout is variable but it normally appears as intermediate to low signal in T2 weighted images.
- 8. Bone erosions Bone erosions in MRI are defined as sharply marginated bone lesions, with correct juxta-articular localization and typical signal characteristics, which are visible in two planes with a cortical break seen in at least one plane. Bone erosions in gout are para-articular and show sclerosing edges and overhanging osteophytes. Joint effusion In normal conditions, little amount of intraarticular liquid can be seen in healthy knees. We consider joint effusion to exist when liquid in suprapatellar recess is greater than 1cm. Bone edema Bone edema is defined as a lesion within the trabecular bone, with ill defined margins and signal characteristics consistent with increased water content. MRI allows detection of associated disease (i.e. menisci tear) that although not specific of gout, is frequent in this population.
- 9. Oblique foot radiograph shows multiple erosions (arrows) and soft-tissue tophi (asterisks). Note also characteristic overhanging edges and sclerotic margins involving some of these erosions. Ultrasound image of first metatarsophalangeal joint shows erosion (arrows) with cortical discontinuity, irregularity, and peripheral overhanging edge. Note echogenic synovitis (asterisks) and multiple hyperechoic foci (arrowheads) from monosodium urate crystal deposition.
- 10. Radiograph of the foot in a patient with chronic gout. Sclerosis and joint-space narrowing are seen in the first metatarsophalangeal joint, as well as in the fourth interphalangeal joint.
- 11. Typical tophaceous gout of the foot with polyarticular punched-out erosions and eccentric tophi
- 12. Radiograph of the hand. On this image of chronic tophaceous gouty arthritis, extensive bony erosions are noted throughout the carpal bones. Urate depositions may be present in the periarticular areas.
- 13. Ball–catcher’s radiograph of the hands shows polyarticular punched-out peri-articular erosions with multiple eccentric nodular soft tissue swelling consistent with chronic tophaceous gout. There is bilateral asymmetric joint involvement with varying degree of severity.
- 14. Gout appears as radiolucent bone erosions around Joints Soft tissue swelling and inflammation present.
- 15. Radiograph of second and third digits shows punched-out peri-articular erosions.
- 17. (a) Anteroposterior and (b) lateral radiographs of the right elbow in a gout patient show multiple intradermal urate deposits (arrows).
- 18. Bilateral knee radiograph in anteroposterior projection shows multiple tophi deposits in the medial collateral ligament (blue arrows), lateral collateral ligament (red arrows) and ilio tibial tract bursa (yellow arrows) on both sides.
- 19. Gouty inflammation of Achilles tendon. a-b Longitudinal US images of the right Achilles tendon show cloudy hyperechoic areas (arrowheads) and stippled bright foci (arrows) representing monosodium urate deposits at the Achilles tendon (triangles). b Color Doppler US reveals inflammatory hypervascularisation in and around the tendon. c X-ray of the right calcaneous in lateral projection shows spindle-shaped thickening of the Achilles tendon (arrowheads),
- 20. Gouty arthritis of the left MTP-I joint. a Longitudinal US image at the region of the MTP-I joint reveals a hyperechoic cloudy area representing monosodium urate deposits within the thickened synovia (arrows). Osteophytes at the joint margins indicate arthrosis (arrowheads). b Various color Doppler signals within the synovia are due to inflammation. X-rays in PA (c) and oblique projection (d) demonstrate signs of arthrosis (arrows), as well as cloudy soft-tissue opacification (arrowheads)
- 21. Gouty monoarthritis of the proximal interphalangeal (PIP) joint of the right index finger. A Longitudinal US image at the region of the PIP-II joint reveals bright stippled foci (arrows) and hyperechoic aggregates (arrowheads) representing monosodium urate deposits within the thickened hypoechoic synovia and the joint space. Osseous erosion is also visible (thick arrow). b Multiple color Doppler signals within the synovia indicate considerable inflammation. X-rays in PA (c) and oblique projection (d) demonstrate osseous erosion (arrowhead) with a tiny calcification and an osteophyte at the margin of the erosion (arrow) suggesting gout.
- 22. Gouty arthritis of the right MTPI joint. a Longitudinal US image at the region of the MTP-I joint reveals bright stippled foci (arrows) representing monosodium urate deposits within the thickened hypoechoic synovia. b Multiple color Doppler signals within the synovia and surrounding tissue indicate considerable inflammation. X-rays in PA (c) and oblique projection (d) demonstrate signs of mild arthrosis at the MTP-I joint but no specific sign of gout
- 23. Gouty arthritis of the left knee. A Transverse US image laterally to the patella shows moderate echofree joint effusion with slightly thickened (1 mm) synovia (arrows) indicating arthritis. b Longitudinal US image medial at the knee reveals cloudy hyperechoic areas (arrowheads) and stippled bright foci (arrows) representing monosodium urate deposits close to the meniscus (triangle). X-ray in PA projection (c) shows medial reduction of cartilage (arrow), and in lateral projection (d) joint effusion in the recesses suprapatellar (arrow). The X-rays do not show signs suggestive of gout
- 24. Computed tomography of bilateral knees and ankles with history of chronic hyperuricemia shows bony ankylosis (yellow arrows) of bilateral proximal tibio-fibular syndesmosis, right calcaneo-navicular joint and lateral malleolus.
- 25. A gout patient with left shoulder pain. (a) The AP view radiograph shows joint space narrowing, articular erosion with subchondral sclerosis of the left glenohumeral joint. (b) CT scan demonstrates dense lobulated tophi at the peri-articular region (white arrows). (c) The tophi appear calcified on ultrasound (yellow arrows).
- 26. Primary hyperuricemia and multiple chronic tophaceous gout of the extremities. (a) Plain radiograph shows a lytic lesion at the medial end of the left clavicle consistent with tophaceous gout. (b) Six months later, the lesion becomes more conspicuous with a thin sclerotic margin (arrows). (c) Computed tomography of the lumbar spine in the same patient shows erosion of bilateral facet joints with dense and calcified tophi (yellow arrows).
- 27. Computed tomography pelvis in bone window (a) There is a large, well-defined, hyperdense juxta-articular gouty tophus (white arrow) at the right hip causing erosion of the greater trochanter with overhanging edge (yellow arrow). (b) A calcified tophus deposit is visible at the fascial septa of the left thigh (white arrow). A normal appearing right thigh fascial septa is noted (blue arrow). (c) A tophus is noted posterior to the left L5-S1 facet joint (green arrow).
- 28. X-Ray, U/S and MRI shows intermediate-signal-intensity tophus involving popliteus tendon (large arrows) and erosion of popliteus groove (small arrows).
- 29. Multiplanar CT with axial 2D dual energy and 3D DECT color mapping image of right ankle and foot shows high-attenuation tophi associated with erosions in distal tibia, fibula, and talus.
- 30. Coronal dual-energy CT (DECT) with color mapping images of left foot shows mineralized soft-tissue tophi at first metatarsophalangeal joint, with adjacent erosions and intraosseous tophi (arrows).
- 31. Tophaceous gout at first metatarsophalangeal joint, with X-Ray and MRI Images with unsuspected MSU deposition in ankle and midfoot.
- 32. Coronal T1-weighted (A) and sagittal STIR (B) MRI scans show multiple tophi and erosions of tarsal bones (arrows), which appear as intermediate signal-intensity on T1-weighted and STIR images.
- 33. Sagittal T1-weighted MRI shows intermediate-to-low- signal-intensity tophi (arrows) involving cruciate ligaments. Sagittal T2-weighted image with fat saturation shows tophi (arrows) at attachment site of semimembranosus tendon. Note joint effusion (small asterisk) and Baker cyst (large asterisk).
- 34. Sagittal T1-T2 weighted MRI shows low-to-intermediate-signal-intensity mass (asterisks) infiltrating patellar tendon which appears bright at the T2WI and show peripheral enhancement that extends into infrapatellar fat pad of Hoffa with joint effusion.
- 35. Axial T2 weighted image of the knee. Tophi in both collateral ligaments (white arrows) and underlying bone erosions. Right image: Gadolinium- enhanced T1 SPIR image shows peripheral tophi enhancement.
- 36. Magnetic resonance imaging of the wrist. (a) T1-weighted images show carpal tunnel distension by gouty tophi (yellow arrow). (b) There is associated intratendinous extension into the flexor digitorum superficialis tendon (red arrow). (c) T1-weighted fat suppression post gadolinium images show heterogeneous enhancement of the tophi (yellow arrow). (d) The flexor digitorum superficialis tendon is distended with tophi which intervenes with normal laminated tendon fibers (red arrow).
- 37. Magnetic resonance imaging of the left ankle shows a well-defined oval mass lateral to the lateral malleolus (white arrow). It is isointense on T1-weighted image (a) and heterogeneously hypointense on T2-weighted image (b). The lesion enhances heterogeneously on post-gadolinium T1-weighted fat suppression image (d) as compared to the pre-contrast image (c). There is no erosion of the adjacent bone and joint. Histology of the lesion was consistent with gouty tophus.
- 50. Thank You.