Presentation1, radiological imaging of lateral hindfoot impingement.
•Download as PPTX, PDF•
6 likes•3,699 views

This document discusses radiological imaging of lateral hindfoot impingement. It provides illustrations and images showing normal hindfoot anatomy as well as examples of talocalcaneal impingement, subfibular impingement, and combined impingement. MRI and CT images demonstrate bone marrow edema, cystic changes, sclerosis, and soft tissue swelling associated with impingement between the talus, calcaneus, and fibula. Measurements of hindfoot valgus angle are also shown on imaging to evaluate impingement and alignment. Case studies with patients presenting lateral ankle pain further demonstrate imaging findings of extra-articular hindfoot impingement.

Recommended
Recommended
More Related Content
What's hot
What's hot (20)
Similar to Presentation1, radiological imaging of lateral hindfoot impingement.
Similar to Presentation1, radiological imaging of lateral hindfoot impingement. (20)
More from Abdellah Nazeer
More from Abdellah Nazeer (20)
Recently uploaded
Recently uploaded (20)
Presentation1, radiological imaging of lateral hindfoot impingement.
- 1. Radiological Imaging of lateral Hindfoot Impingement. Dr/ ABD ALLAH NAZEER. MD.
- 2. Extra-articular lateral hindfoot impingement syndrome refers a non- traumatic cause of ankle impingement. This can include talocalcaneal, subfibular, and /or talocalcaneal-subfibular impingements.
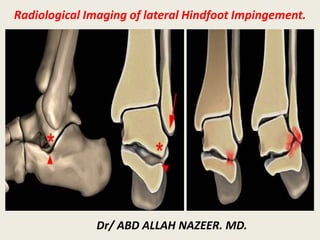
- 5. Illustration shows lateral hindfoot impingement ( normal; talocalcaneal impingement with hindfoot valgus and combined talocalcaneal and subfibular impingement with progressive hindfoot valgus). α - Angle between the medial calcaneal cortex and the long axis of the tibia, measured just posterior to the sustentaculum at the level of the posterior talus and tibia.
- 6. Weight bearing radiograph shows direct contact between the talus and the calcaneus and sclerotic changes (arrows)
- 7. Weight bearing radiograph shows sclerotic changes between the talus and the calcaneus at the point of the angle of Gissane (arrows).
- 8. Sagittal DP and DP FS show abnormal contact between calcaneus and talus with opposing bone marrow edema in a case with lateral hindfoot impingement.
- 9. Sagittal fat saturated DP FS image shows marrow edema and cystic changes of opposing lateral talar process and calcaneus (arrows) in a case with talocalcaneal impingement.
- 10. Coronal PD FS image shows lateral subluxation of calcaneus with increased angle between the medial wall of the calcaneus and the long axis of the tibia. Care should be taken not to use an image through the calcaneal sustentaculum tali as that would increase the angle.
- 11. Coronal proton density fat saturated image (a) shows edema and subchondral cystic changes in the tip of the fibula as well as soft- tissue thickening between the fibula and the calcaneus. Sagittal fat saturated PD images shows marrow edema of opposing lateral talar process and calcaneus (b), as well as better depicts the edema and the cystic changes at the tip of the fibula, in this case of combined talocalcaneal and subfibular impingement (c). Note the presence of a "neofacet" between the lateral process of the talus and calcaneus.
- 12. A,B; Sagittal fat saturated T2-wd images shows marrow edema of opposing lateral talar process and calcaneus. C; Coronal proton density fat saturated image shows subchondral cystic changes in posterior subtalar facet in a case with talocalcaneal impingement.
- 13. Coronal CT image shows calcaneal facet articulating with distal fibula (red arrow). Lateral subluxation of calcaneus and subchondral changes in posterior subtalar facet (yellow arrow) are compatible with combined talocalcaneal and subfibular impingement on the left side in a case with old calcaneal fracture.
- 14. A; Sagittal T2-wd fat saturated image shows abnormal contact between calcaneus and talus with opposing bone marrow edema and cystic changes in a case with lateral hindfoot impingement. B; coronal fat saturated PD image shows thickened calcaneofibular ligament, due to entrapment between the fibula and the calcaneus (PTF: posterior talofibular ligament, PT: peroneal tendons, red arrow; thickened calcaneofibular ligament).
- 15. Due to hindfoot valgus, soft tissue edema and impingement is seen between the fibula and the calcaneus (yellow arrows) without prominent bony changes (red arrow; peroneal tendons). B; Malalignment results dislocation of peroneal tendons (arrow). Peroneal tendon dislocation is not related to lateral ankle impingement.
- 16. Sagittal T1- and fat-suppressed T2-weighted (1a,1b), and coronal fat- suppressed proton density- weighted (1c,1d) images. Lateral hindfoot impingement, with extra- articular talocalcaneal impingement and subfibular (calcaneofibular ) impingement.
- 17. Lateral hindfoot impingement, with extra-articular talocalcaneal impingement and subfibular (calcaneofibular) impingement.
- 18. Lateral hindfoot impingement involves the anatomic structures at the junction of the posterior subtalar joint and the posterolateral margin of the sinus tarsi, including the lateral malleolus.
- 19. T1 Sagittal – Advanced Sub-talar Osteoarthritis. Blue arrow indicates loss of normal fat signal in sinus tarsi reflective of a sinus tarsitis. There is also subcortical sclerosis. The distance between the lateral talar process and the calcaneus at the apex of the angle of Gissane decreases with progressive impingement and osteoarthritis.
- 20. Extra-articular lateral hindfoot impingement in a 13-year-old boy with 4 years of lateral ankle pain with no known injury. a Sagittal T1-W MR image shows an accessory anterolateral talar facet (asterisk) that protrudes anterior to a vertical line bisecting the critical angle of Gissane. Fibrotic scar tissue is associated with the roots of the extensor retinaculum in the sinus tarsi. b Sagittal short tau inversion recovery (STIR) MR image shows the cervical ligament entrapped between the accessory facet and anterior calcaneus (arrow) and mild edema-like signal in the sinus tarsi. c Coronal proton-density MR image shows normal calcaneofibular ligament (arrow) with obliquity of the calcaneus in keeping with hindfoot valgus
- 21. Extraarticular lateral hindfoot impingement in a 17- year-old boy with intermittent ankle pain for many months but no known injury. a No accessory anterolateral talar facet is present on this sagittal T1- W MR image. The solid lines reflect the critical angle of Gissane and the dashed line bisects the angle. Bone does not protrude anterior to the dashed line indicating absence of an accessory anterolateral talar facet. b MRI measurement of hindfoot valgus on a coronal proton-density MR image. Note incidental lobular hypointense structure in the calcaneus, which is hyperintense and might represent vascular remnants or an intraosseous ganglion. c Coronal proton-density MR sequence shows entrapped calcaneofibular ligament, which is markedly thickened with intermediate intrasubstance signal (arrow). d Sagittal T1-W MR image shows replacement of normal hyperintense fat by hypointense signal tissue, which surrounds the calcaneofibular ligament (CFL) between the fibula and calcaneus, consistent with subfibular impingement. e Sagittal short tau inversion recovery (STIR) MR image corresponding to (d) shows the thickened CFL to better advantage. f, g Sagittal T1-W (f) and STIR (g) MR images show effacement of fat on T1 and hyperintense signal on the fluid-sensitive sequence within the sinus tarsi and within the talus at the roof of the sinus tarsi, which is associated with extraarticular lateral hindfoot impingement.
- 22. 60-year-old man with lateral ankle pain. A and B, Sagittal T1- weighted fast spin-echo (A) and sagittal inversion recovery (B) images show cystic changes and marrow edema at lateral talar process (solid arrows) and opposing lateral calcaneus (open arrows). C, Coronal T2-weighted fast spin-echo fat-saturated image shows moderate hindfoot valgus angle of 22°. Lateral calcaneal marrow edema (star) and subcutaneous edema (arrow) are noted. D, Axial T2- weighted fast spin-echo fat- saturated image shows type Ia posterior tibial tendon tear with mild morphologic irregularity and increased tendon size (arrow)
- 23. 65-year-old woman with clinical history of posterior tibial tendon dysfunction. A and B, Sagittal T1- weighted fast spin-echo (A) and sagittal inversion recovery weighted (B) sequences show signal alterations at opposing osseous contact surfaces of talus and calcaneus, representing sclerosis (solid arrows) and marrow edema (open arrows, B). C and D, Sagittal T1-weighted fast spin-echo (C) and sagittal inversion recovery weighted (D) images show subfibular soft-tissue abnormality depicted by hypointense T1 and both hyper- and hypointense T2- weighted signal (arrowheads).
- 24. 83-year-old woman with history of posterior tibial tendon dysfunction and lateral ankle pain, depicted by marker, showing combined talocalcaneal–subfibular impingement. A, Coronal T1-weighted fast spin-echo image shows cystic changes and sclerosis at opposing talus and calcaneus (white arrows). Intermediate-signal soft tissue is entrapped between fibula and calcaneus (black arrow). B, More posterior coronal T1- weighted fast spin echo image illustrates direct osseous contact between fibula and calcaneus (arrow) with calcaneal “neofacet” (star). Hindfoot valgus angle, formed by intersection of line along medial calcaneal wall and line parallel to long axis of tibia, is increased (32°). C, Coronal T2-weighted fat- suppressed image depicts fibular marrow edema (star). D, Axial proton density– weighted fast spin-echo image illustrates peroneal tendon subluxation (black arrow) and grade III posterior tibial tendon tear (arrowhead). Direct contact between fibula and calcaneus (white arrows) is also identified.
- 25. Thank You.