Download to read offline


![ A population is a summation of all the organisms of the
same group or species, who live in the same geographical
area, and have the capability of interbreeding.[1][2] In
ecology the population of a certain species in a certain
area is estimated using the Lincoln Index. The area that
is used to define a sexual population is defined as the
area where inter-breeding is potentially possible between
any pair within the area. The probability of interbreeding
is greater than the probability of cross-breeding with
individuals from other areas. Under normal conditions,
breeding is substantially more common within the area
than across the border.[3]](https://image.slidesharecdn.com/presentation1-140126022017-phpapp02-140213034121-phpapp01/85/Presentation1-140126022017-phpapp02-4-320.jpg)
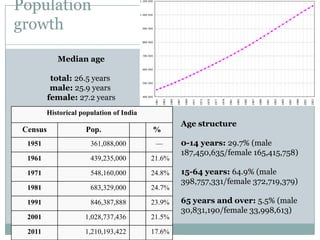
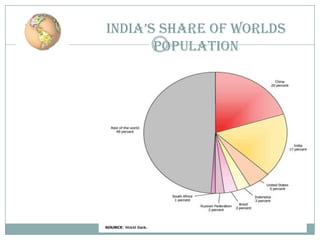
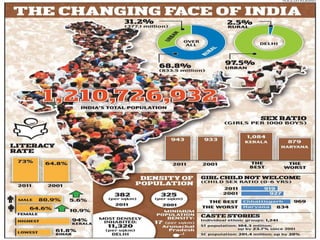
![ The demographics of India are inclusive of the second
most populous country in the world, with over 1.21 billion
people (2011 census), more than a sixth of the world's
population. Already containing 17.5% of the world's
population, India is projected to be the world's most populous
country by 2025, surpassing China, its population reaching
1.6 billion by 2050.[4][5] Its population growth rate is 1.41%,
ranking 102nd in the world in 2010.[6] Indian population
reached the billion mark in 2000.
India has more than 50% of its population below the age of 25
and more than 65% below the age of 35. It is expected that, in
2020, the average age of an Indian will be 29 years, compared
to 37 for China and 48 for Japan; and, by 2030,
India's dependency ratio should be just over 0.4.[7]](https://image.slidesharecdn.com/presentation1-140126022017-phpapp02-140213034121-phpapp01/85/Presentation1-140126022017-phpapp02-5-320.jpg)
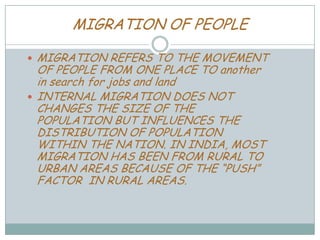
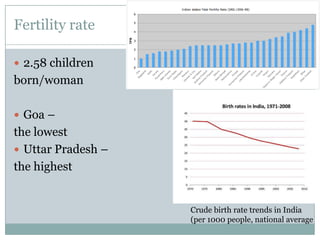
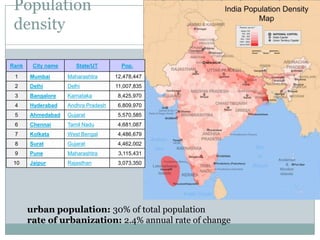
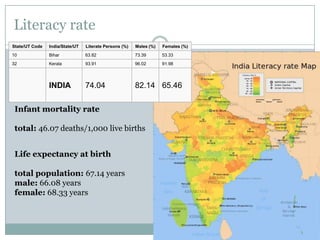

This document discusses population demographics in India. It provides statistics that India has over 1.21 billion people as of 2011, making it the second most populous country in the world. India is projected to surpass China as the world's most populous country by 2025. More than 50% of India's population is under 25 years old. The three main factors that affect population change are birth rates, death rates, and migration. Birth rates have traditionally been higher than death rates in India, contributing to population growth. Internal migration in India has largely been from rural to urban areas. Literacy rates and life expectancy statistics for India are also presented.


