Downloaded 44 times


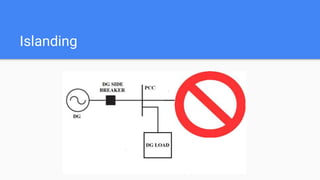

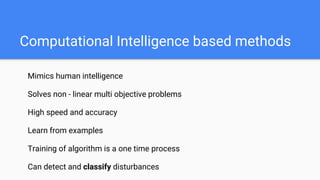

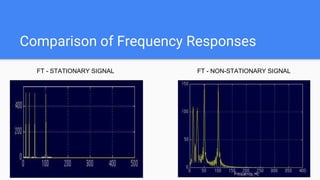
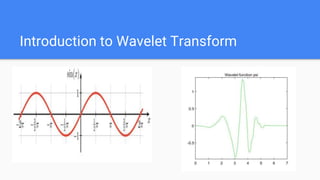
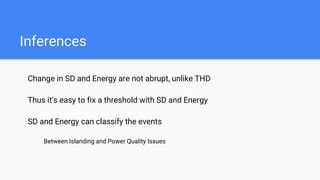
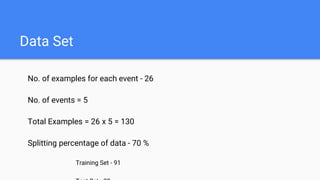
![Discrete Wavelet Transform - Working
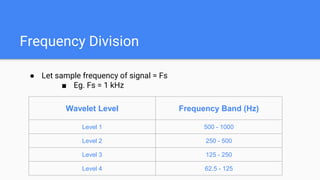
● x[n] → Signal
● h[n] → HPF
● g[n] → LPF
Coefficients
Filters
Down - Sampling](https://image.slidesharecdn.com/a7869636-4537-4e9d-ac28-b52e036dc049-161104082755/85/PPT_Final_Presentation-26-320.jpg)


![Reference
[1] El-Saadany, E. F., H. H. Zeineldin, and A. H. Al-Badi. "Distributed generation: benefits and challenges." International Conference on Communication, Computer & Power. Vol.
115119. 2007.
[2] Algarni, Ayed. "Operational and planning aspects of distribution systems in deregulated electricity markets." (2009).
[3] Zeineldin, H. H., and M. M. A. Salama. "Islanding detection of inverter-based distributed generation." IEE Proceedings-Generation, Transmission and Distribution 153.6
(2006): 644-652..
[4] Eltawil, Mohamed A., and Zhengming Zhao. "Grid-connected photovoltaic power systems: Technical and potential problems—A review." Renewable and Sustainable Energy
Reviews 14.1 (2010): 112-129.
[5] United States of America. Congress of the U.S., Congressional Budget Office. Prospects for distributed electricity generation. September, 2003.
[6] Tailor, J. K., and A. H. Osman. "Restoration of fuse-recloser coordination in distribution system with high DG penetration." Power and Energy Society General Meeting-
Conversion and Delivery of Electrical Energy in the 21st Century, 2008 IEEE. IEEE, 2008.
[7] Xu, Wilsun, Konrad Mauch, and Sylvain Martel. "An assessment of distributed generation islanding detection methods and issues for Canada."CANMET Energy Technology
Centre-Varennes, Natural Resources Canada, QC-Canada, Tech. Rep. CETC-Varennes 74 (2004).
[8] Menon, Vivek, and M. Hashem Nehrir. "A hybrid islanding detection technique using voltage unbalance and frequency set point." IEEE Transactions on Power Systems 22.1
(2007): 442-448.
[9] PVPS, IEA. "Evaluation of islanding detection methods for photovoltaic utility-interactive power systems." Report IEA PVPS T5-09 (2002).
[10] Ropp, M. E., et al. "Using power line carrier communications to prevent islanding [of PV power systems]." Photovoltaic Specialists Conference, 2000. Conference Record of the Twenty-Eighth
IEEE. IEEE, 2000.](https://image.slidesharecdn.com/a7869636-4537-4e9d-ac28-b52e036dc049-161104082755/85/PPT_Final_Presentation-59-320.jpg)
![Reference
[11] Xu, Wilsun, et al. "A power line signaling based technique for anti-islanding protection of distributed generators—part i: scheme and analysis." IEEE Transactions on Power
Delivery 22.3 (2007): 1758-1766.
[12 Xu, Wilsun, et al. "A power line signaling based technique for anti-islanding protection of distributed generators—part i: scheme and analysis." IEEE Transactions on Power
Delivery 22.3 (2007): 1758-1766.
[13] Redfern, M. A., O. Usta, and G. Fielding. "Protection against loss of utility grid supply for a dispersed storage and generation unit." IEEE Transactions on Power Delivery 8.3
(1993): 948-954.
[15] Wrinch, Michael C. Negative sequence impedance measurement for distributed generator islanding detection. Diss. University of British Columbia, 2008.
[16] Yin, Jun, Liuchen Chang, and Chris Diduch. "Recent developments in islanding detection for distributed power generation." Power Engineering, 2004. LESCOPE-04. 2004
Large Engineering systems Conference on. IEEE, 2004.
[17] Smith, G. A., P. A. Onions, and D. G. Infield. "Predicting islanding operation of grid connected PV inverters." IEE Proceedings-Electric Power Applications 147.1 (2000): 1-6.
[18] Ropp, M. E., Miroslav Begovic, and A. Rohatgi. "Analysis and performance assessment of the active frequency drift method of islanding prevention."IEEE Transactions on
Energy Conversion 14.3 (1999): 810-816.
[19] Hung, Guo-Kiang, Chih-Chang Chang, and Chern-Lin Chen. "Automatic phase-shift method for islanding detection of grid-connected photovoltaic inverters." IEEE
Transactions on energy conversion 18.1 (2003): 169-173.
[20] Hernandez-Gonzalez, Guillermo, and Reza Iravani. "Current injection for active islanding detection of electronically-interfaced distributed resources."IEEE Transactions on
power delivery 21.3 (2006): 1698-1705.](https://image.slidesharecdn.com/a7869636-4537-4e9d-ac28-b52e036dc049-161104082755/85/PPT_Final_Presentation-60-320.jpg)
![Publications [1] Sleeba Paul Puthenpurakel, Subadhra P.R.,
“Islanding Detection in Grid-Connected 100 KW
Photovoltaic System Using Wavelet Transform”,
International Conference on Emerging Trends in
Smart Grid Technology - INCETS'16, IJIRSET Volume
5, Special Issue 5, April 2016
[2] Sleeba Paul Puthenpurakel, Subadhra P.R.,
“Identification and Classification of Microgrid
Disturbances in a Hybrid Distributed Generation
System Using Wavelet Transform”, International
Conference on Next Generation Intelligent Systems”](https://image.slidesharecdn.com/a7869636-4537-4e9d-ac28-b52e036dc049-161104082755/85/PPT_Final_Presentation-61-320.jpg)


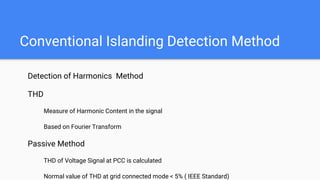
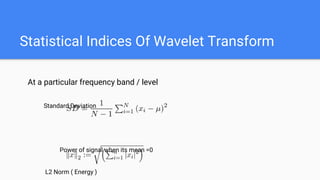
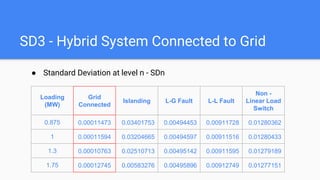
This document discusses methods for detecting and classifying disturbances in a hybrid distributed power system using wavelet transform and artificial neural networks. It begins by introducing the motivation for distributed generation and some challenges like unintentional islanding. It then describes using the wavelet transform on voltage signals to detect islanding and compares this to using total harmonic distortion. Statistical indices from the wavelet transform are used as inputs to an artificial neural network classifier to identify different disturbances like islanding, faults, and load changes with over 95% accuracy. The study concludes the wavelet transform approach provides better detection and classification than conventional techniques. Future work could explore improving performance under noisy conditions and different feature selection.
![Signal Integrity - A Crash Course [R Lott]](https://cdn.slidesharecdn.com/ss_thumbnails/1cb0870c-cad3-4a68-ad41-8e9450fec5d8-170217191645-thumbnail.jpg?width=640&height=640&fit=bounds)