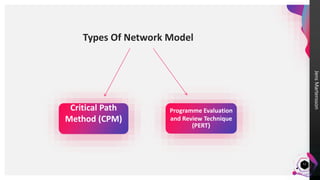
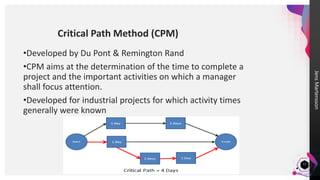
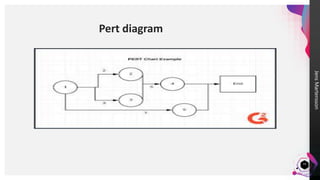
This document discusses different project scheduling techniques including Gantt charts, network models like CPM and PERT, and activity network diagrams. It provides definitions and examples of each technique, describing how they can be used to plan and schedule projects by illustrating task dependencies and timelines. The advantages and limitations of each approach are also outlined.
3. JensMartensson
DEFINATION
A Gantt chart is a project
management tool assisting in
the planning and scheduling
of projects of all sizes,
although they are particularly
useful for simplifying complex
projects.
3
4. JensMartensson
The Purpose Of A Gantt Chart
• To illustrate the relationship between
project activities & time.
• To show the multiple project activities on
one chart.
• To provide a simple & easy to understand
representation of project scheduling.
4
6. JensMartensson
6
Creating a Gantt Chart:
There are 2 methods to creating a Gantt Chart (Maylor, 2005).
1. :
starting with the list of activities and a given start date follow
them forwards in time until you hit given deadline.
2. Backward Schedule:
Look at the deadline, from that date work in the logical list of
activities.
Both of these methods allow you to ensure that all necessary activities
can possibly be completed within the given project time frame.
7. JensMartensson
Steps to Creating a Gantt Chart:
1. Determine Project start date and deadline.
2. Gather all information surrounding the list of activities within a
project – the Work Breakdown Structure may be useful for this.
3. Determine how long each activity will take
4. Evaluate what activities are dependant on others
5. Create Graph shell including the timeline and list of activities.
6. Using either Forward Scheduling or Backward Scheduling, Begin to
add bars ensuring to include dependencies and the full duration for
each activity.
8. JensMartensson
8
The Advantages:
• A useful tool for displaying time-based
information within a project.
• Very simple to create
• They provide a useful overview of project
activities, a good starting point for project
planning.
• The charts are widely used and understood.
• There exists several PC software packages that
allow you to build Gantt Charts.
9. JensMartensson
9
The Limitations:
• The Gantt Chart does not explain the
reasoning behind the chosen duration of each
activity. (Maylor, 2001)
• The Gantt Chart is very difficult to update
when changes to the project plan take place.
This makes it time consuming and results in
long-term planning being very difficult.
(Goldratt, 1997)
11. JensMartensson
11
Use Of Network Analysis
• Network technique provides a
rational approach to the planning
and controlling of construction
works.
• The application of such techniques
is inevitable when there is a
constraint on resources and a need
for higher productivity.
13. JensMartensson
13
Critical Path Method (CPM)
•Developed by Du Pont & Remington Rand
•CPM aims at the determination of the time to complete a
project and the important activities on which a manager
shall focus attention.
•Developed for industrial projects for which activity times
generally were known
14. JensMartensson
14
Uses of CPM :
•CPM provides meaningful answers to such questions as:
•What will be the completion time of the project?
•If there is a delay in one activity, will the entire project be
delayed? If so, by how much?
•What is the most economical way to speed the project
•How to schedule material deliveries so as to have materials
when needed but avoid costly storage for long periods.
15. JensMartensson
15
Programme Evaluation and Review Technique
(PERT)
•Program Evaluation and Review Technique (PERT)
is a method used to examine the tasked that are in
a schedule and determine a variation of the Critical
Path Method (CPM).
•It analyzes the time required to complete each task
and its associated dependencies to determine the
minimum time to complete a project.
17. JensMartensson
17
Uses Of Pert
•PERT charts are used to plan tasks within a project.
•making it easier to schedule.
•coordinate team members accomplishing the work.
18. JensMartensson
18
Limitations Of Network Analysis
• In PERT, it is assumed that all the activities involved in the project are
known in advance. ...
• The assumption that a project can be sub-divided into a set of predictable
and independent, activities may not hold true always. ...
• PERT emphasizes only on time and not the costs
• PERT is based on time estimates and there may be error in
estimating time.
• For active control of a project, PERT requires frequent updating and
revising of calculations. It is an expansive and time consuming exercise,
which requires highly trained personnel.
19. JensMartensson
19
ACTIVITY ON NODE (AON)
• An activity-on-node diagram will be designed to
show which activities must be completed in order for
other activities to commence.
• This is referred to as “finish-to-start” precedence
– meaning one activity must be finished before the
next one can start
20. JensMartensson
20
Method Of Drawing AON
In this method, you create nodes or boxes that represent activities and
connect these nodes by using arrows that show the dependency between the
activities these arrows connect.
21. JensMartensson
21
Uses of AON
1. An activity-on-node diagram can be used to provide a visual
representation of the network logic of an entire project schedule.
2. It can be used for any smaller section of the schedule that lends
itself to being represented as having a defined beginning and end.
3. To keep the logic in the diagram simple, it may be most effective to
include only critical path schedule activities. The planned start date
of each node may also be listed in the diagram legend in accordance
with the project management timeline.
22. JensMartensson
22
Activity On Arrow
It is a network diagramming technique
in which activities are represented by
arrows. The start and end of each node
or event is connected to an arrow.
Between the two nodes lies an arrow
that represents the activity.
23. JensMartensson
23
Drawing the Network
1. List all the necessary tasks in the project or process. One method is to write
each task on the top half of a card or sticky note. Across the middle of the
card, draw a horizontal arrow pointing right.
2. Determine the correct sequence of the tasks. Do this by asking three
questions for each task:
1. .
3. Diagram the network of tasks. If you are using notes or cards, arrange them
in sequence on a large piece of paper. Time should flow from left to right
and concurrent tasks should be vertically aligned. Leave space between the
cards.
4. Between each two tasks, draw circles for "events." An event marks the
beginning or end of a task and can help visually separate tasks.
24. JensMartensson
24
Dummy Activity
In a project, a situation may arise that two
activities have the same beginning and end points.
Such situations leads to a lot of inconvenience as
the identity of the activities are lot. This results in
errors during network computations. This problem
can be solved by using a dummy, two activities
cannot have the same starting and end event.
25. JensMartensson
25
Use of Activity-on-Arrow
1. When scheduling and monitoring tasks within a complex project or
process with interrelated tasks and resources
2. When you know the steps of the project or process, their sequence,
and how long each step takes
3. When project schedule is critical, with serious consequences for
completing the project late or significant advantage to completing the
project early
Editor's Notes
Which tasks must happen before this one can begin?
Which tasks can be done at the same time as this one?
Which tasks should happen immediately after this one?Tip: Create a table with four columns: prior tasks, this task, simultaneous tasks, following tasks for ease of use