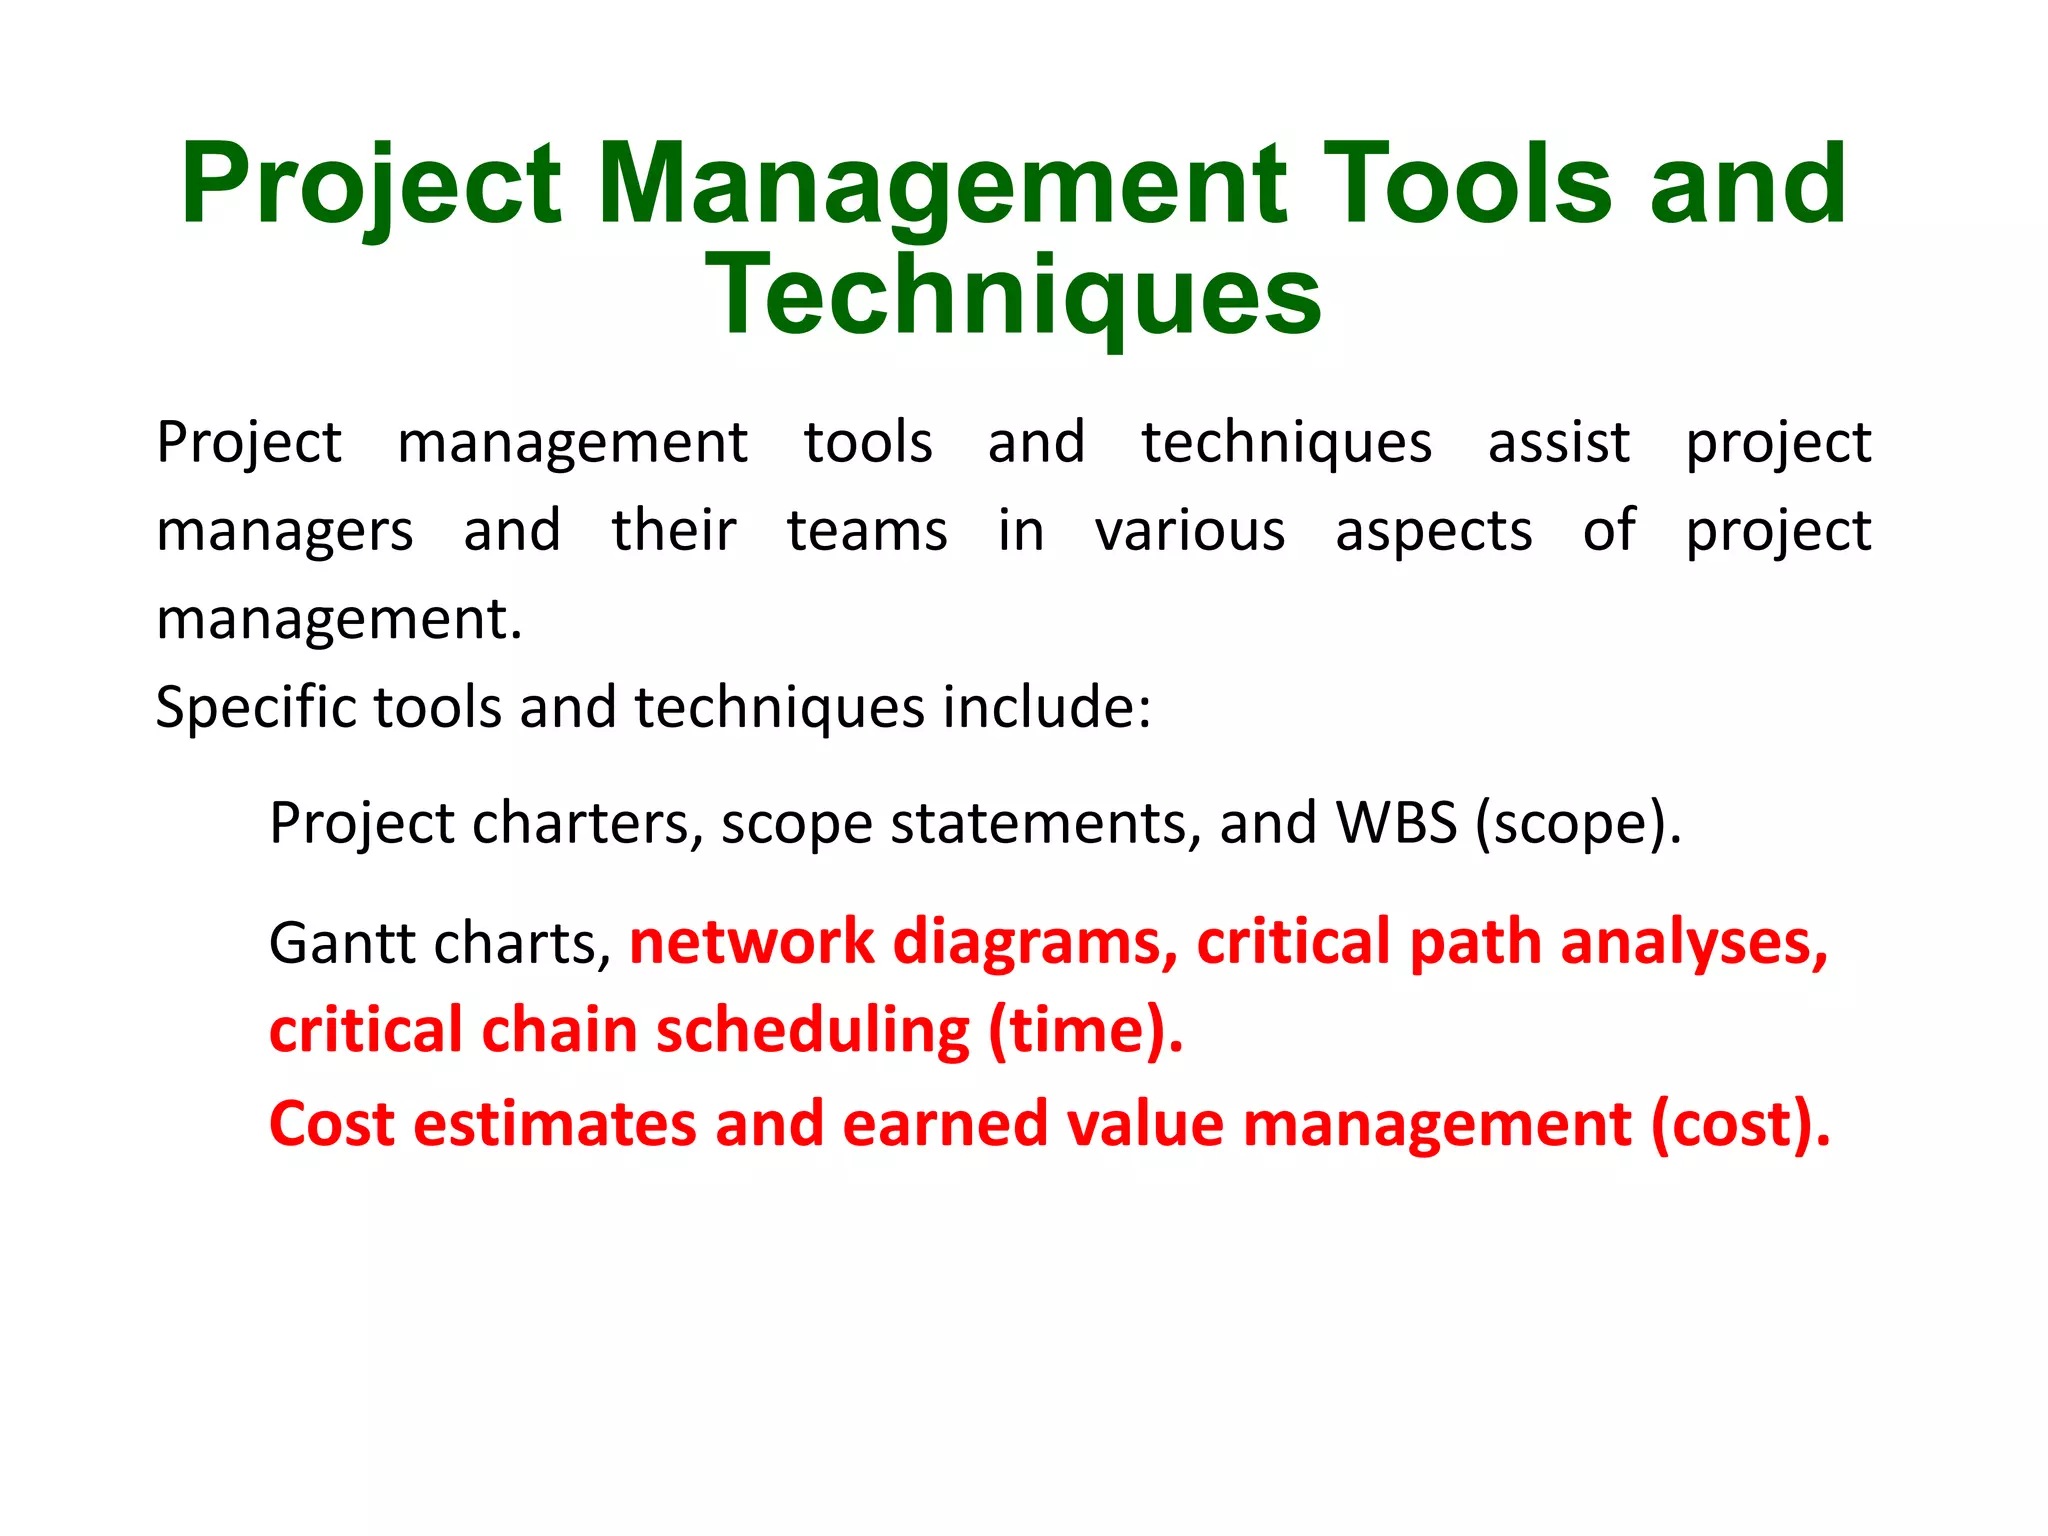
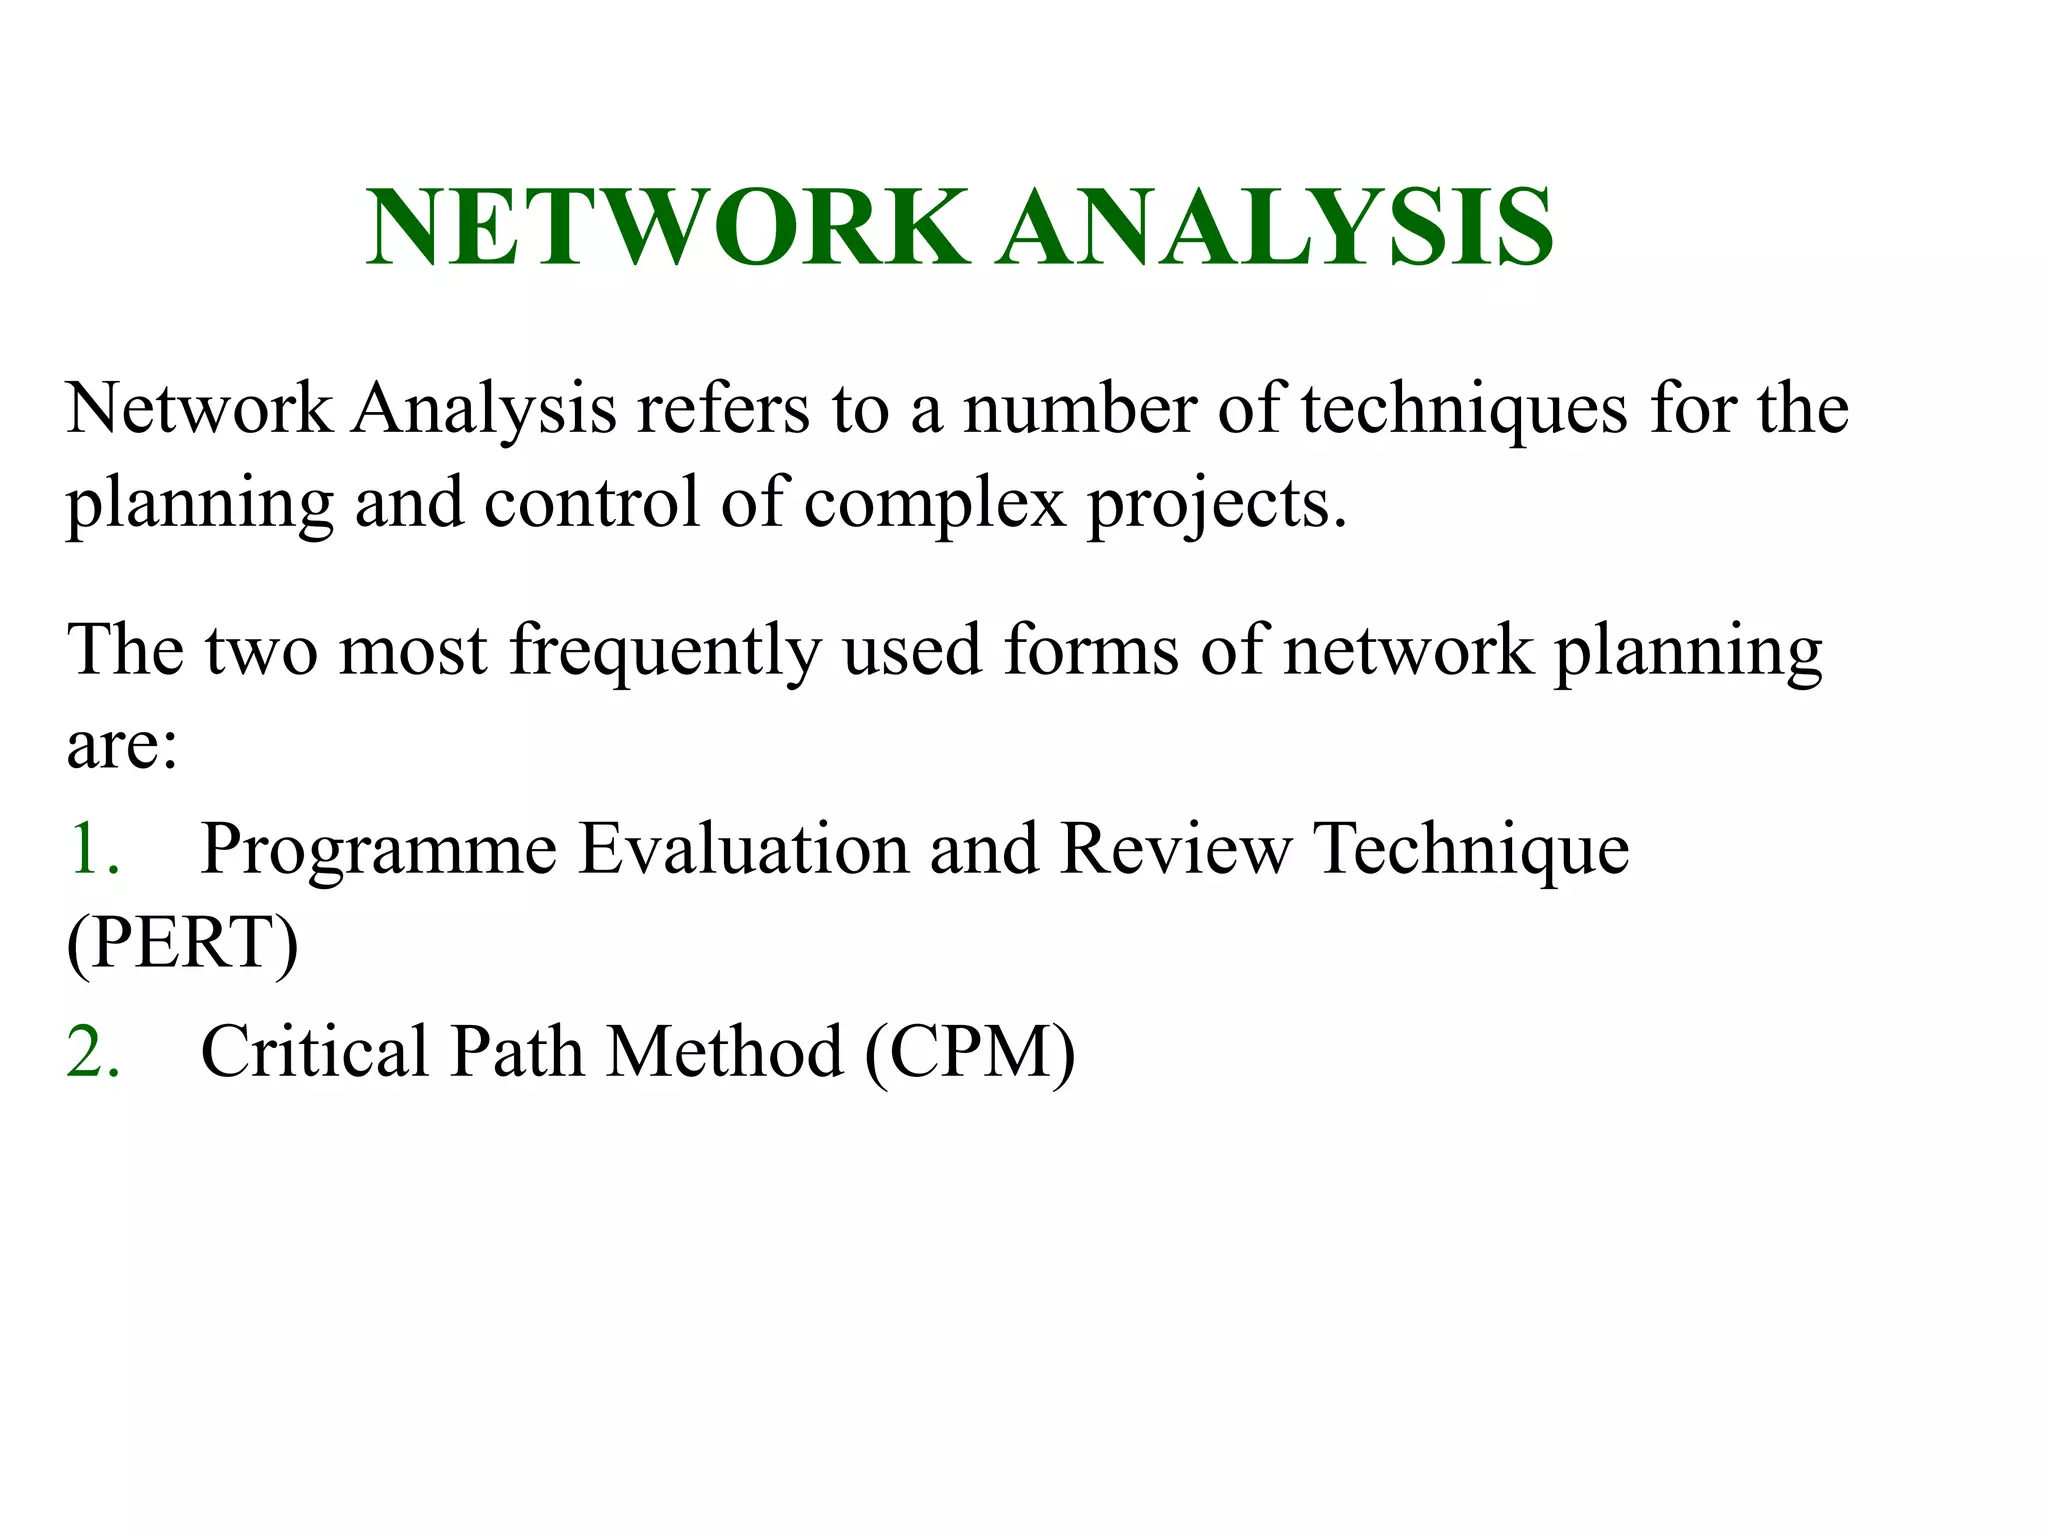
1) The document discusses project management tools including network analysis techniques like CPM and PERT.
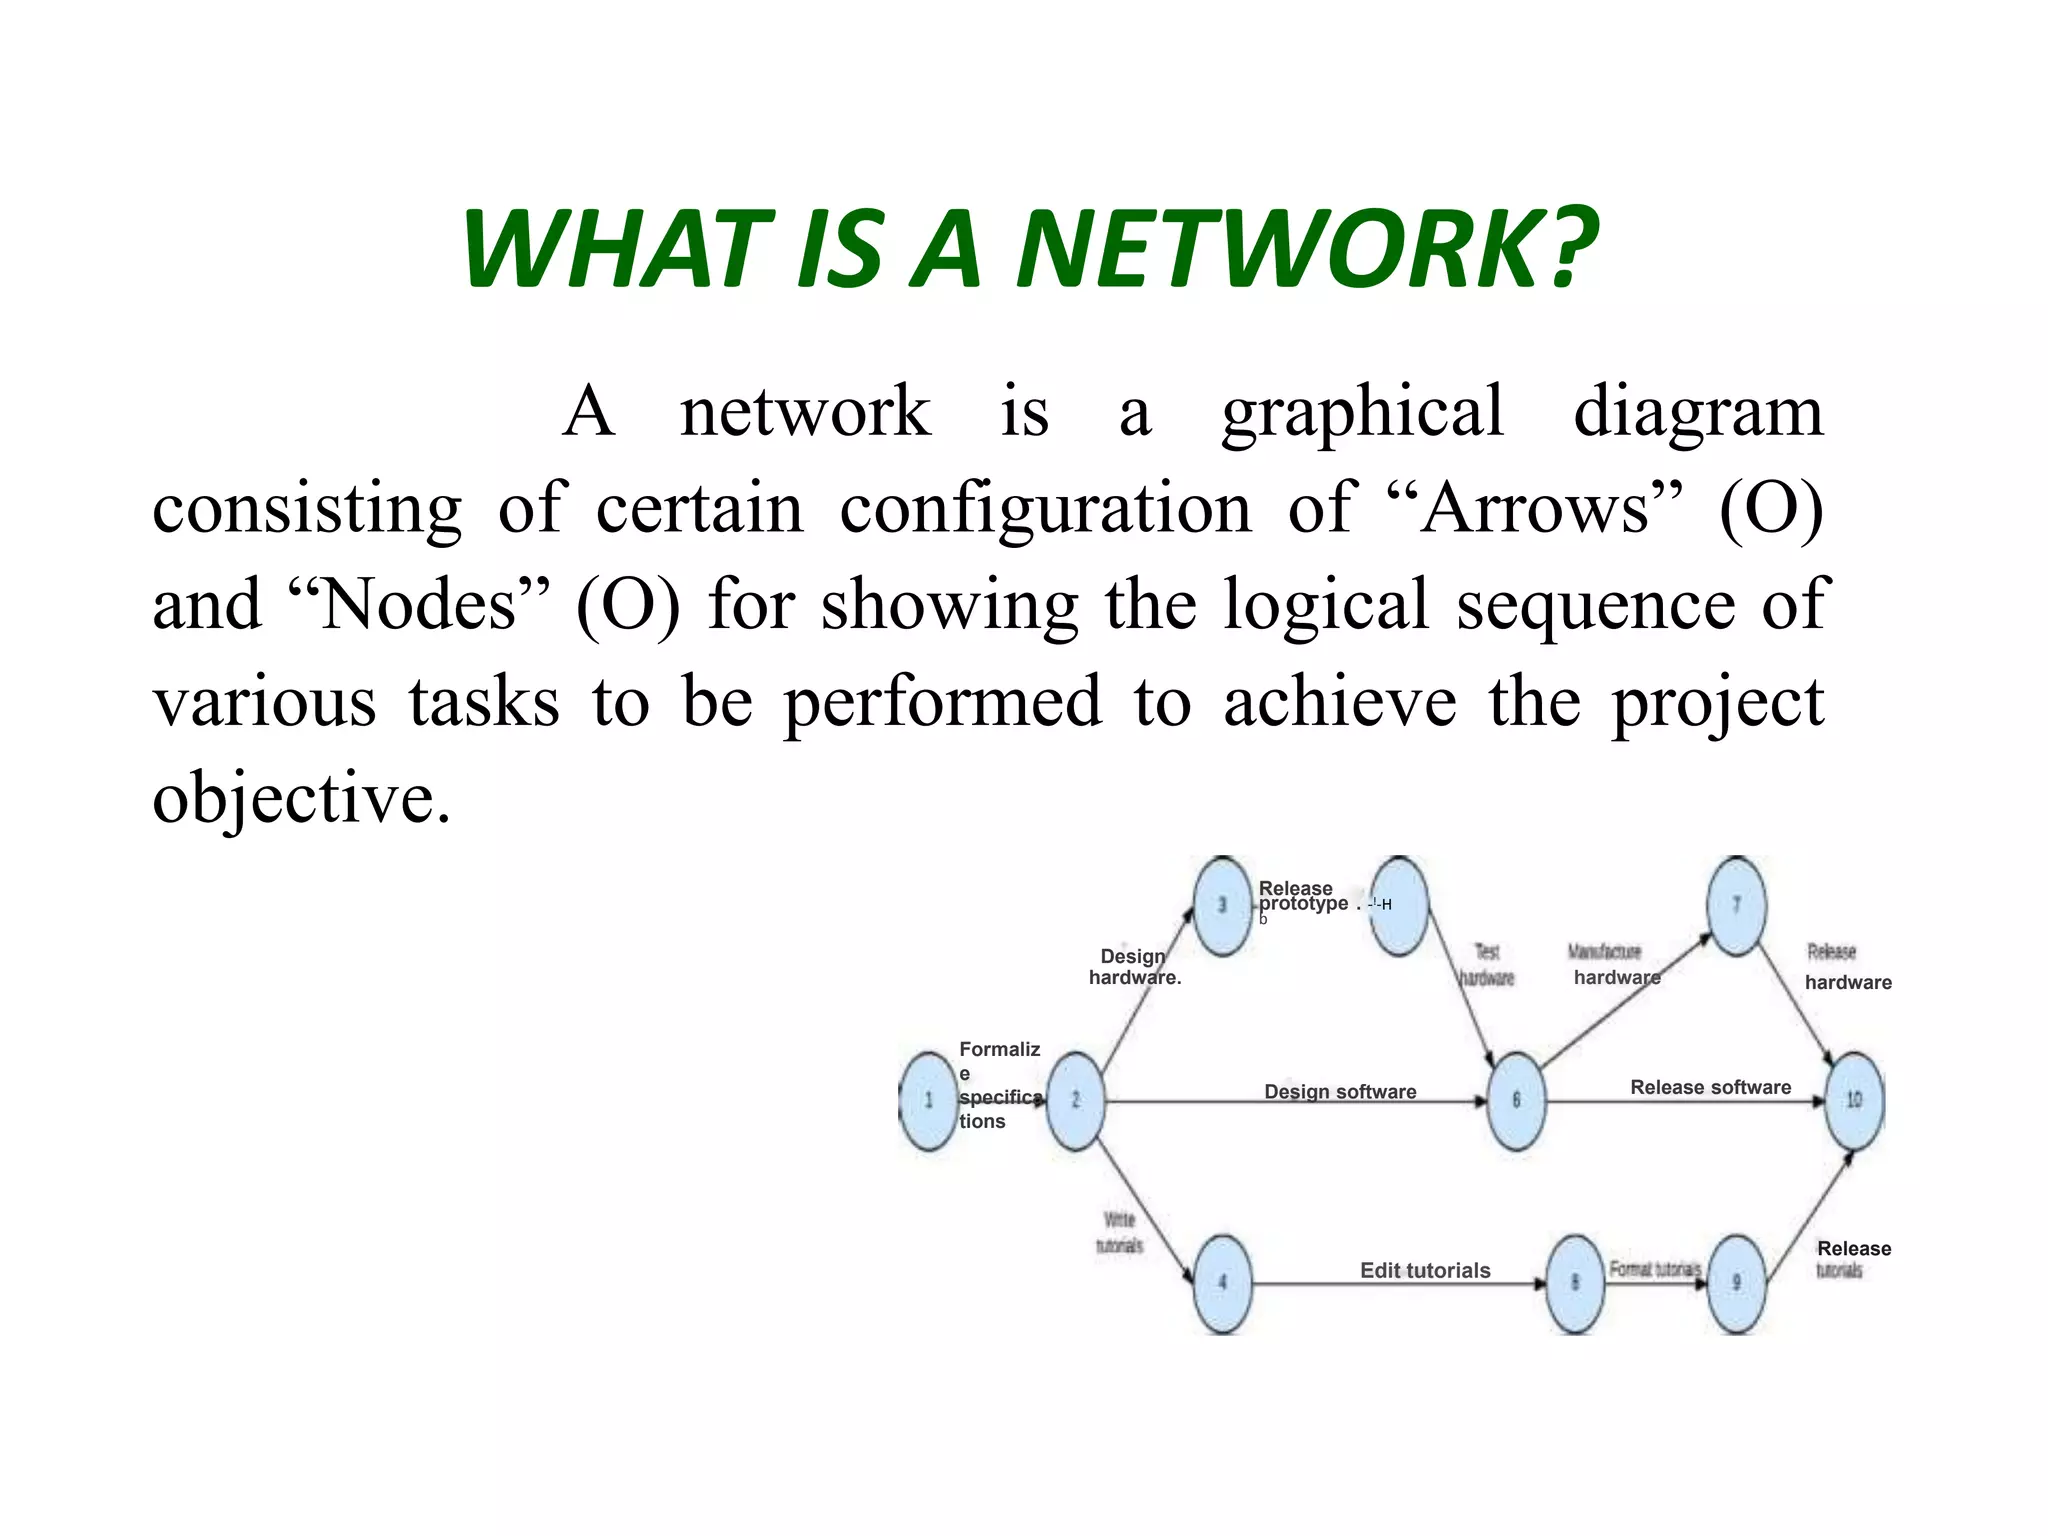
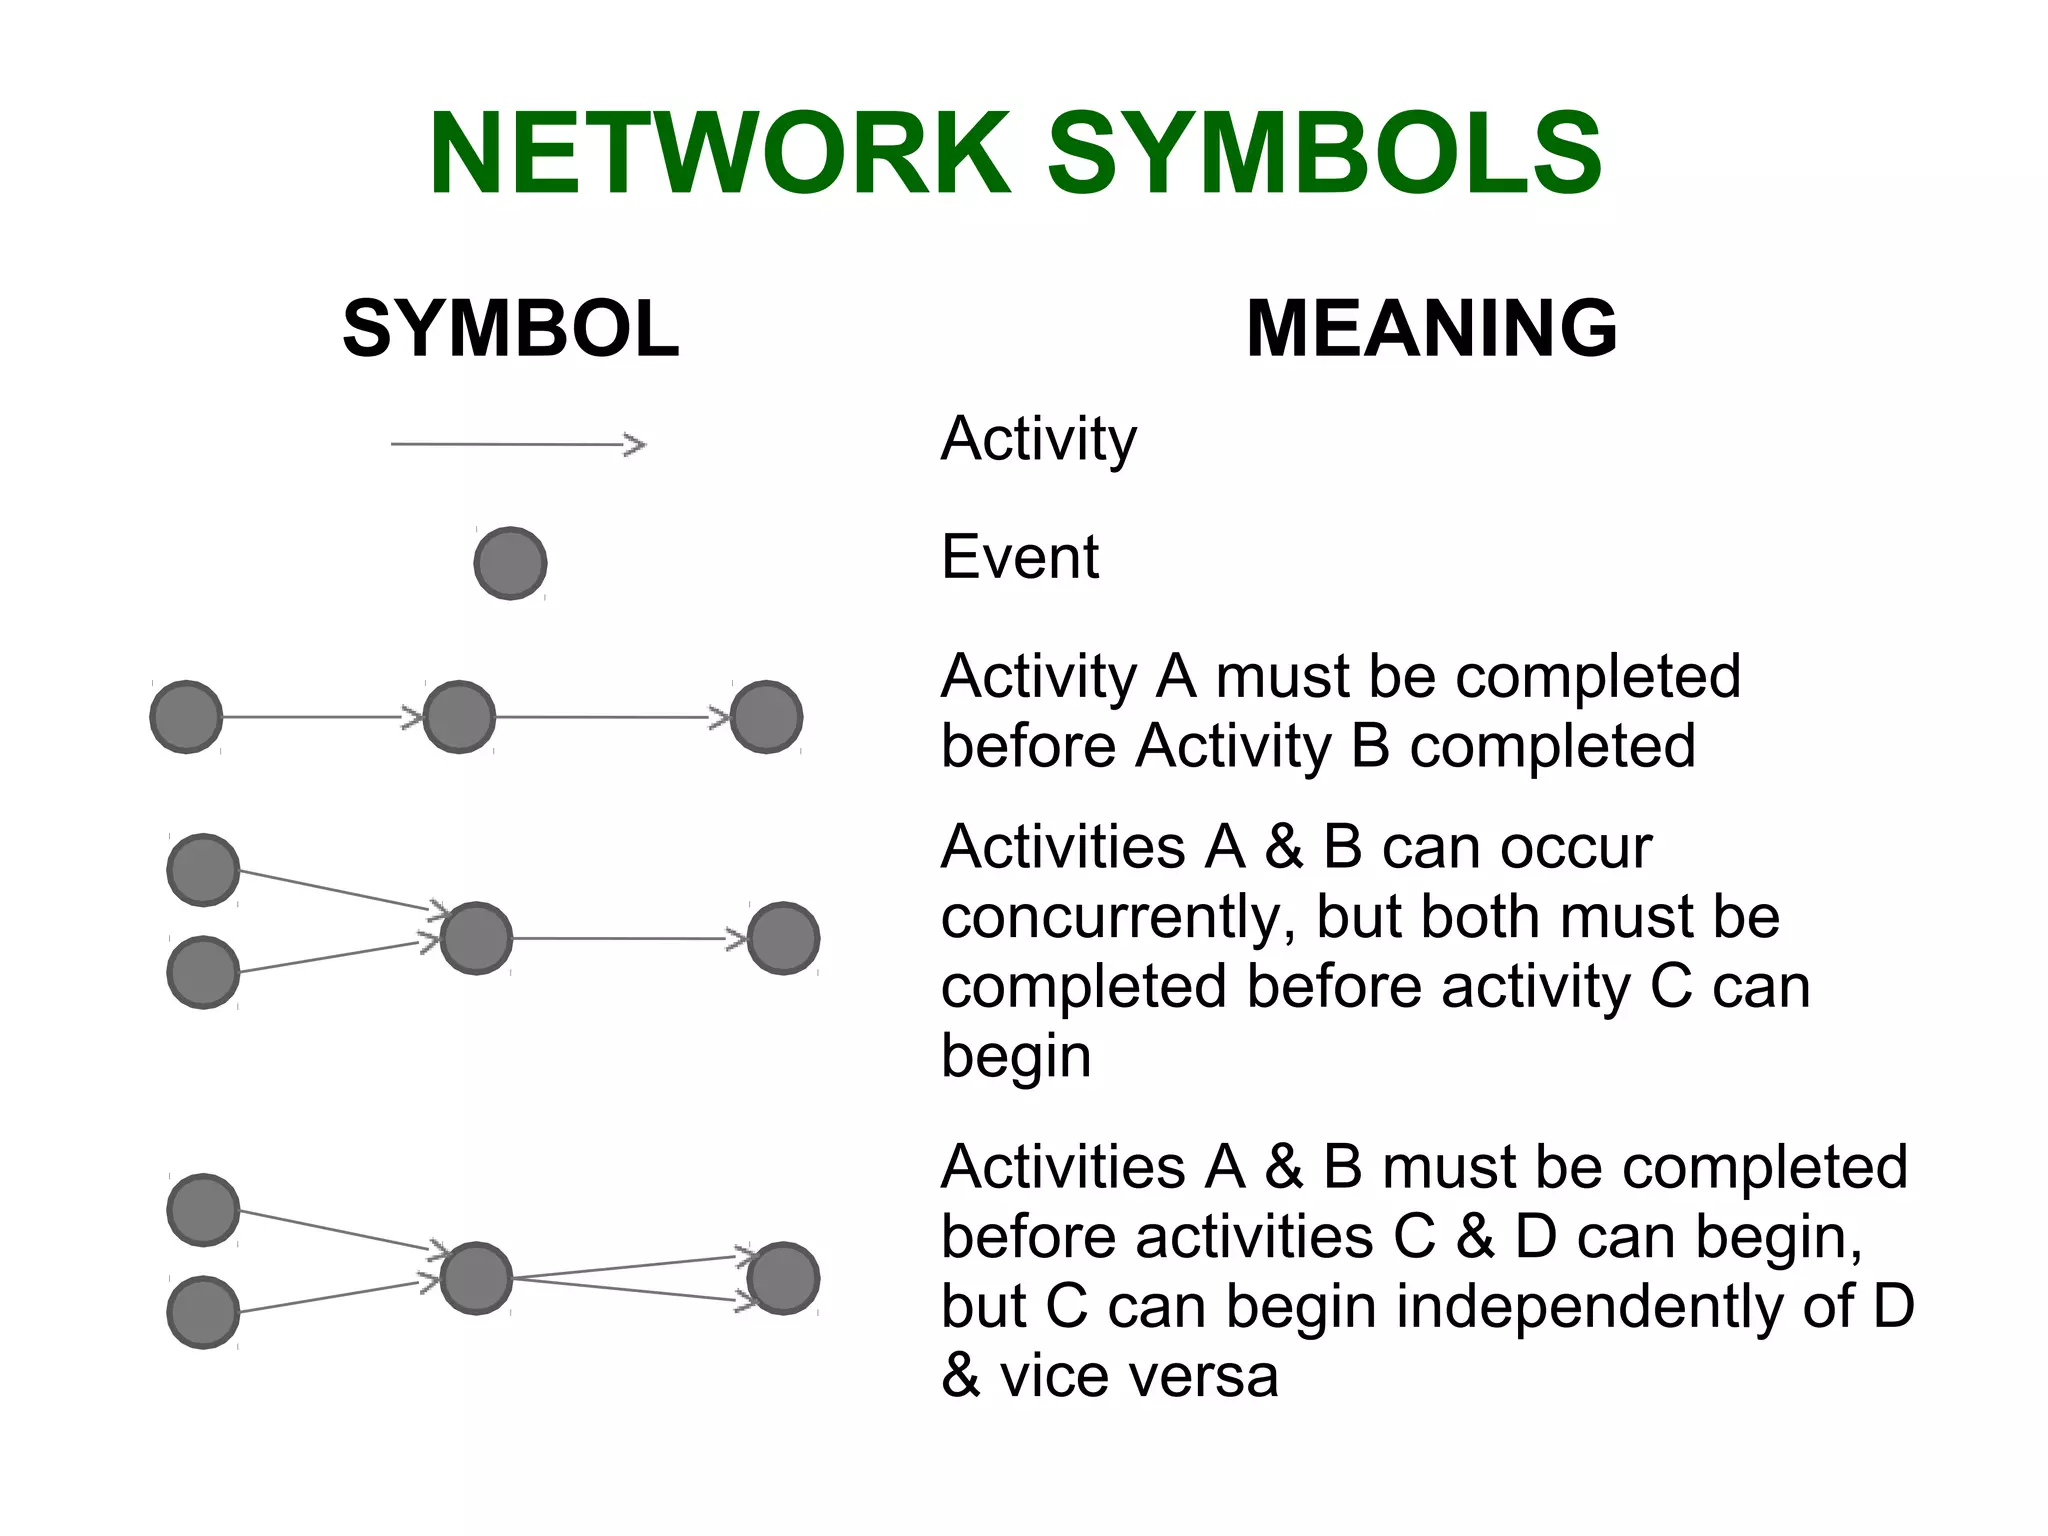
2) CPM and PERT are used to plan and schedule complex projects using network diagrams that show the logical sequence and relationships of tasks.
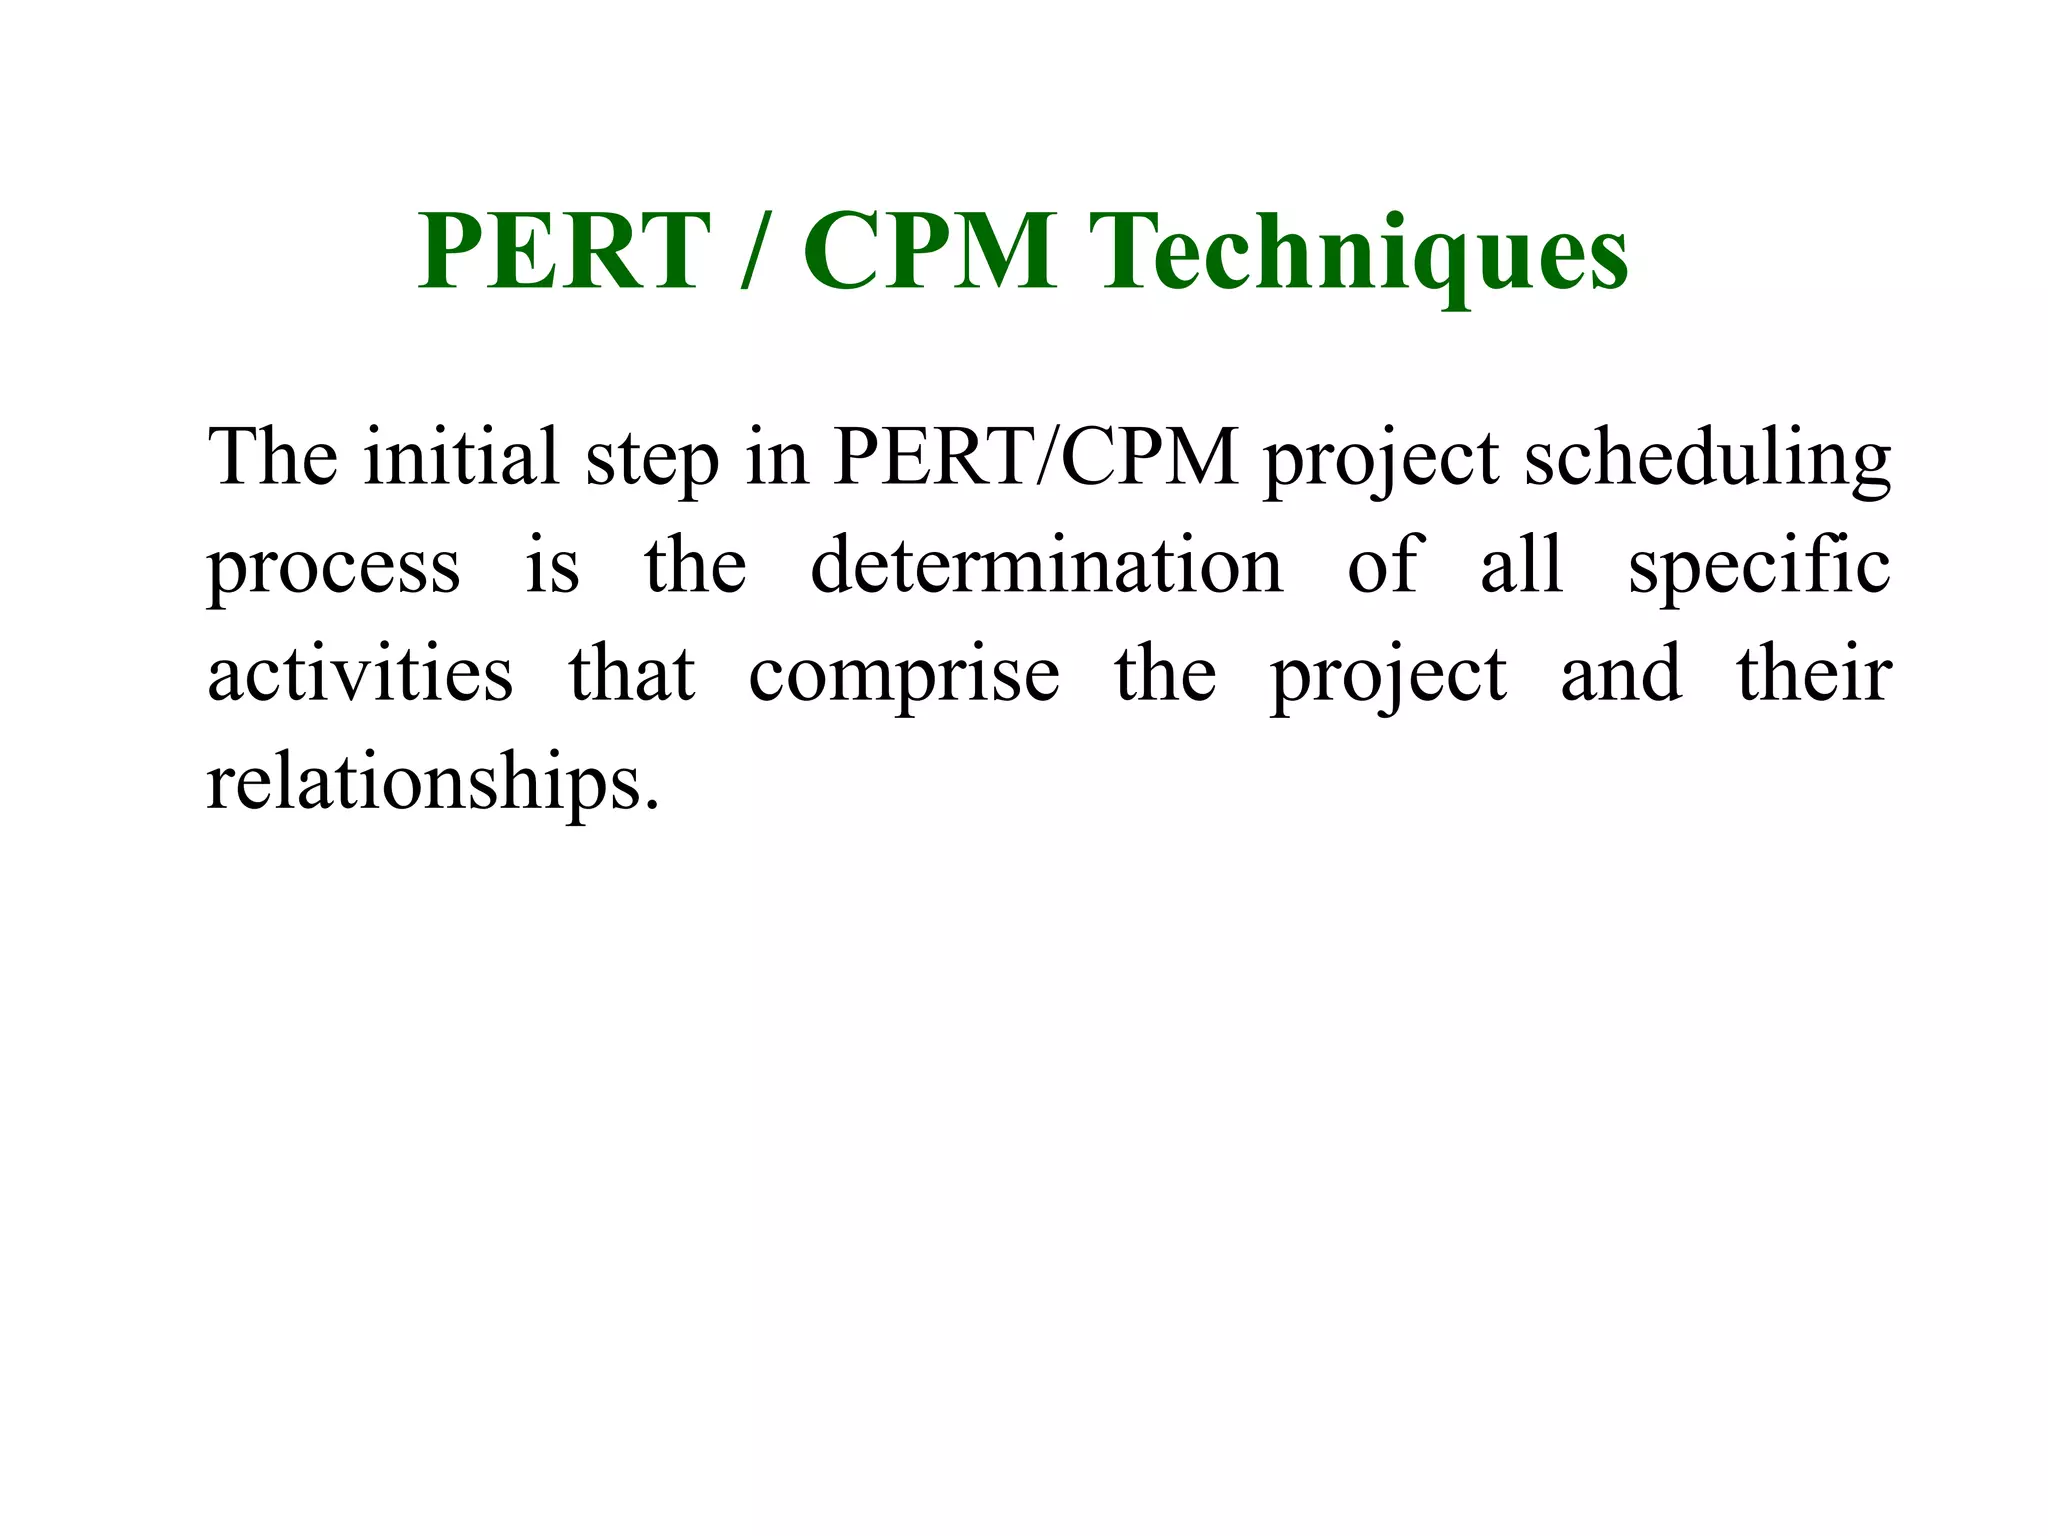
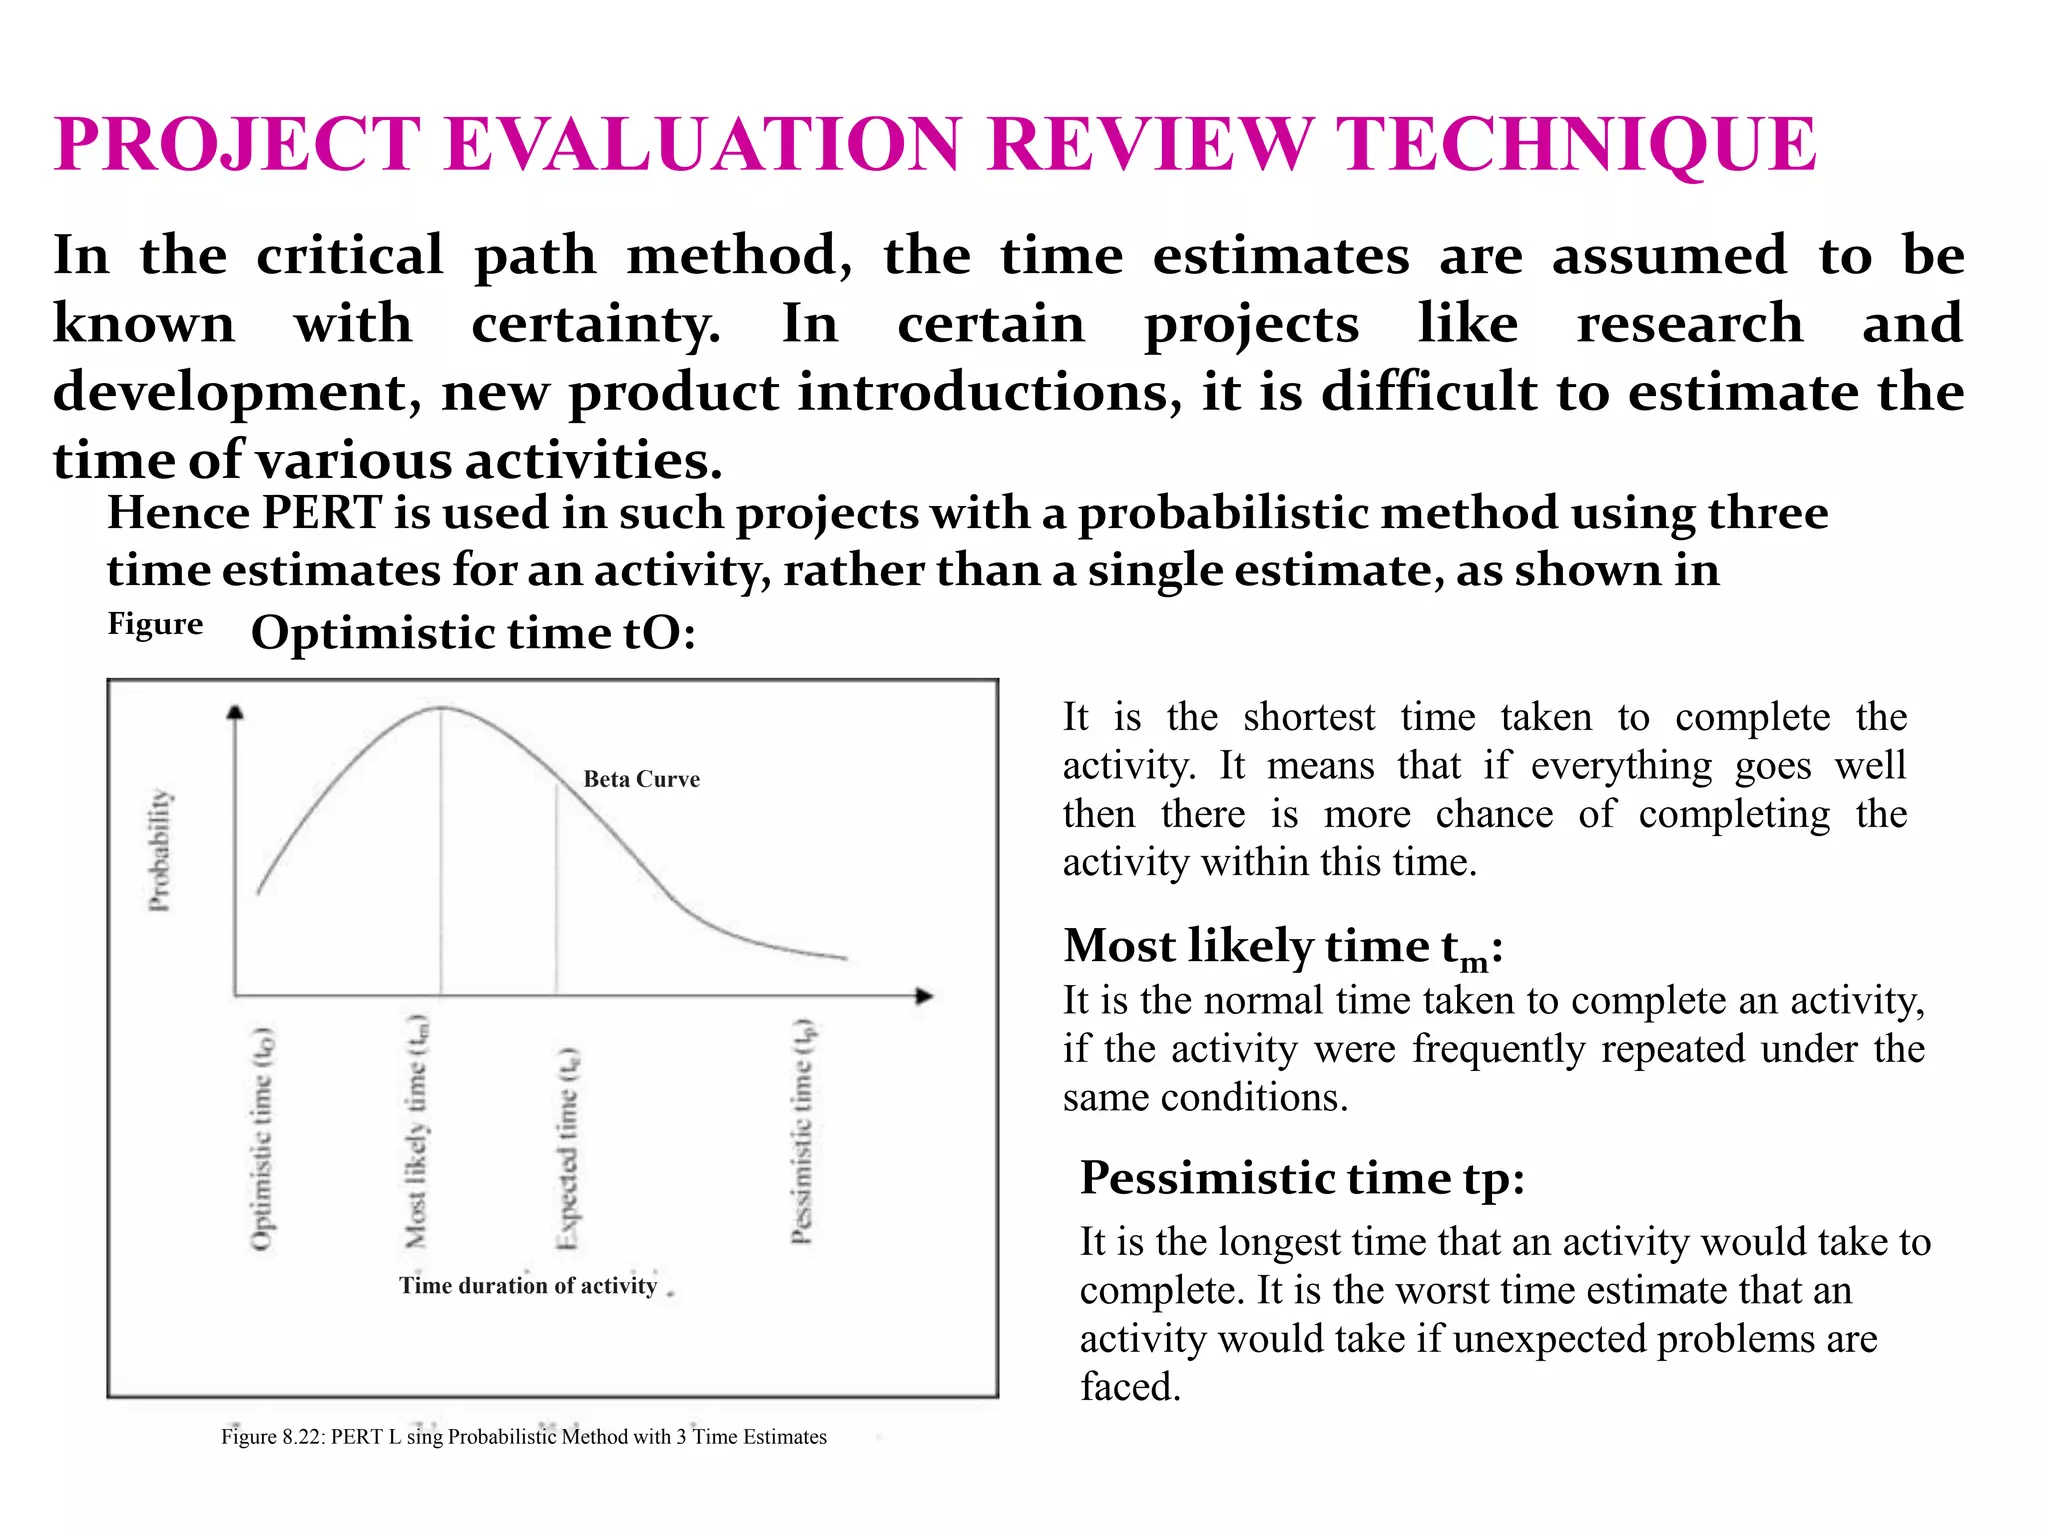
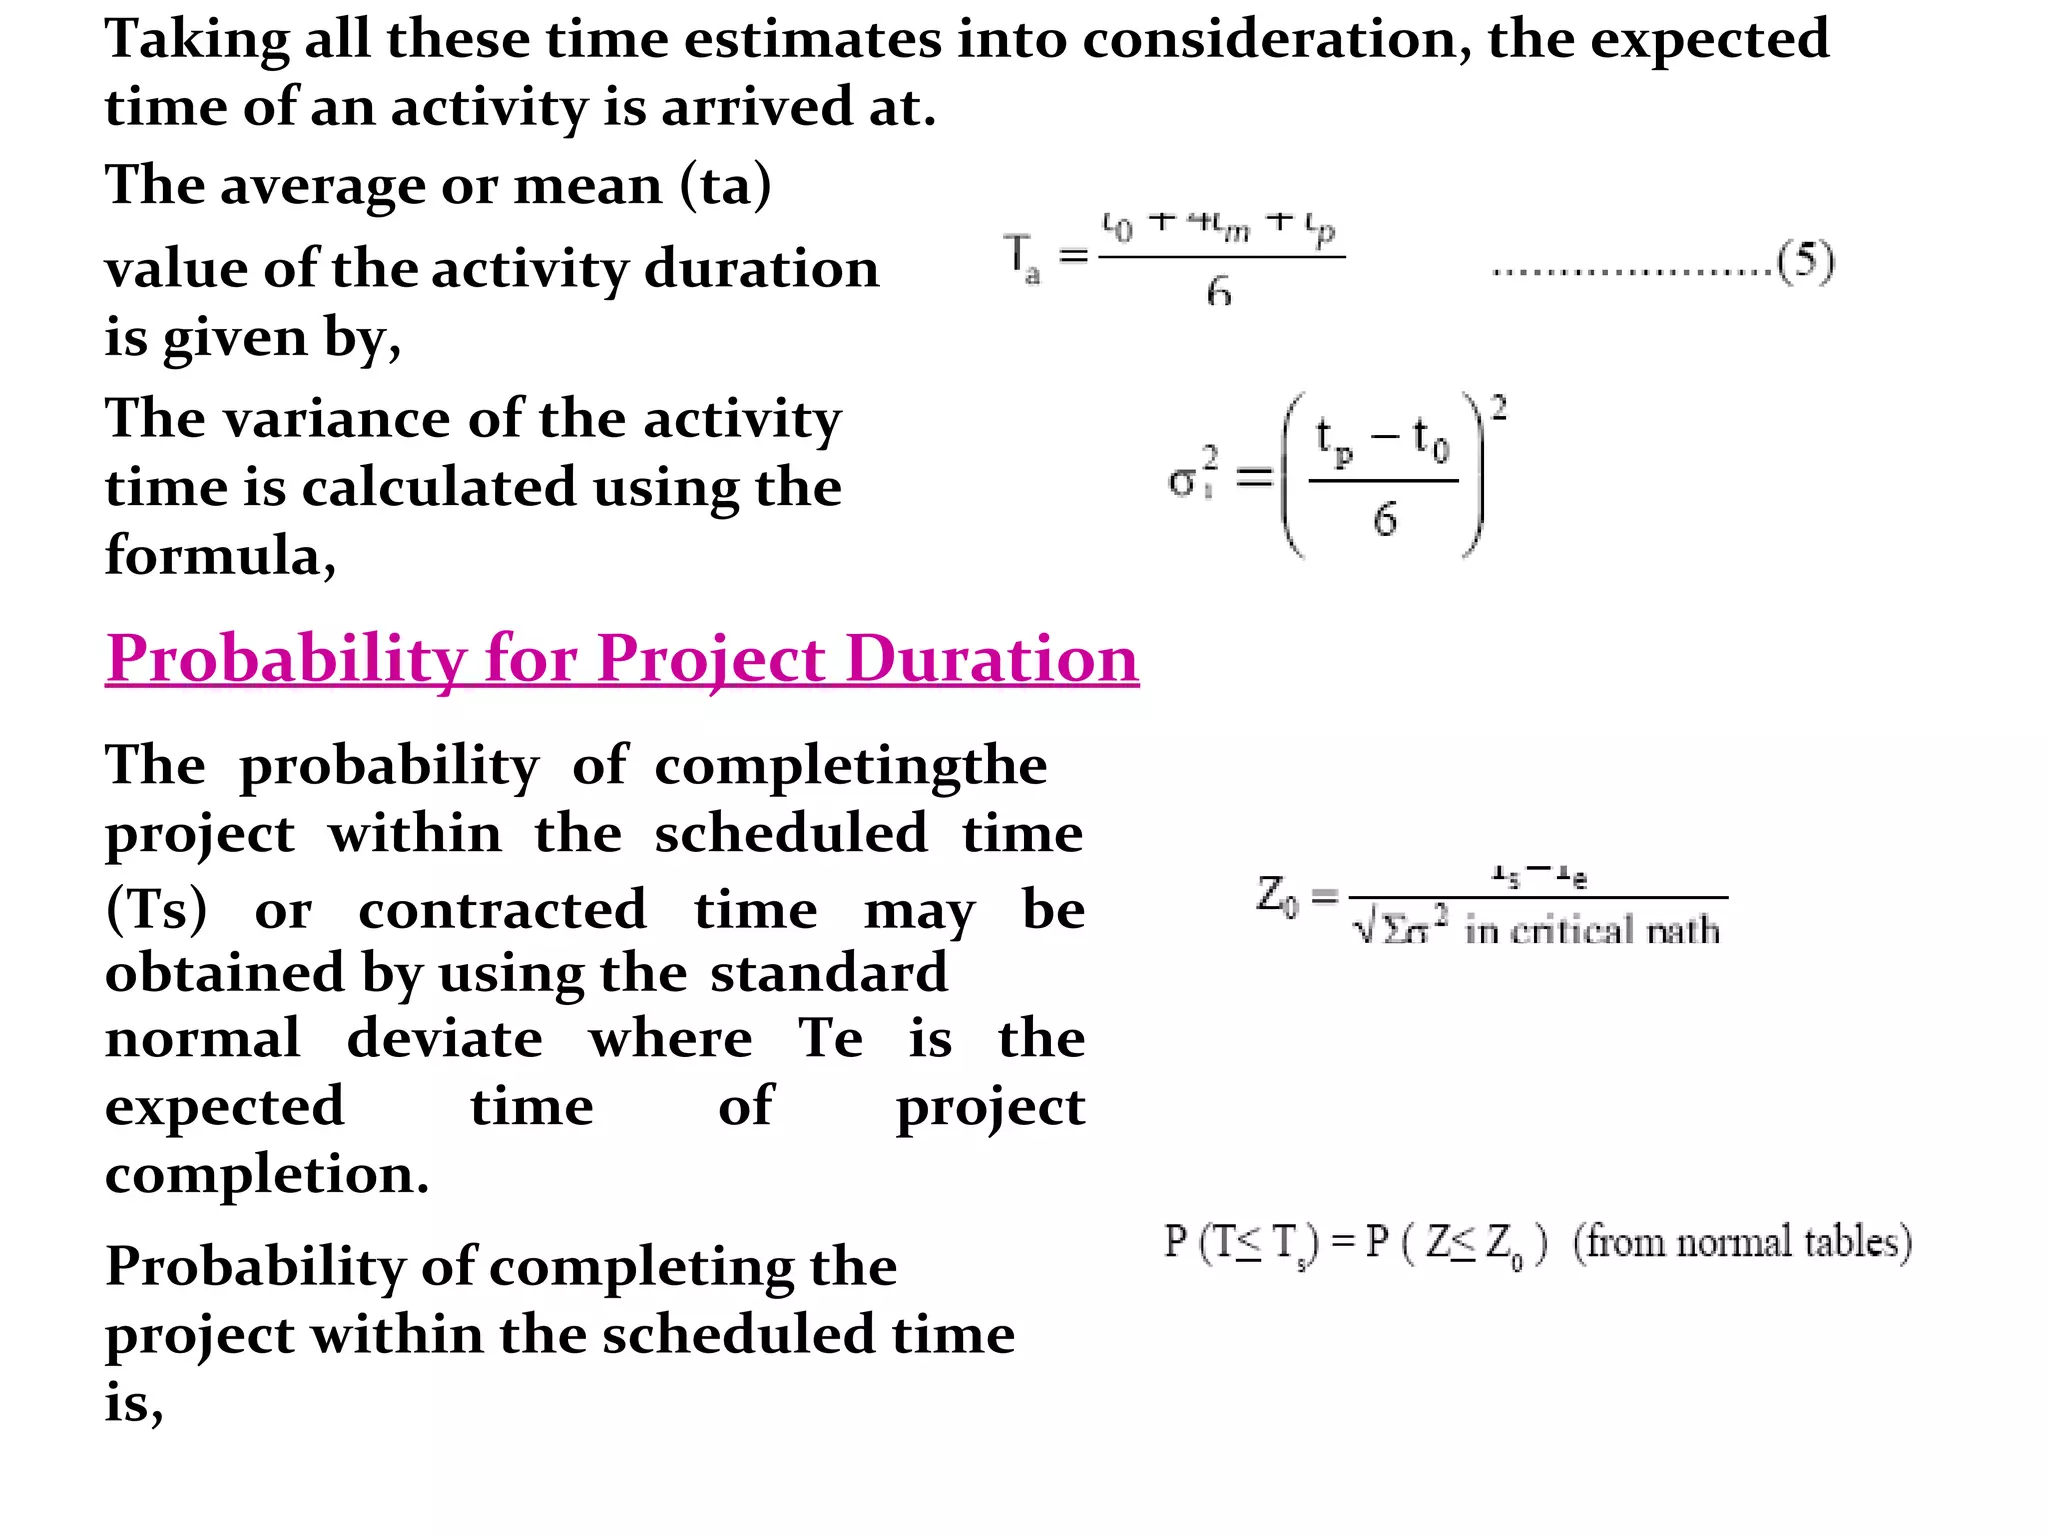
3) PERT uses three time estimates for each activity - optimistic, most likely, and pessimistic - to calculate the expected duration using probability.