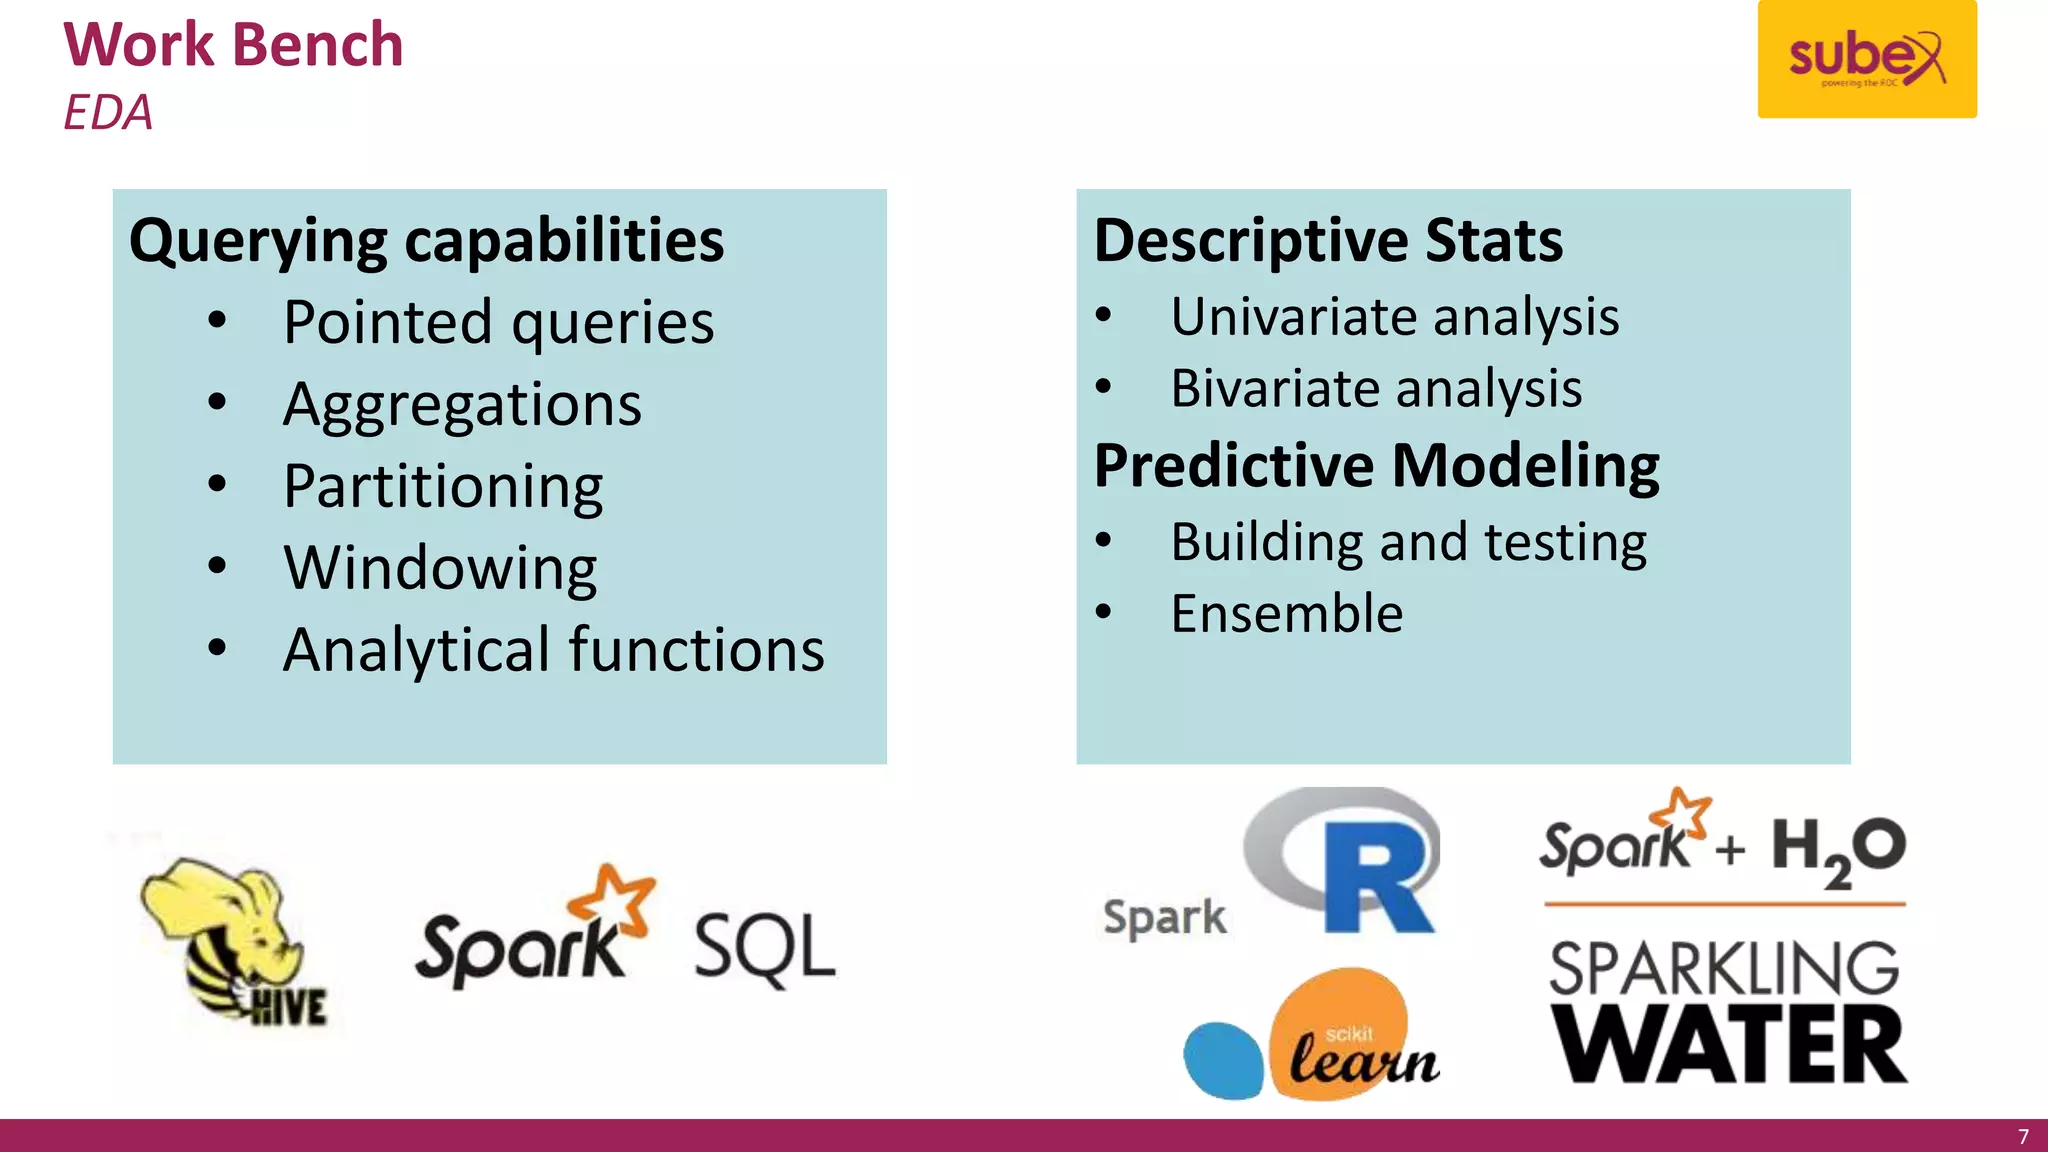
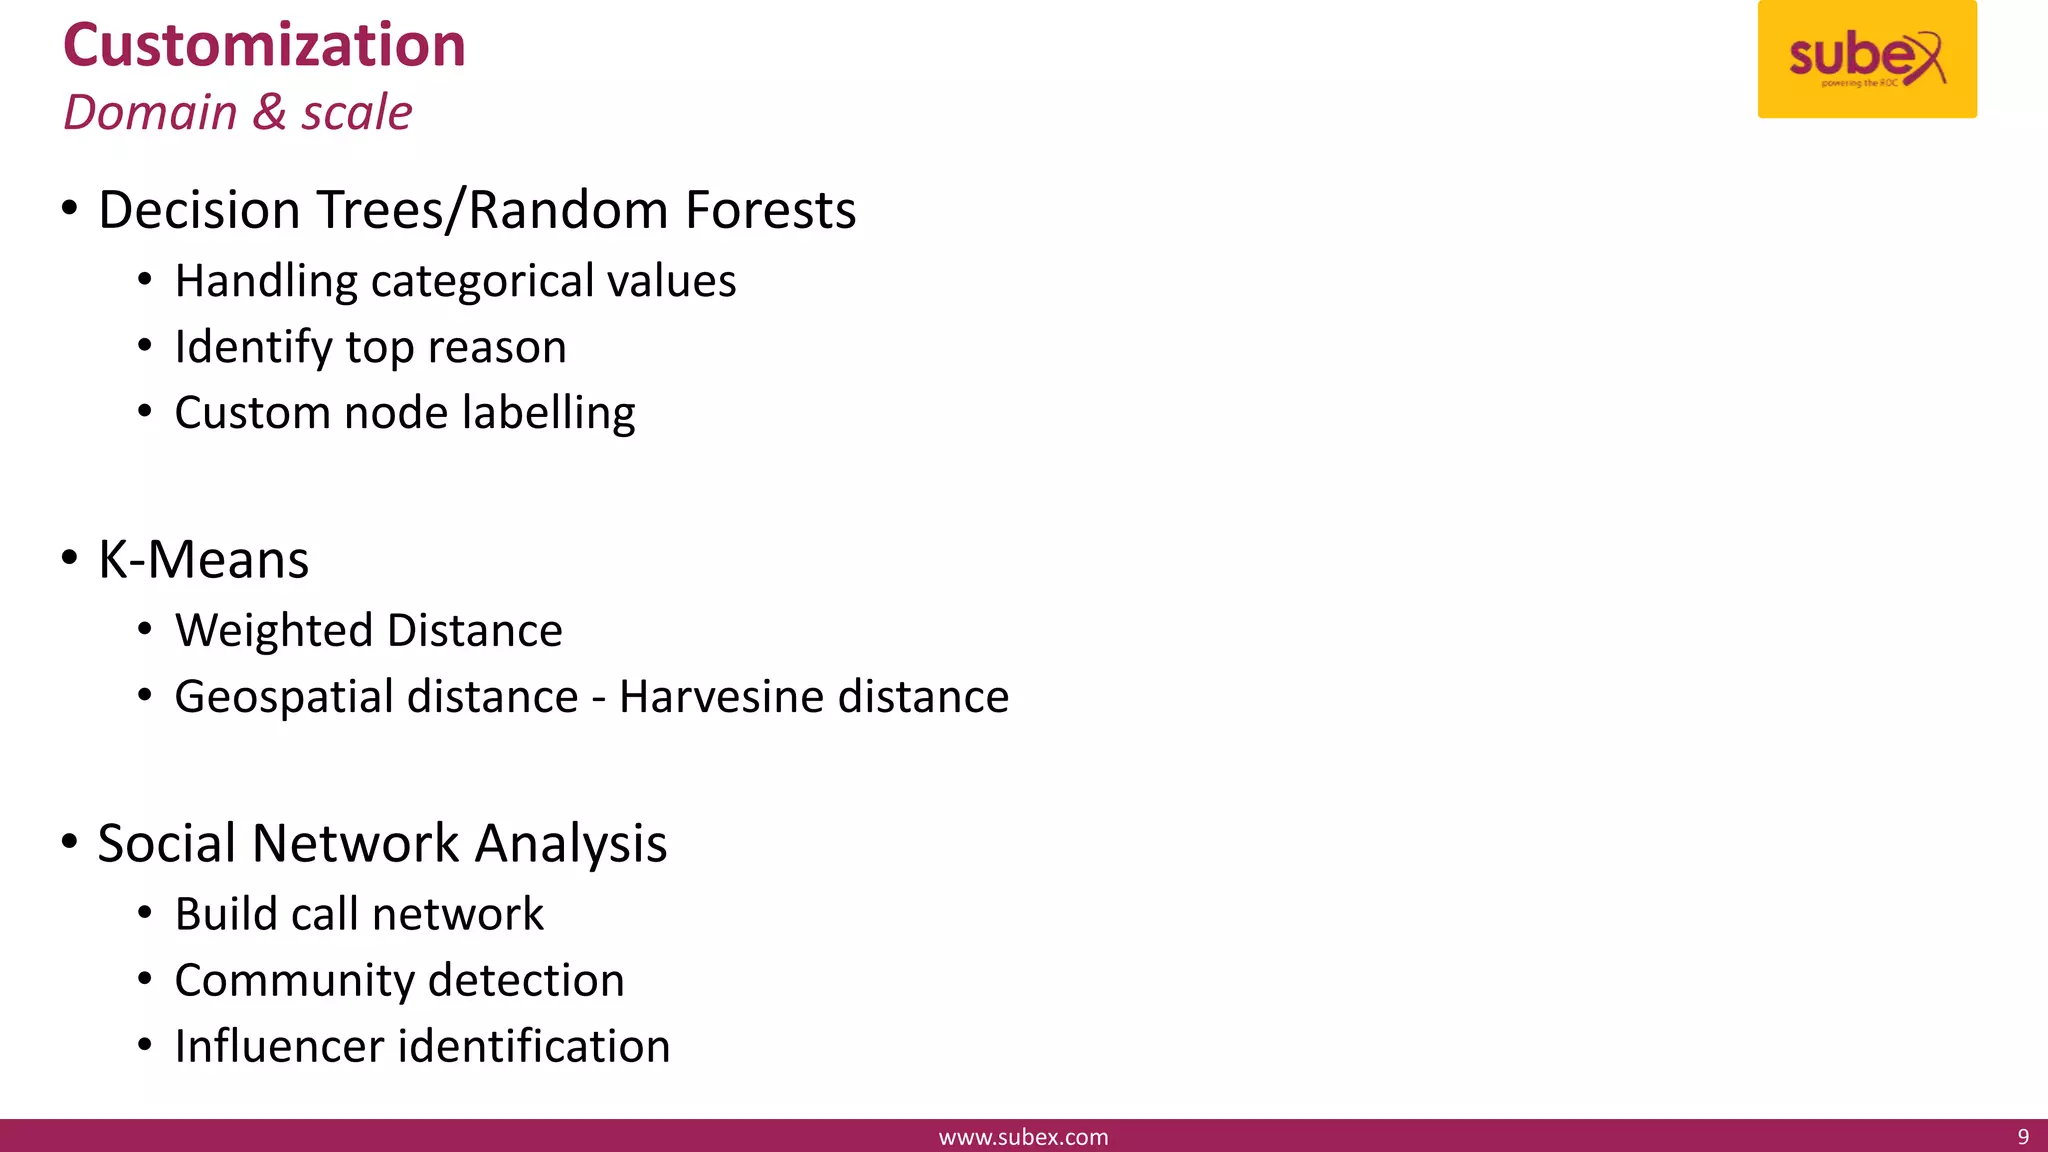
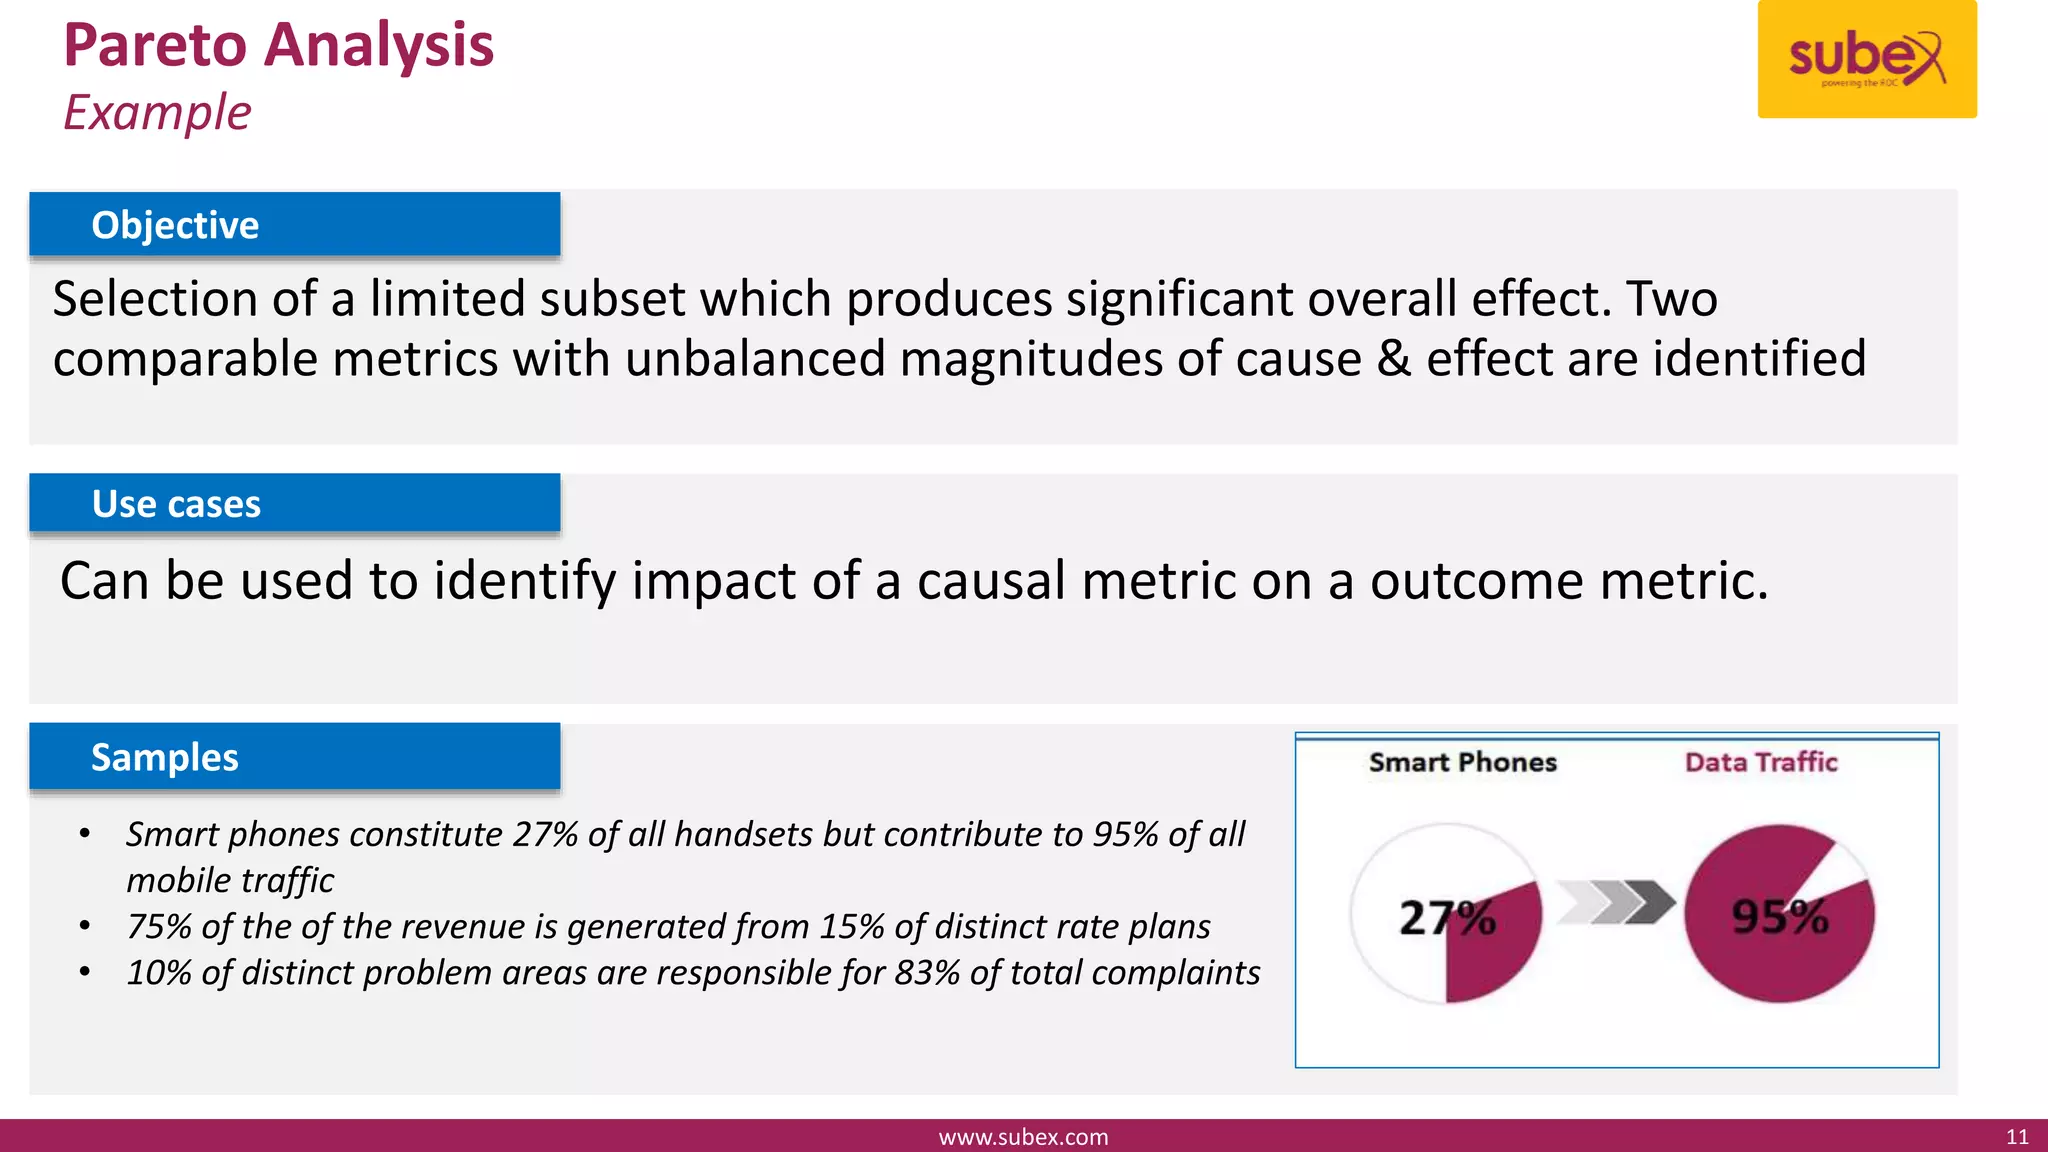
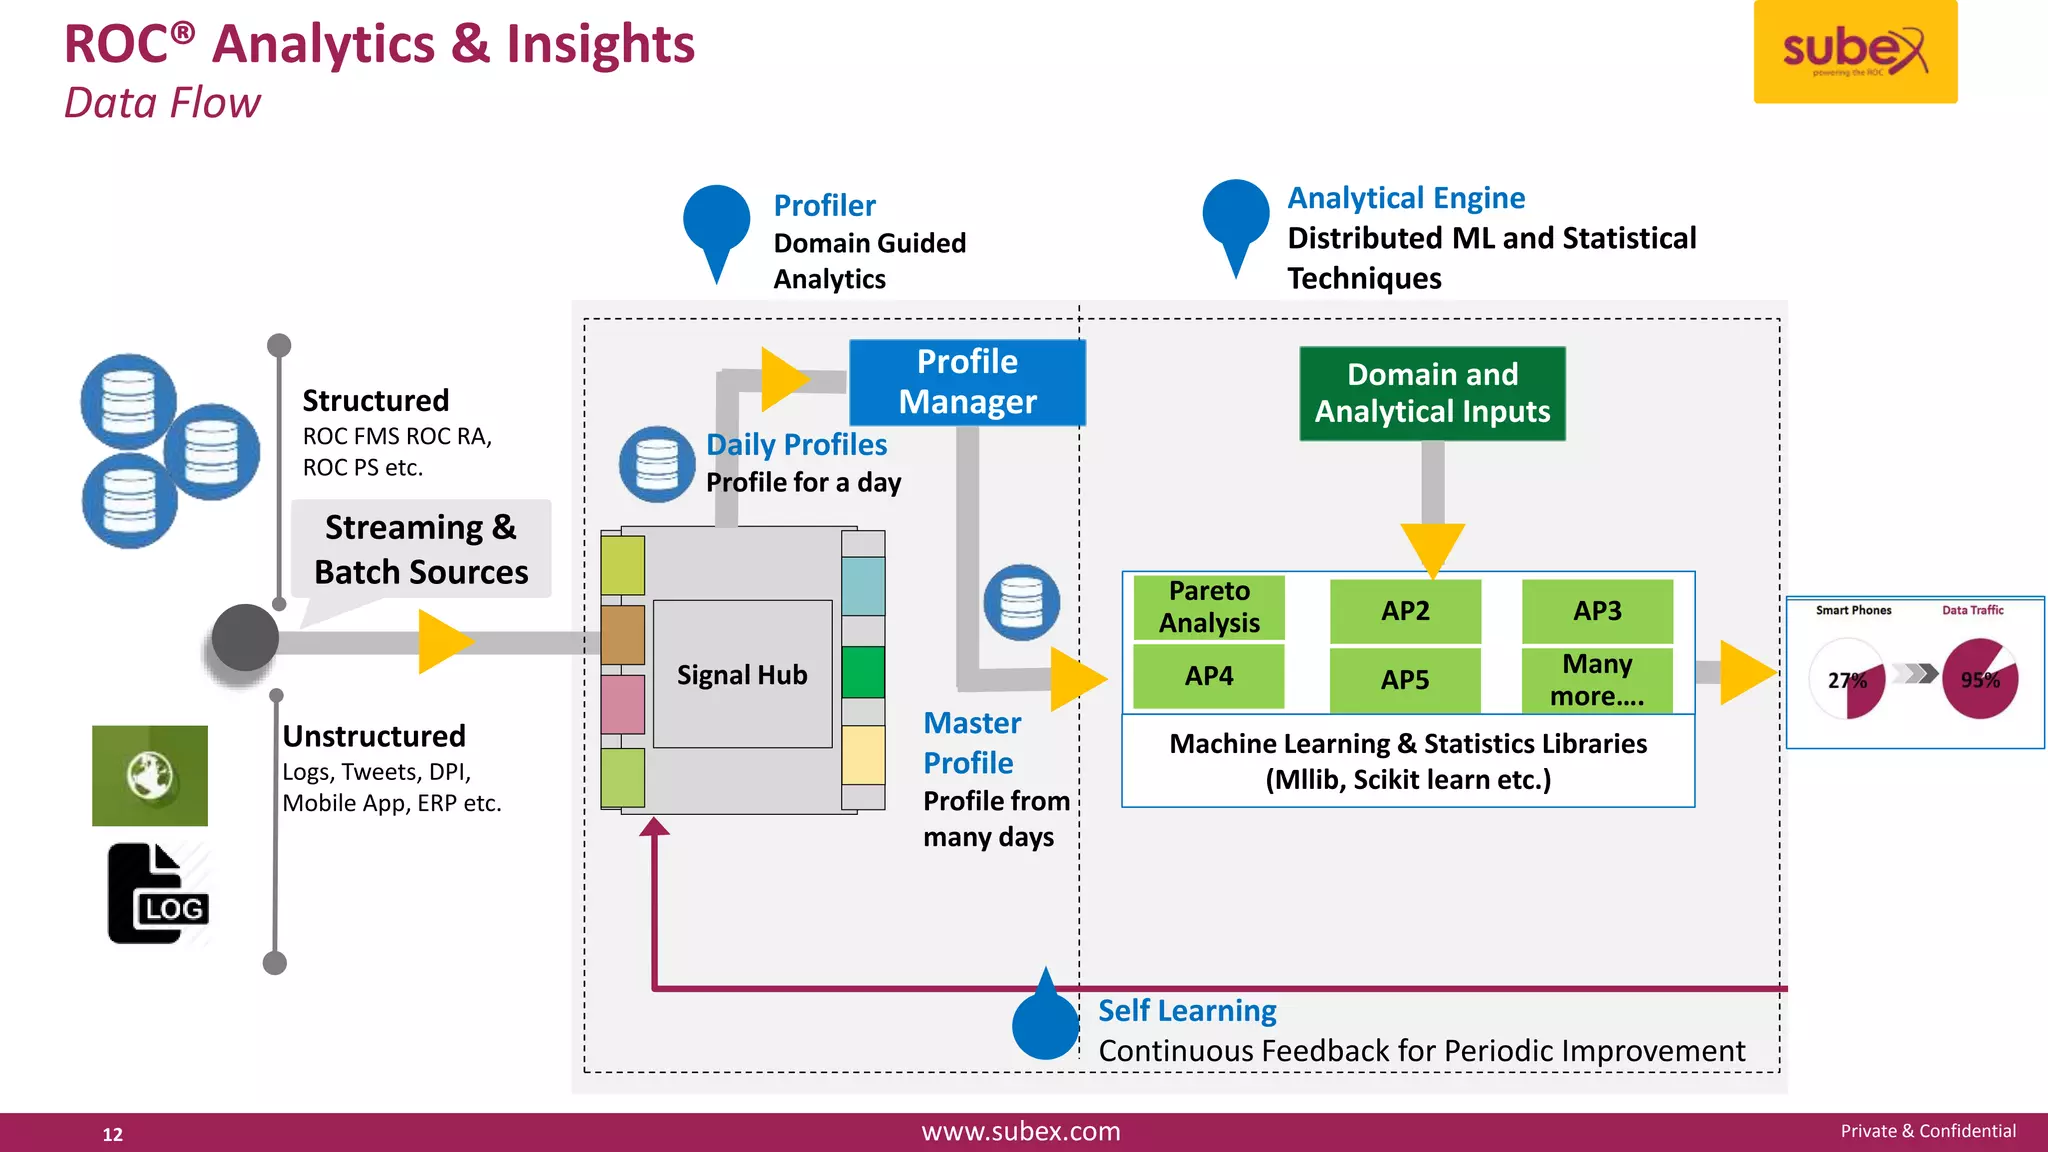
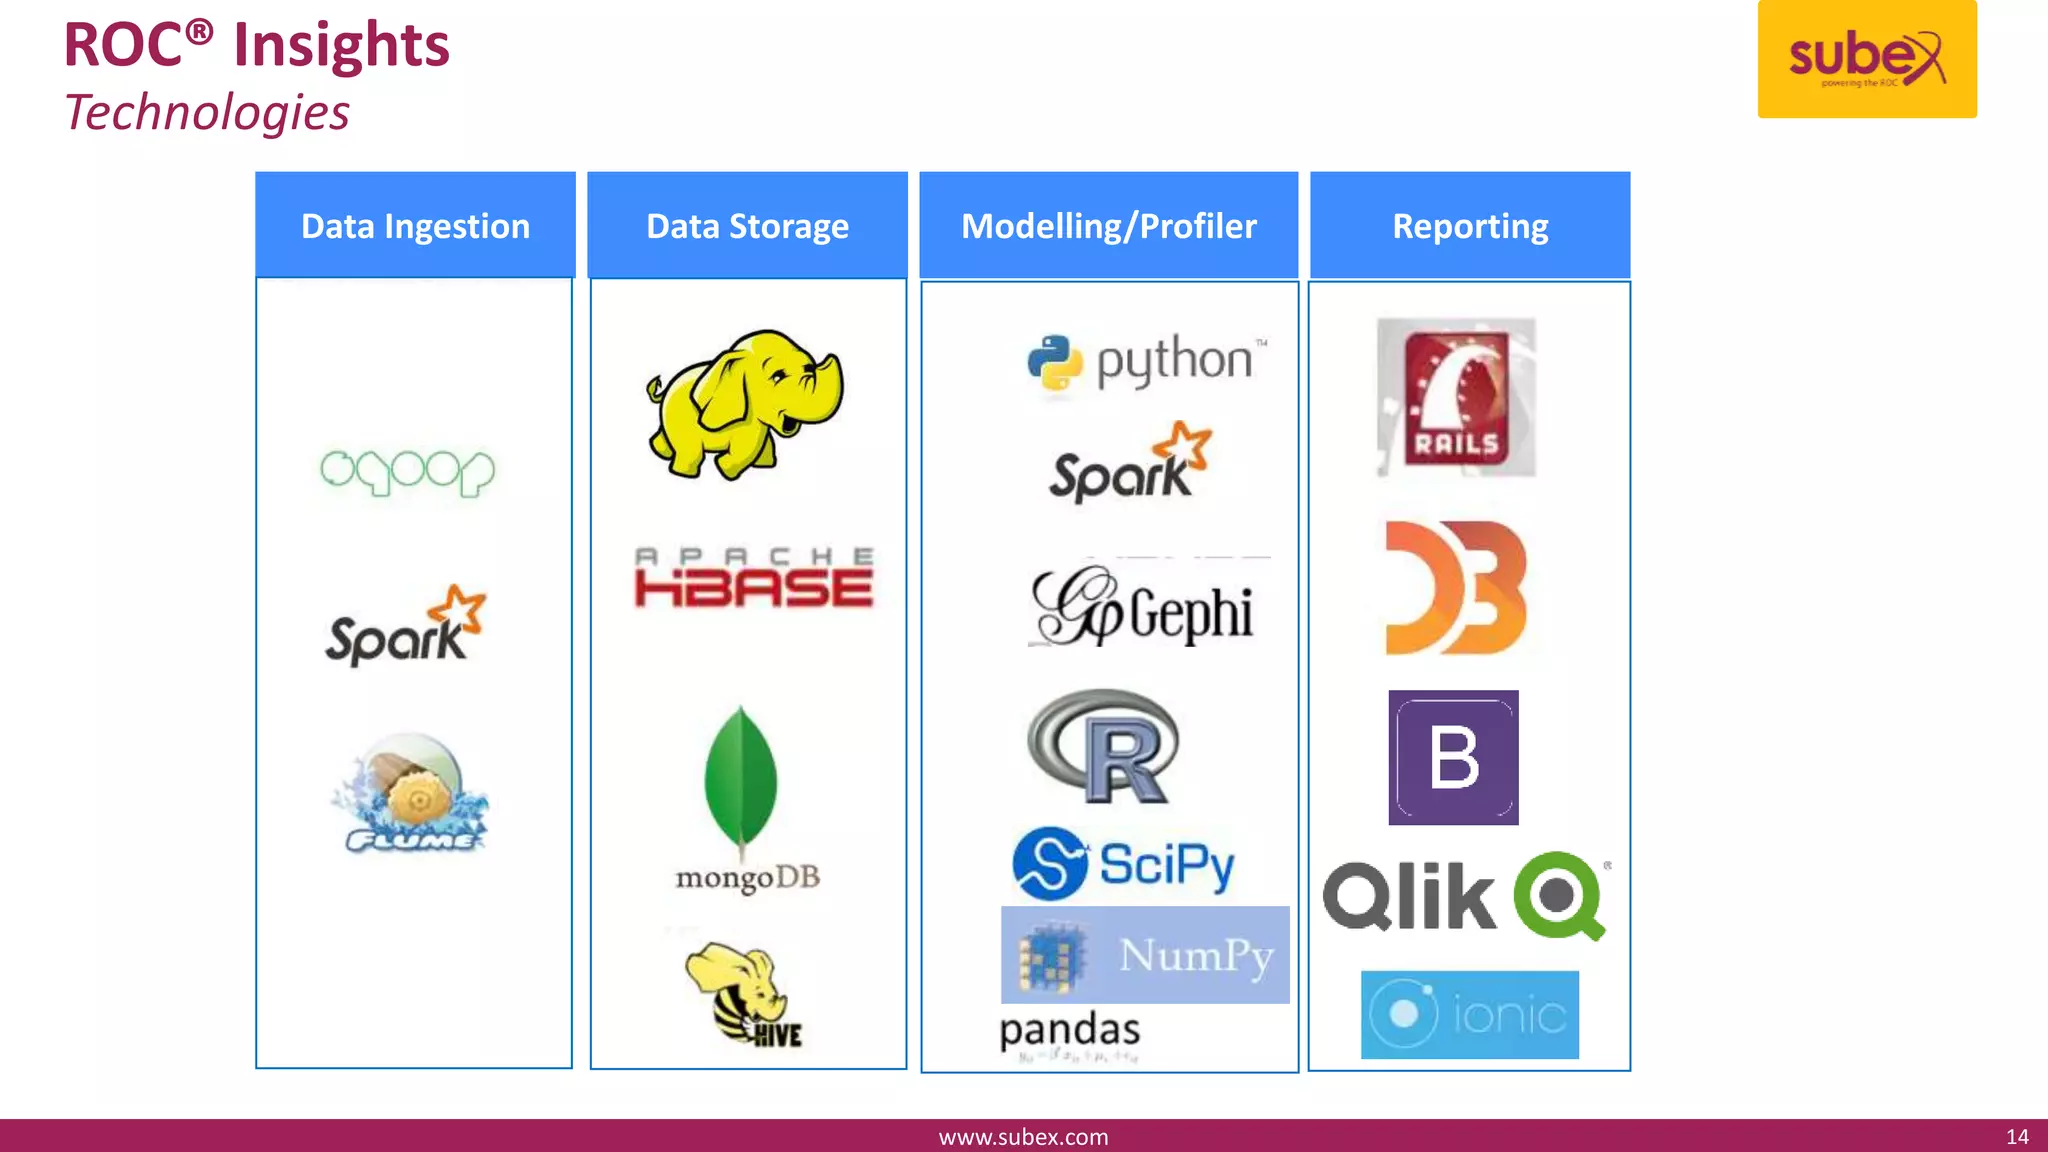
Platform for Data Scientists
Binu K, Architect Analytics Platform
www.subex.com
1
Why Platform?
www.subex.com
2
Data and Analytics
Capture
• Acquire, extract,
parse, aggregate
Analyze
• Feature Engineering,
Exploratory analysis
Modelling
• Machine learning,
Statistics,
Optimisation
Analytics Output
• Application to live
data - Trends,
Prediction
Communication of
Results
• Dashboards and
Reports
The process & pain areas
Time taken for data into insights – Few Months
3
60 – 75%
Credits : Forbes
Advantages
www.subex.com 4
Automate repeated routine jobs
• Data load
• Preprocessing
Maximum resource Utilization
• Scheduling job overnight
Focus more on business
• Look different use cases
• Solution areas
Integrated tool box
• Combine tools into one
environment
Expectations
Workbench
• Exploratory Data Analysis
• Advanced Modelling
• Distributed
Architecture
Bespoke Algorithms
• Customized ML algorithms
• Custom Approaches
Industrialization
• Packaged Analytics
Platform
www.subex.com 5
Workbench
www.subex.com
6
Work Bench
EDA
7
Querying capabilities
• Pointed queries
• Aggregations
• Partitioning
• Windowing
• Analytical functions
Descriptive Stats
• Univariate analysis
• Bivariate analysis
Predictive Modeling
• Building and testing
• Ensemble
Bespoke Algorithms
www.subex.com
8
Customization
• Decision Trees/Random Forests
• Handling categorical values
• Identify top reason
• Custom node labelling
• K-Means
• Weighted Distance
• Geospatial distance - Harvesine distance
• Social Network Analysis
• Build call network
• Community detection
• Influencer identification
Domain & scale
www.subex.com 9
Packaged Analytics
www.subex.com
10
Objective
www.subex.com 11
Pareto Analysis
Example
Selection of a limited subset which produces significant overall effect. Two
comparable metrics with unbalanced magnitudes of cause & effect are identified
Samples
• Smart phones constitute 27% of all handsets but contribute to 95% of all
mobile traffic
• 75% of the of the revenue is generated from 15% of distinct rate plans
• 10% of distinct problem areas are responsible for 83% of total complaints
Use cases
Can be used to identify impact of a causal metric on a outcome metric.
Private & Confidentialwww.subex.com
ROC® Analytics & Insights
Data Flow
12
Streaming &
Batch Sources
Structured
ROC FMS ROC RA,
ROC PS etc.
Unstructured
Logs, Tweets, DPI,
Mobile App, ERP etc.
Profiler
Domain Guided
Analytics
Analytical Engine
Distributed ML and Statistical
Techniques
Self Learning
Continuous Feedback for Periodic Improvement
Signal Hub
Domain and
Analytical Inputs
Daily Profiles
Profile for a day
Profile
Manager
Master
Profile
Profile from
many days
Pareto
Analysis
Machine Learning & Statistics Libraries
(Mllib, Scikit learn etc.)
AP4
AP2
AP5
AP3
Many
more….
Recipe for Success
Regardless of what some software vendor advertisements may claim, you can’t
just purchase some Analytics software, install it, sit back, and watch it solve all
your problems.
Right combination of domain (business acumen) and analytics is required to
solve any business problem
www.subex.com 13
“There is a tendency of solving one’s problems by
means of much equipment rather than thought."
Alan Turing.
ROC® Insights
Technologies
www.subex.com 14
Data Ingestion Data Storage Modelling/Profiler Reporting
Thank You
binu.k@subex.com
www.subex.com
15
Techomics
Architecture
16

Platform for Data Scientists

  • 1.
    Platform for DataScientists Binu K, Architect Analytics Platform www.subex.com 1
  • 2.
  • 3.
    Data and Analytics Capture •Acquire, extract, parse, aggregate Analyze • Feature Engineering, Exploratory analysis Modelling • Machine learning, Statistics, Optimisation Analytics Output • Application to live data - Trends, Prediction Communication of Results • Dashboards and Reports The process & pain areas Time taken for data into insights – Few Months 3 60 – 75% Credits : Forbes
  • 4.
    Advantages www.subex.com 4 Automate repeatedroutine jobs • Data load • Preprocessing Maximum resource Utilization • Scheduling job overnight Focus more on business • Look different use cases • Solution areas Integrated tool box • Combine tools into one environment
  • 5.
    Expectations Workbench • Exploratory DataAnalysis • Advanced Modelling • Distributed Architecture Bespoke Algorithms • Customized ML algorithms • Custom Approaches Industrialization • Packaged Analytics Platform www.subex.com 5
  • 6.
  • 7.
    Work Bench EDA 7 Querying capabilities •Pointed queries • Aggregations • Partitioning • Windowing • Analytical functions Descriptive Stats • Univariate analysis • Bivariate analysis Predictive Modeling • Building and testing • Ensemble
  • 8.
  • 9.
    Customization • Decision Trees/RandomForests • Handling categorical values • Identify top reason • Custom node labelling • K-Means • Weighted Distance • Geospatial distance - Harvesine distance • Social Network Analysis • Build call network • Community detection • Influencer identification Domain & scale www.subex.com 9
  • 10.
  • 11.
    Objective www.subex.com 11 Pareto Analysis Example Selectionof a limited subset which produces significant overall effect. Two comparable metrics with unbalanced magnitudes of cause & effect are identified Samples • Smart phones constitute 27% of all handsets but contribute to 95% of all mobile traffic • 75% of the of the revenue is generated from 15% of distinct rate plans • 10% of distinct problem areas are responsible for 83% of total complaints Use cases Can be used to identify impact of a causal metric on a outcome metric.
  • 12.
    Private & Confidentialwww.subex.com ROC®Analytics & Insights Data Flow 12 Streaming & Batch Sources Structured ROC FMS ROC RA, ROC PS etc. Unstructured Logs, Tweets, DPI, Mobile App, ERP etc. Profiler Domain Guided Analytics Analytical Engine Distributed ML and Statistical Techniques Self Learning Continuous Feedback for Periodic Improvement Signal Hub Domain and Analytical Inputs Daily Profiles Profile for a day Profile Manager Master Profile Profile from many days Pareto Analysis Machine Learning & Statistics Libraries (Mllib, Scikit learn etc.) AP4 AP2 AP5 AP3 Many more….
  • 13.
    Recipe for Success Regardlessof what some software vendor advertisements may claim, you can’t just purchase some Analytics software, install it, sit back, and watch it solve all your problems. Right combination of domain (business acumen) and analytics is required to solve any business problem www.subex.com 13 “There is a tendency of solving one’s problems by means of much equipment rather than thought." Alan Turing.
  • 14.
    ROC® Insights Technologies www.subex.com 14 DataIngestion Data Storage Modelling/Profiler Reporting
  • 15.
  • 16.

Editor's Notes

  • #4 Majority of time taken is data cleansing. Reasons: The coding of the data is inconsistent (e.g. date is sometimes Day-Month-Year, and sometimes Month-Day-Year) Data is made available in separate tables, but merge keys for join are missing Dependent variables for the analysis are largely missing Many fields appear to contain wild (clearly impossible) values Ambiguity regarding whether a value is valid or missing (e.g. age is 99) The unit of observation in the data is not appropriate for analysis (e.g transaction level data but analysis is required at customer level) http://www.forbes.com/sites/gilpress/2016/03/23/data-preparation-most-time-consuming-least-enjoyable-data-science-task-survey-says/#57bc6a597f75
  • #8 Query on profile and raw table; H2O is an open source, in-memory, distributed, fast, and scalable machine learning and predictive analytics platform that allows you to build machine learning models on big data and provides easy productionalization of those models in an enterprise environment. H2O’s core code is written in Java. Inside H2O, a Distributed Key/Value store is used to access and reference data, models, objects, etc., across all nodes and machines. The algorithms are implemented on top of H2O’s distributed Map/Reduce framework and utilize the Java Fork/Join framework for multi-threading. H2O’s REST API allows access to all the capabilities of H2O from an external program or script via JSON over HTTP. The Rest API is used by H2O’s web interface (Flow UI), R binding (H2O-R), and Python binding (H2O-Python). Sparkling Water allows users to combine the fast, scalable machine learning algorithms of H2O with the capabilities of Spark. With Sparkling Water, users can drive computation from Scala/R/Python and utilize the H2O Flow UI, providing an ideal machine learning platform for application developers http://blog.cloudera.com/blog/2015/10/how-to-build-a-machine-learning-app-using-sparkling-water-and-apache-spark/
  • #11 Transform analytics insights to business insights Not just an algorithm. Infused with business contexts Customized to @ Telecom Scale Association - Both categorical – Cramers V; Catg & Conti : simple linear regression with categorical as explanatory variable - One-way ANOVA
  • #12 The Pareto principle is a principle, named after economist Vilfredo Pareto, that specifies an unequal relationship between inputs and outputs.. It states that, for many events, roughly 80% of the effects come from 20% of the causes. ... Pareto developed both concepts in the context of the distribution of income and wealth among the population.