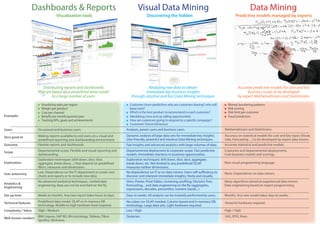
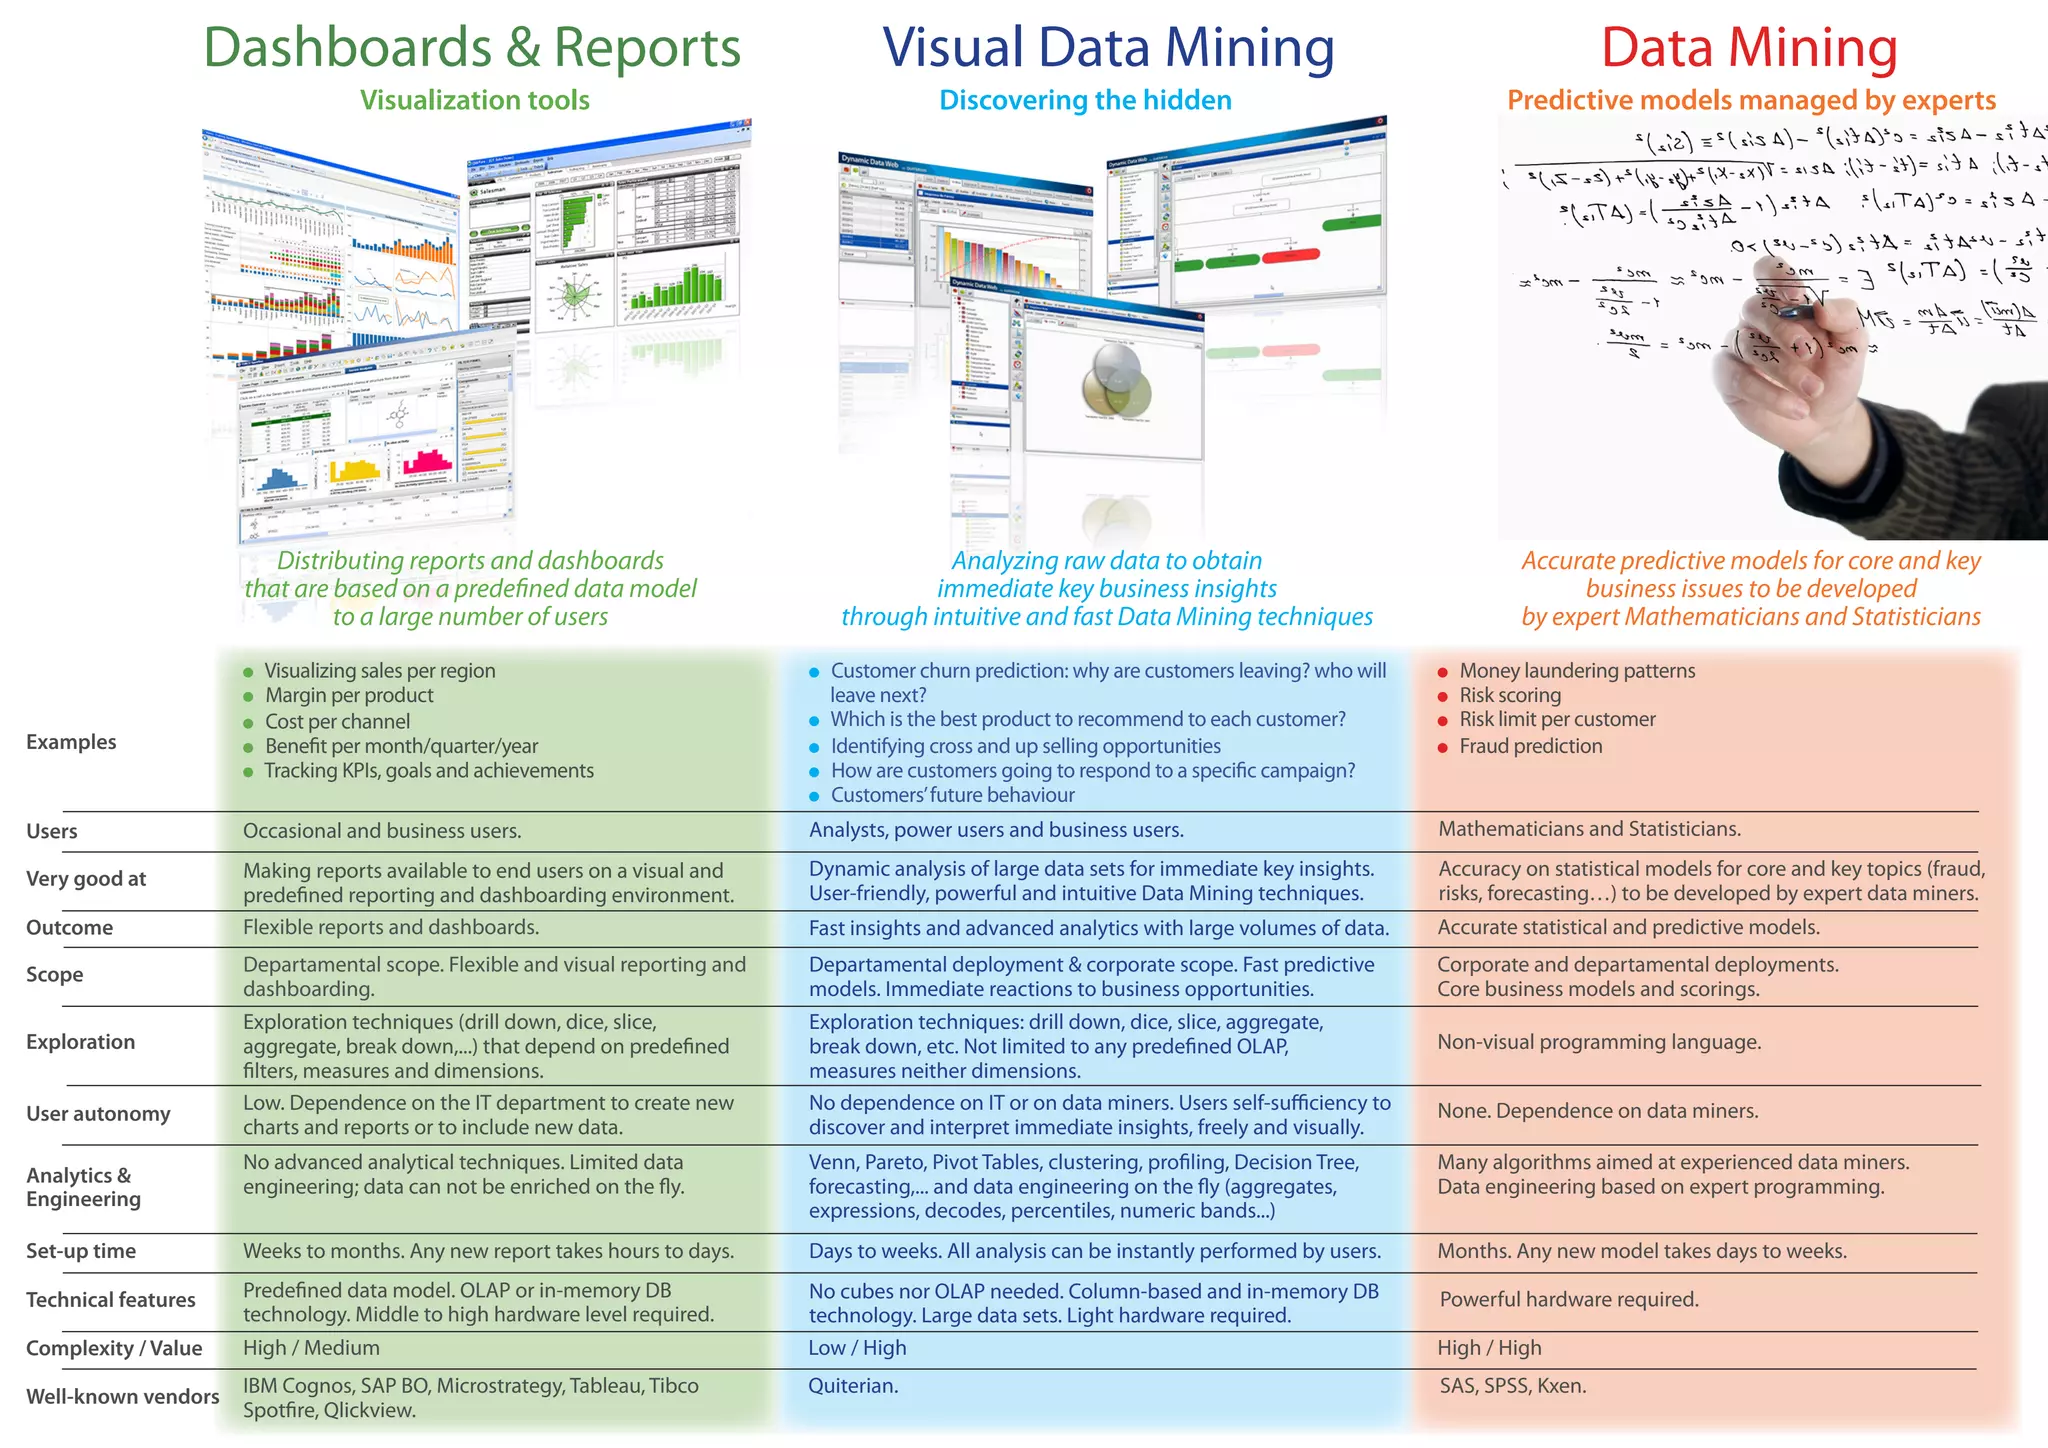
Dashboards & Reports                                              Visual Data Mining                                                             Data Mining
                                  Visualization tools                                         Discovering the hidden                                      Predictive models managed by experts


                         Distributing reports and dashboards                                Analyzing raw data to obtain                                    Accurate predictive models for core and key
                      that are based on a predefined data model                            immediate key business insights                                        business issues to be developed
                               to a large number of users                         through intuitive and fast Data Mining techniques                         by expert Mathematicians and Statisticians
                        Visualizing sales per region                             Customer churn prediction: why are customers leaving? who will      Money laundering patterns
                        Margin per product                                       leave next?                                                         Risk scoring
                        Cost per channel                                         Which is the best product to recommend to each customer?            Risk limit per customer
Examples                Benefit per month/quarter/year                           Identifying cross and up selling opportunities                      Fraud prediction
                        Tracking KPIs, goals and achievements                    How are customers going to respond to a specific campaign?
                                                                                 Customers’ future behaviour
Users                 Occasional and business users.                           Analysts, power users and business users.                           Mathematicians and Statisticians.

Very good at          Making reports available to end users on a visual and    Dynamic analysis of large data sets for immediate key insights.     Accuracy on statistical models for core and key topics (fraud,
                      predefined reporting and dashboarding environment.       User-friendly, powerful and intuitive Data Mining techniques.       risks, forecasting…) to be developed by expert data miners.
Outcome               Flexible reports and dashboards.                         Fast insights and advanced analytics with large volumes of data.    Accurate statistical and predictive models.

Scope                 Departamental scope. Flexible and visual reporting and   Departamental deployment & corporate scope. Fast predictive         Corporate and departamental deployments.
                      dashboarding.                                            models. Immediate reactions to business opportunities.              Core business models and scorings.
                      Exploration techniques (drill down, dice, slice,         Exploration techniques: drill down, dice, slice, aggregate,
Exploration           aggregate, break down,...) that depend on predefined     break down, etc. Not limited to any predefined OLAP,                Non-visual programming language.
                      filters, measures and dimensions.                        measures neither dimensions.
User autonomy         Low. Dependence on the IT department to create new       No dependence on IT or on data miners. Users self-sufficiency to    None. Dependence on data miners.
                      charts and reports or to include new data.               discover and interpret immediate insights, freely and visually.
                      No advanced analytical techniques. Limited data          Venn, Pareto, Pivot Tables, clustering, profiling, Decision Tree,   Many algorithms aimed at experienced data miners.
Analytics &           engineering; data can not be enriched on the fly.        forecasting,... and data engineering on the fly (aggregates,        Data engineering based on expert programming.
Engineering
                                                                               expressions, decodes, percentiles, numeric bands...)
Set-up time           Weeks to months. Any new report takes hours to days.     Days to weeks. All analysis can be instantly performed by users.    Months. Any new model takes days to weeks.

Technical features    Predefined data model. OLAP or in-memory DB              No cubes nor OLAP needed. Column-based and in-memory DB             Powerful hardware required.
                      technology. Middle to high hardware level required.      technology. Large data sets. Light hardware required.
Complexity / Value    High / Medium                                            Low / High                                                          High / High
                      IBM Cognos, SAP BO, Microstrategy, Tableau, Tibco        Quiterian.                                                          SAS, SPSS, Kxen.
Well-known vendors
                      Spotfire, Qlickview.

Today's bi and data mining ecosystem v2

  • 1.
    Dashboards & Reports Visual Data Mining Data Mining Visualization tools Discovering the hidden Predictive models managed by experts Distributing reports and dashboards Analyzing raw data to obtain Accurate predictive models for core and key that are based on a predefined data model immediate key business insights business issues to be developed to a large number of users through intuitive and fast Data Mining techniques by expert Mathematicians and Statisticians Visualizing sales per region Customer churn prediction: why are customers leaving? who will Money laundering patterns Margin per product leave next? Risk scoring Cost per channel Which is the best product to recommend to each customer? Risk limit per customer Examples Benefit per month/quarter/year Identifying cross and up selling opportunities Fraud prediction Tracking KPIs, goals and achievements How are customers going to respond to a specific campaign? Customers’ future behaviour Users Occasional and business users. Analysts, power users and business users. Mathematicians and Statisticians. Very good at Making reports available to end users on a visual and Dynamic analysis of large data sets for immediate key insights. Accuracy on statistical models for core and key topics (fraud, predefined reporting and dashboarding environment. User-friendly, powerful and intuitive Data Mining techniques. risks, forecasting…) to be developed by expert data miners. Outcome Flexible reports and dashboards. Fast insights and advanced analytics with large volumes of data. Accurate statistical and predictive models. Scope Departamental scope. Flexible and visual reporting and Departamental deployment & corporate scope. Fast predictive Corporate and departamental deployments. dashboarding. models. Immediate reactions to business opportunities. Core business models and scorings. Exploration techniques (drill down, dice, slice, Exploration techniques: drill down, dice, slice, aggregate, Exploration aggregate, break down,...) that depend on predefined break down, etc. Not limited to any predefined OLAP, Non-visual programming language. filters, measures and dimensions. measures neither dimensions. User autonomy Low. Dependence on the IT department to create new No dependence on IT or on data miners. Users self-sufficiency to None. Dependence on data miners. charts and reports or to include new data. discover and interpret immediate insights, freely and visually. No advanced analytical techniques. Limited data Venn, Pareto, Pivot Tables, clustering, profiling, Decision Tree, Many algorithms aimed at experienced data miners. Analytics & engineering; data can not be enriched on the fly. forecasting,... and data engineering on the fly (aggregates, Data engineering based on expert programming. Engineering expressions, decodes, percentiles, numeric bands...) Set-up time Weeks to months. Any new report takes hours to days. Days to weeks. All analysis can be instantly performed by users. Months. Any new model takes days to weeks. Technical features Predefined data model. OLAP or in-memory DB No cubes nor OLAP needed. Column-based and in-memory DB Powerful hardware required. technology. Middle to high hardware level required. technology. Large data sets. Light hardware required. Complexity / Value High / Medium Low / High High / High IBM Cognos, SAP BO, Microstrategy, Tableau, Tibco Quiterian. SAS, SPSS, Kxen. Well-known vendors Spotfire, Qlickview.