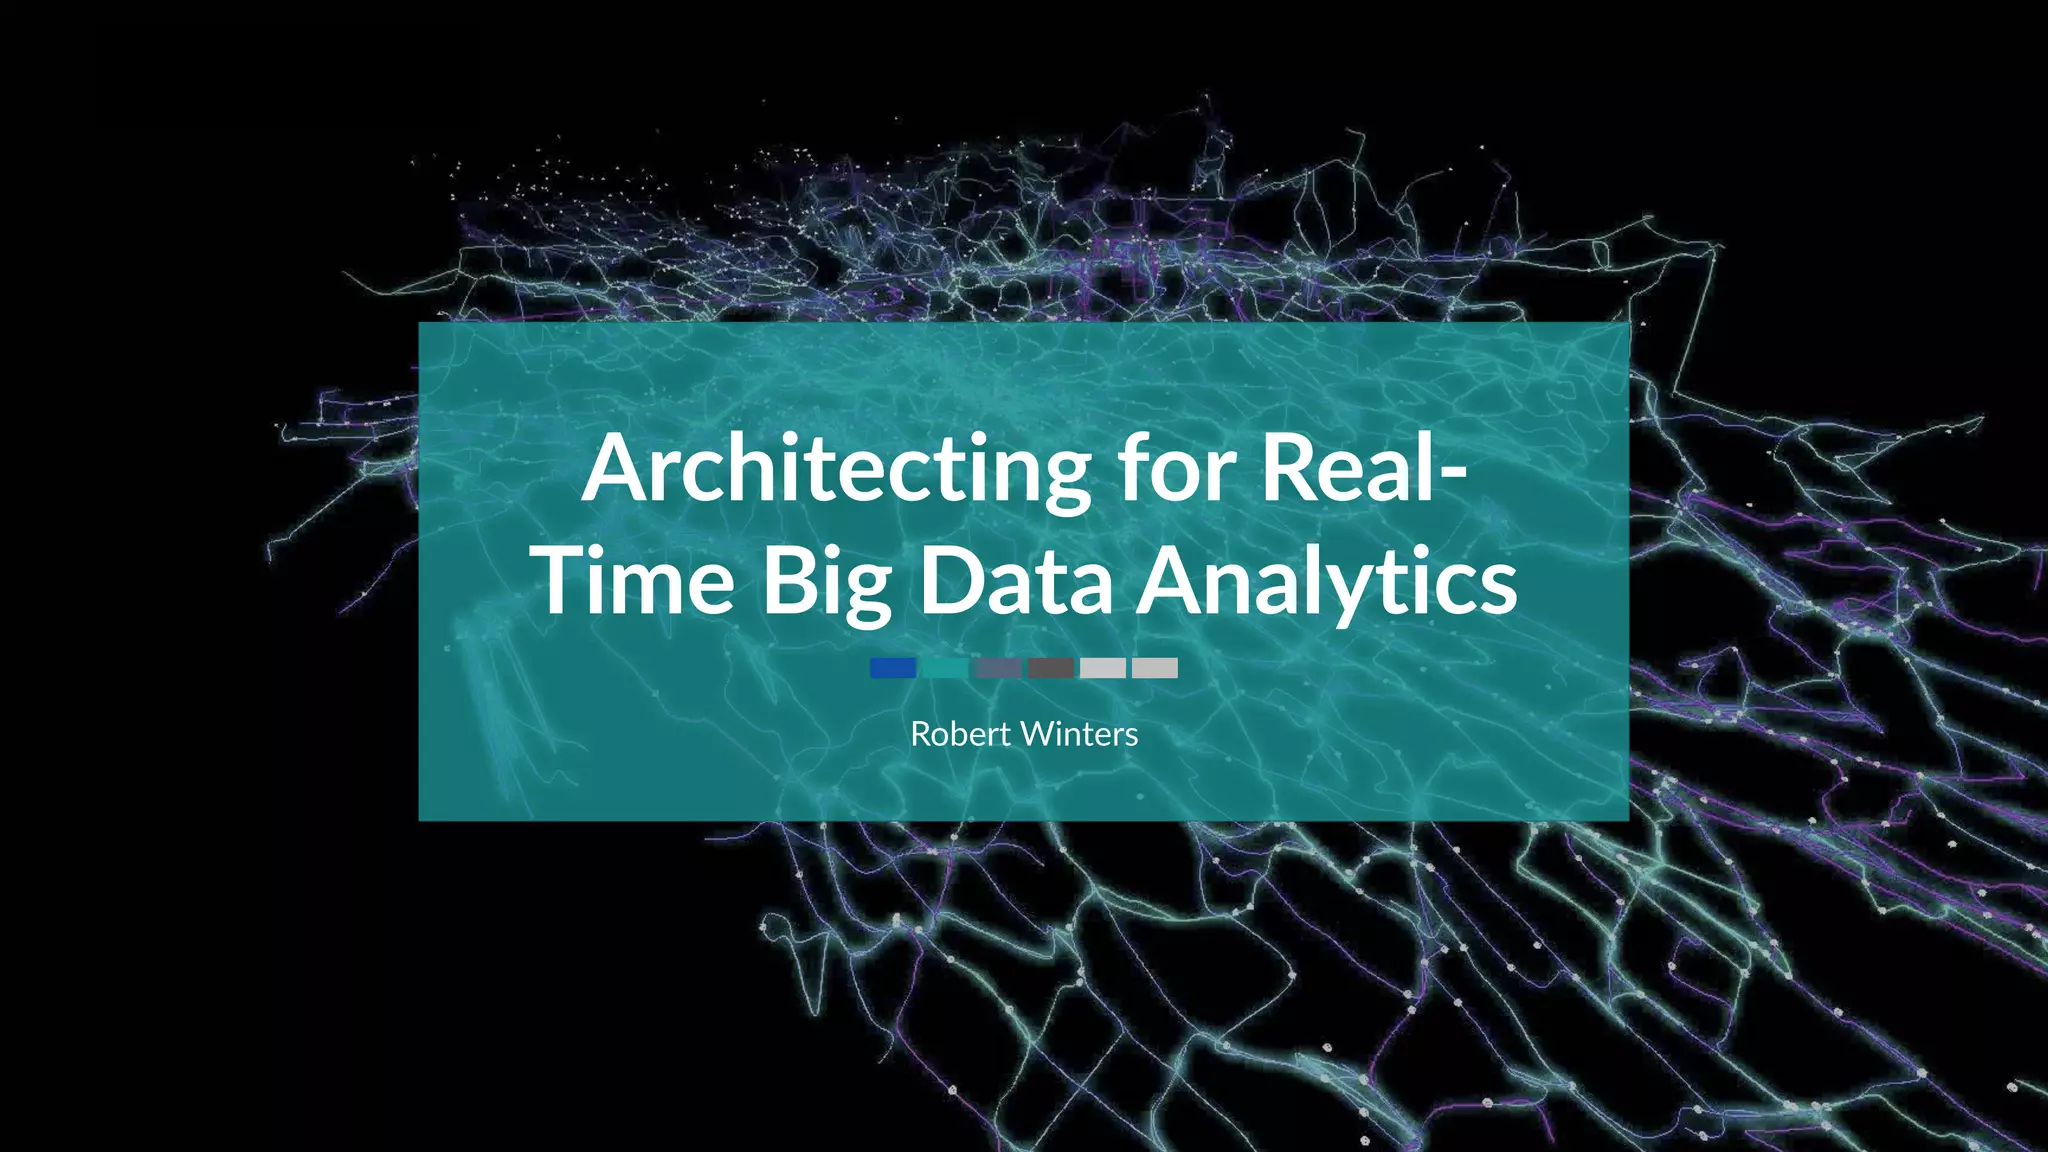
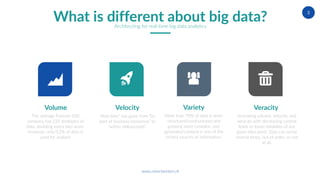
Slides from a talk given on 7 April, 2016 regarding best practices for building a federated data platform to support data science, reporting, and business analytics
1. Spil Games uses a bottoms-up monthly forecasting process where ARIMA models in R are used to generate initial traffic forecasts for 500 markets/channels which are then loaded into Tableau for exploratory analysis and adjustment.
2. Key business users explore and modify the forecasts in Tableau before the adjusted forecast is loaded back into the data warehouse.
3. Forecasting considers factors like seasonality, known events, and regressors to predict metrics like traffic, gameplays, pageviews, and advertising across markets/channels on a monthly basis.
Billions of Rows, Millions of Insights, Right NowRob Winters
Presentation from Tableau Customer Conference 2013 on building a real time reporting/analytics platform. Topics discussed include definitions of big data and real time, technology choices and rationale, use cases for real time big data, architecture, and pitfalls to avoid.
Design Principles for a Modern Data WarehouseRob Winters
This document discusses design principles for a modern data warehouse based on case studies from de Bijenkorf and Travelbird. It advocates for a scalable cloud-based architecture using a bus, lambda architecture to process both real-time and batch data, a federated data model to handle structured and unstructured data, massively parallel processing databases, an agile data model like Data Vault, code automation, and using ELT rather than ETL. Specific technologies used by de Bijenkorf include AWS services, Snowplow, Rundeck, Jenkins, Pentaho, Vertica, Tableau, and automated Data Vault loading. Travelbird additionally uses Hadoop for initial data processing before loading into Redshift
The document provides an overview of data warehousing. It discusses why data warehouses are created (to address problems with traditional data systems), defines what a data warehouse is, and outlines the goals of consistency, durability and accessibility. The document then gives a brief history of data warehousing, describing its origins and early challenges. It also discusses how approaches to data warehousing have evolved over time, with newer techniques like data lakes, ELT, and treating data as code. Finally, it provides an example of a real-world data warehouse implementation at TripActions.
This document discusses a platform for data scientists that aims to automate routine jobs, maximize resource utilization, and allow data scientists to focus more on business solutions. The platform provides capabilities for data capture, analysis, modeling, and output of analytics. It seeks to reduce the time taken to turn data into insights from months to weeks. Key elements of the platform include tools for exploratory data analysis, advanced modeling, distributed architecture, bespoke algorithms, and packaged analytics solutions.
Webinar with SnagAJob, HP Vertica and Looker - Data at the speed of busines s...Looker
Enterprise companies are struggling to manage increasing demands for data with legacy BI tools. By centralizing their data in Vertica, SnagAJob, an online marketplace for hourly jobs with over 60 million users, can now use Looker to create a single source of truth and put data in the hands of decision-makers across the company.
Analytics-Enabled Experiences: The New Secret WeaponDatabricks
Tracking and analyzing how our individual products come together has always been an elusive problem for Steelcase. Our problem can be thought of in the following way: “we know how many Lego pieces we sell, yet we don’t know what Lego set our customers buy.” The Data Science team took over this initiative, which resulted in an evolution of our analytics journey. It is a story of innovation, resilience, agility and grit.
The effects of the COVID-19 pandemic on corporate America shined the spotlight on office furniture manufacturers to solve for ways on which the office can be made safe again. The team would have never imagined how relevant our work on product application analytics would become. Product application analytics became an industry priority overnight.
The proposal presented this year is the story of how data science is helping corporations bring people back to the office and set the path to lead the reinvention of the office space.
After groundbreaking milestones to overcome technical challenges, the most important question is: What do we do with this? How do we scale this? How do we turn this opportunity into a true competitive advantage? The response: stop thinking about this work as a data science project and start to think about this as an analytics-enabled experience.
During our session we will cover the technical elements that we overcame as a team to set-up a pipeline that ingests semi-structured and unstructured data at scale, performs analytics and produces digital experiences for multiple users.
This presentation will be particularly insightful for Data Scientists, Data Engineers and analytics leaders who are seeking to better understand how to augment the value of data for their organization
The document summarizes a presentation about data vault automation at a Dutch department store chain called de Bijenkorf. It discusses the project objectives of having a single source of reports and integrating with production systems. An architectural overview is provided, including the use of AWS services, a Snowplow event tracker, and Vertica data warehouse. Automation was implemented for loading data from over 250 source tables into the data vault and then into information marts. This reduced ETL development time and improved auditability. The data vault supports customer analysis, personalization, and business intelligence uses at de Bijenkorf. Drivers of the project's success included the AWS infrastructure, automation approach, and Pentaho ETL framework.
VoltDB and HPE Vertica Present: Building an IoT Architecture for Fast + Big DataVoltDB
This webinar with Chris Selland of HPE Vertica and Dennis Duckworth of VoltDB addresses the growing challenges with managing a complex IoT solution and how to enable real-time operational interaction with comprehensive data analytics.
Yellowbrick Webcast with DBTA for Real-Time AnalyticsYellowbrick Data
This document discusses key capabilities needed for real-time analytics. It notes that real-time data, combined with historical data, provides important context for decision making. Building data pipelines with fewer systems and steps leads to greater scalability and reliability. The document outlines needs for real-time analytics like ingesting streaming data, powering analytic applications, delivering massive capacity, and guaranteeing performance. It emphasizes that both real-time and historical data are important for analytics and that the right architecture can incorporate multiple data sources and workloads.
The European Conference on Software Architecture (ECSA) 14 - IBM BigData Refe...Romeo Kienzler
The document discusses reference architectures for enterprise big data use cases. It begins by providing background on how databases have scaled over time and the evolution of large-scale data processing. It then discusses the basic idea behind big data use cases, which is to use all available data regardless of structure or source. The document outlines some key requirements like fault tolerance, dynamic scaling, and processing all data types. It proposes an architectural approach using NoSQL databases and cloud computing alongside traditional data warehousing. Finally, it shares two reference architectures - the current IBM approach and a transitional approach.
Modernizing to a Cloud Data ArchitectureDatabricks
Organizations with on-premises Hadoop infrastructure are bogged down by system complexity, unscalable infrastructure, and the increasing burden on DevOps to manage legacy architectures. Costs and resource utilization continue to go up while innovation has flatlined. In this session, you will learn why, now more than ever, enterprises are looking for cloud alternatives to Hadoop and are migrating off of the architecture in large numbers. You will also learn how elastic compute models’ benefits help one customer scale their analytics and AI workloads and best practices from their experience on a successful migration of their data and workloads to the cloud.
A summary of the philosophy and approach taken by the TravelBird Data Science team (and company as a whole) that allows rapid development of new machine learning algorithms, data insights, and integration into production and operations.
How Yellowbrick Data Integrates to Existing Environments WebcastYellowbrick Data
This document discusses how Yellowbrick can integrate into existing data environments. It describes Yellowbrick's data warehouse capabilities and how it compares to other solutions. The document recommends upgrading from single server databases or traditional MPP systems to Yellowbrick when data outgrows a single server or there are too many disparate systems. It also recommends moving from pre-configured or cloud-only systems to Yellowbrick to significantly reduce costs while improving query performance. The document concludes with a security demonstration using a netflow dataset.
Data Mesh in Practice: How Europe’s Leading Online Platform for Fashion Goes ...Databricks
Zalando transitioned from a centralized data platform to a data mesh architecture. This decentralized their data infrastructure by having individual domains own datasets and pipelines rather than a central team. It provided self-service data infrastructure tools and governance to enable domains to operate independently while maintaining global interoperability. This improved data quality by making domains responsible for their data and empowering them through the data mesh approach.
SplunkSummit 2015 - Real World Big Data ArchitectureSplunk
This document discusses big data architectures using Splunk, Hadoop, and relational databases. It begins with an overview of Splunk's scalability and real-time analytics capabilities. It then discusses Hunk, an analytics platform for Hadoop that provides self-service analytics. The document also examines using structured data in Splunk and connecting to relational databases. A case study examines challenges with the open source Hadoop ecosystem. Finally, it outlines a real-world customer architecture that uses Splunk for machine data, Hadoop for storage, Hunk for analytics, and connects to relational databases.
Denodo DataFest 2017: Outpace Your Competition with Real-Time ResponsesDenodo
Watch the presentation on-demand now: https://goo.gl/kceFTe
Today’s digital economy demands a new way of running business. Flexible access to information and responses in real time are essential for outpacing competition.
Watch this Denodo DataFest 2017 session to discover:
• Data access challenges faced by organizations today.
• How data virtualization facilitates real-time analytics.
• Key use cases and customer success stories.
Empowering Real Time Patient Care Through Spark StreamingDatabricks
Takeda’s Plasma Derived Therapies (PDT) business unit has recently embarked on a project to use Spark Streaming on Databricks to empower how they deliver value to their Plasma Donation centers. As patients come in and interface without clinics, we store and track all of the patient interactions in real time and deliver outputs and results based on said interactions. The current problem with our existing architecture is that it is very expensive to maintain and has an unsustainable number of failure points. Spark Streaming is essential for allowing this use case because it allows for a more robust ETL pipeline. With Spark Streaming, we are able to replace our existing ETL processes (that are based on Lamdbas, step functions, triggered jobs, etc) into a purely stream driven architecture.
Data is brought into our s3 raw layer as a large set of CSV files through AWS DMS and Informatica IICS as these services bring data from on-prem systems into our cloud layer. We have a stream currently running which takes these raw files up and merges them into Delta tables established in the bronze/stage layer. We are using AWS Glue as the metadata provider for all of these operations. From the stage layer, we have another set of streams using the stage Delta tables as their source, which transform and conduct stream to stream lookups before writing the enriched records into RDS (silver/prod layer). Once the data has been merged into RDS we have a DMS task which lifts the data back into S3 as CSV files. We have a small intermediary stream which merge these CSV files into corresponding delta tables, from which we have our gold/analytic streams. The on-prem systems are able to speak to the silver layer and allow for the near real-time latency that our patient care centers require.
Building a Distributed Collaborative Data Pipeline with Apache SparkDatabricks
The year of COVID-19 pandemic has spotlighted as never before the many shortcomings of the world’s data management workflows. The lack of established ways to exchange and access data was a highly recognized contributing factor in our poor response to the pandemic. On multiple occasions we have witnessed how our poor practices around reproducibility and provenance have completely sidetracked major vaccine research efforts, prompting many calls for action from scientific and medical communities to address these problems.
- Data observability is important for Spotify because they process massive amounts of data from 8 million events per second.
- To ensure observability, Spotify annotates and documents their data schemas, monitors pipeline execution times and counts to check for errors, monitors financial costs of pipelines and storage, and sets up alerts and dashboards to monitor for failures.
- Having good data observability helps Spotify understand where their data is coming from and going, troubleshoot issues quickly, and ensure royalty payments to artists are accurate since they rely on the data pipelines.
There are patterns for things such as domain-driven design, enterprise architectures, continuous delivery, microservices, and many others.
But where are the data science and data engineering patterns?
Sometimes, data engineering reminds me of cowboy coding - many workarounds, immature technologies and lack of market best practices.
Testing the Data Warehouse—Big Data, Big ProblemsTechWell
Data warehouses are critical systems for collecting, organizing, and making information readily available for strategic decision making. The ability to review historical trends and monitor near real-time operational data is a key competitive advantage for many organizations. Yet the methods for assuring the quality of these valuable assets are quite different from those of transactional systems. Ensuring that appropriate testing is performed is a major challenge for many enterprises. Geoff Horne has led numerous data warehouse testing projects in both the telecommunications and ERP sectors. Join Geoff as he shares his approaches and experiences, focusing on the key “uniques” of data warehouse testing: methods for assuring data completeness, monitoring data transformations, measuring quality, and more. Geoff explores the opportunities for test automation as part of the data warehouse process, describing how you can harness automation tools to streamline the work and minimize overhead.
Databricks Whitelabel: Making Petabyte Scale Data Consumable to All Our Custo...Databricks
Wejo has largest connected vehicle data set in the world, processing 17bn data points a day. Our data is of value to customers in multiple industries and to customers of multiple sizes. By utilising the Databricks whitelable offering allowing controlled, secure access to our data, we have opened up the unique value of Wejo data to a whole new user base.
This document proposes a real-time big data analytical architecture for remote sensing applications to address scalability issues in handling huge amounts of data. The architecture includes a remote sensing data acquisition unit to collect raw data, a data processing unit to filter and load balance the useful data, and a data analytics decision unit to compile results and generate decisions. It also describes algorithms for filtration and load balancing, processing and calculation, aggregation and compilation, and decision making.
The document discusses TravelBird's efforts to build a personalized offering for its customers by using data on customer interactions like pageviews, email opens, favorites and searches over 2.5 years to create personalized recommendations. It describes how TravelBird uses collaborative filtering similar to Netflix to rank offers for each customer based on what similar customers interacted with. The recommendations generally include long-haul trip offers to places like Cuba, Nepal and Iceland. TravelBird further diversifies the recommendations by considering factors like weather, seasonality, price and package similarity to deliver an optimized schedule of content to each customer, resulting in a 12% increase in email opens and 45% increase in clicks.
Big Data Expo 2015 - Infotopics Zien, Begrijpen, Doen!BigDataExpo
Het visueel maken van data is de enige manier om Big Data te begrijpen. Infotopics is dé specialist in datavisualisatie en continu op zoek naar de beste instrumenten om middels self service BI inzicht in data te geven. Zie hoe wij dit in de praktijk toepassen met Tableau & Alteryx.
Big Data and Data Science: The Technologies Shaping Our LivesRukshan Batuwita
Big Data and Data Science have become increasingly imperative areas in both industry and academia to the extent that every company wants to hire a Data Scientist and every university wants to start dedicated degree programs and centres of excellence in Data Science. Big Data and Data Science have led to technologies that have already shaped different aspects of our lives such as learning, working, travelling, purchasing, social relationships, entertainments, physical activities, medical treatments, etc. This talk will attempt to cover the landscape of some of the important topics in these exponentially growing areas of Data Science and Big Data including the state-of-the-art processes, commercial and open-source platforms, data processing and analytics algorithms (specially large scale Machine Learning), application areas in academia and industry, the best industry practices, business challenges and what it takes to become a Data Scientist.
Cisco & MapR bring 3 Superpowers to SAP HANA DeploymentsMapR Technologies
SAP HANA is an increasingly popular platform for various analytical and transactional use cases with its in-memory architecture. If you’re an SAP customer you’ve experienced the benefits.
However, the underlying storage for SAP HANA is painfully expensive. This slows down your ability to grow your SAP HANA footprint and serve up more applications.
Insight Fuelled Shopper Marketing - Engage Shopper MarketingMerlien Institute
This document provides information about the Insight Valley Asia 2013 conference on May 16-17 in Bangkok, Thailand. It discusses topics that will be covered at the conference including understanding shopper behavior, integrating marketing approaches, defining consumption opportunities, and promoting brands effectively in stores. The conference aims to help consumer goods companies identify growth opportunities and savings through the application of shopper marketing insights.
Real-Time Analytics and Visualization of Streaming Big Data with JReport & Sc...Mia Yuan Cao
Learn how to extract real-time insight from Big Data. JReport and ScaleDB’s combined solution delivers business value by ingesting Big Data at stunning velocity (millions of rows/second), then provides powerful visualizations, filtering and data analysis that enable you to draw quick conclusions to make agile business decisions. JReport's seamless connection to ScaleDB enables technical or non-technical users to build and modify their own reports and dashboards to visualize these vast data stores. Join us to see how.
Powering Fast Data and the Hadoop Ecosystem with VoltDB and HortonworksHortonworks
Developers increasingly are building dynamic, interactive real-time applications on fast streaming data to extract maximum value from data in the moment. To do so requires a data pipeline, the ability to make transactional decisions against state, and an export functionality that pushes data at high speeds to long-term Hadoop analytics stores like Hortonworks Data Platform (HDP). This enables data to arrive in your analytic store sooner, and allows these analytics to be leveraged with radically lower latency.
But successfully writing fast data applications that manage, process, and export streams of data generated from mobile, smart devices, sensors and social interactions is a big challenge.
Join Hortonworks and VoltDB, an in-memory scale-out relational database that simplifies fast data application development, to learn how you can ingest large volumes of fast-moving, streaming data and process it in real time. We will also cover how developing fast data applications is simplified, faster - and delivers more value when built on a fast in-memory, scale-out SQL database.
FiloDB - Breakthrough OLAP Performance with Cassandra and SparkEvan Chan
You want to ingest event, time-series, streaming data easily, yet have flexible, fast ad-hoc queries. Is this even possible? Yes! Find out how in this talk of combining Apache Cassandra and Apache Spark, using a new open-source database, FiloDB.
Northwestern Computational Research Day keynote april 19, 2016 (1)Iqbal Arshad
Deep neural networks, distributed intelligence, ubiquitous connectivity and infinite cloud computing will enable new intelligent experiences. Key trends include the growth of mobile devices, artificial intelligence, and internet connectivity. These technologies will be applied across smart phones, cars, IoT devices, and smart environments. Product engineers must consider how to integrate device, cloud, data sources and machine learning techniques to transform industries like transportation, cities, and enterprises.
AWS re:Invent 2016: How Mapbox Uses the AWS Edge to Deliver Fast Maps for Mob...Amazon Web Services
Ian Ward, Platform and Security Engineer from Mapbox, discusses how the AWS global edge network helps improve the availability and performance of delivering hundreds of billions of map tiles to hundreds of millions of end users across the globe on mobile devices, in cars, and over the web. In this session, Ian shares insights on how Mapbox manages day-to-day edge operations using Amazon CloudFront logs, dashboards, and ad hoc queries, and how Mapbox has configured CloudFront with dozens of behaviors and origins to customize their content delivery. Mapbox has grown from using a single AWS region to using several regions, so Ian also explains how his team uses Amazon Route 53 and open source tools to simplify complexity around regional failover, and how Mapbox leverages AWS WAF to deter attacks and abuse.
From the Hadoop Summit 2015 Session with Tomer Shiran.
To deliver real-time impact from big data, organizations must evolve beyond traditional analytic approaches to support a new class of agile, distributed applications. Real-time Hadoop overcomes batch programs reliant on data transformations and schema management. This session highlights how leading organizations are leveraging Hadoop and NoSQL to merge analytics and production data to make adjustments while business is happening to optimize revenue, mitigate risk and reduce operational costs. Details include how companies have achieved real-time impact on their business, collapsed data silos, and automated in-line analytics with operational data for immediate impact.
Evolving Your Big Data Use Cases from Batch to Real-Time - AWS May 2016 Webi...Amazon Web Services
Batch querying and reporting is no longer enough for many organizations. Reducing time to insight – the time it takes to turn data into actionable insights – is becoming increasingly important to remain competitive. That’s why organizations are quickly evolving their data applications to support a broader set of real-time analytic use cases.
In this webinar, we will review some of the common use cases for real-time analytics such as click-stream analysis, event data processing, and real-time analytics. We will show proven architectures for collecting, storing, and processing real-time data using a combination of AWS managed services, including Amazon Kinesis Streams, Amazon Kinesis Firehose, Amazon EMR, and AWS Lambda, as well open source tools, such as Apache Spark. Then, we will discuss common approaches and best practices to incorporate real-time analytics into your existing batch applications.
Learning Objectives:
• Understand how to incorporate real-time analytics into existing applications
• Best practices to combine batch with real-time data flows
• Learn common architectures and use cases for real-time analytics
Business intelligence (BI) helps businesses in various ways. For fast moving consumer goods companies, BI helps increase customer relationships, respond quickly to market changes, and launch new products faster. For retailers, BI helps align operations around revenue and profitability, identify and analyze trends, and increase cost savings through benchmarking. A US food distribution major uses BI for strategic goals like demand management, sales force effectiveness, trade promotion effectiveness, and supplier performance analysis.
The document discusses the use of business intelligence (BI) in the fast-moving consumer goods (FMCG) and retail industries. It outlines key performance indicators and frameworks for BI systems in retail. It also describes data modeling approaches for retail scenarios and discusses how BI can help address challenges and questions in areas like inventory, pricing, promotions and customer analytics. Major trends include increased competition and expectations, and the need for greater organizational alignment through BI.
Take Action: The New Reality of Data-Driven BusinessInside Analysis
The Briefing Room with Dr. Robin Bloor and WebAction
Live Webcast on July 23, 2014
Watch the archive:
https://bloorgroup.webex.com/bloorgroup/lsr.php?RCID=360d371d3a49ad256942f55350aa0a8b
The waiting used to be the hardest part, but not anymore. Today’s cutting-edge enterprises can seize opportunities faster than ever, thanks to an array of technologies that enable real-time responsiveness across the spectrum of business processes. Early adopters are solving critical business challenges by enabling the rapid-fire design, development and production of very specific applications. Functionality can range from improved customer engagement to dynamic machine-to-machine interactions.
Register for this episode of The Briefing Room to learn from veteran Analyst Dr. Robin Bloor, who will tout a new era in data-driven organizations, and why a data flow architecture will soon be critical for industry leaders. He’ll be briefed by Sami Akbay of WebAction, who will showcase his company’s real-time data management platform, which combines all the component parts needed to access, process and leverage data big and small. He’ll explain how this new approach can provide game-changing power to organizations of all types and sizes.
Visit InsideAnlaysis.com for more information.
Using AWS to design and build your data architecture has never been easier to gain insights and uncover new opportunities to scale and grow your business. Join this workshop to learn how you can gain insights at scale with the right big data applications.
Accelerate Self-Service Analytics with Data Virtualization and VisualizationDenodo
Watch full webinar here: https://bit.ly/3fpitC3
Enterprise organizations are shifting to self-service analytics as business users need real-time access to holistic and consistent views of data regardless of its location, source or type for arriving at critical decisions.
Data Virtualization and Data Visualization work together through a universal semantic layer. Learn how they enable self-service data discovery and improve performance of your reports and dashboards.
In this session, you will learn:
- Challenges faced by business users
- How data virtualization enables self-service analytics
- Use case and lessons from customer success
- Overview of the highlight features in Tableau
Big Data Paris - A Modern Enterprise ArchitectureMongoDB
Depuis les années 1980, le volume de données produit et le risque lié à ces données ont littéralement explosé. 90% des données existantes aujourd’hui ont été créé ces 2 dernières années, dont 80% sont non structurées. Avec plus d’utilisateurs et le besoin de disponibilité permanent, les risques sont beaucoup plus élevés.
Quels sont les paramètres de bases de données qu’un décideur doit prendre en compte pour déployer ses applications innovantes?
Emerging Prevalence of Data Streaming in Analytics and it's Business Signific...Amazon Web Services
Learning Objectives:
- Get an overview of streaming data and it's application in analytics and big data.
- Understand the factors driving the accelerating transformation of batch processing to real-time.
- Learn how you should plan for incorporating data streaming in your analytics and processing workloads.
Business can now easily perform real-time analytics on data that has been traditionally analyzed using batch processing in data warehouses or using Hadoop frameworks, and react to new information in minutes or seconds instead of hours or days. In this webinar, Forrester analyst Mike Gualtieri and Amazon Kinesis GM Roger Barga will discuss this prevalent trend, it's business significance, and how you should plan for it. You will also learn about the AWS services that can help you get started quickly with real-time, streaming applications fore your analytics and big data workloads.
HiFX designed and implemented a unified data analytics platform called Vision Lens for Malayala Manorama to generate meaningful insights from large amounts of data across their multiple digital properties. The solution involved building a data lake, data pipeline, processing framework, and dashboards to provide real-time and historical analytics. This helped Manorama improve user experiences, drive smarter marketing, and make better business decisions.
Amazon Kinesis is a platform for streaming data on AWS, offering powerful services to make it easy to load and analyze streaming data. In this session, you'll learn about how AWS customers are transitioning from batch to real-time processing using Amazon Kinesis, and how to get started. We will provide an overview of streaming data applications and introduce the Amazon Kinesis platform and its services. We will walk through a production use case to demonstrate how to ingest streaming data, prepare it, and analyze it to gain actionable insights in real time using Amazon Kinesis. We will also provide pointers to tutorials and other resources so you can quickly get started with your streaming data application.
This document summarizes a webinar on data as a service. It discusses how data virtualization through Denodo can enable agile business intelligence by providing pre-aggregated data to users quickly. It describes how Denodo creates API access to data, allows for an enterprise data marketplace, and integrates machine learning models to power operational AI. A demonstration of a personal COVID-19 risk monitor is provided.
1) In-memory computing is growing rapidly, with the total data market expected to grow from $69 billion in 2015 to $132 billion in 2020.
2) In-memory databases are gaining popularity for applications that require fast response times, like telecommunications and mobile advertising, as memory access is faster than disk access.
3) Modern applications are driving adoption of in-memory solutions as they generate more data from more users and transactions and require faster performance to handle growing traffic.
4) Two examples presented were DellEMC using MemSQL for a real-time customer 360 application and an IoT logistics application called MemEx that processes sensor data from warehouses for predictive analytics.
Using AWS to design and build your data architecture has never been easier to gain insights and uncover new opportunities to scale and grow your business. Join this workshop to learn how you can gain insights at scale with the right big data applications.
Gain New Insights by Analyzing Machine Logs using Machine Data Analytics and BigInsights.
Half of Fortune 500 companies experience more than 80 hours of system down time annually. Spread evenly over a year, that amounts to approximately 13 minutes every day. As a consumer, the thought of online bank operations being inaccessible so frequently is disturbing. As a business owner, when systems go down, all processes come to a stop. Work in progress is destroyed and failure to meet SLA’s and contractual obligations can result in expensive fees, adverse publicity, and loss of current and potential future customers. Ultimately the inability to provide a reliable and stable system results in loss of $$$’s. While the failure of these systems is inevitable, the ability to timely predict failures and intercept them before they occur is now a requirement.
A possible solution to the problem can be found is in the huge volumes of diagnostic big data generated at hardware, firmware, middleware, application, storage and management layers indicating failures or errors. Machine analysis and understanding of this data is becoming an important part of debugging, performance analysis, root cause analysis and business analysis. In addition to preventing outages, machine data analysis can also provide insights for fraud detection, customer retention and other important use cases.
A Winning Strategy for the Digital EconomyEric Kavanagh
The speed of innovation today creates tremendous opportunities for some, existential threats for others. Companies that win create their own success by leveraging modern data platforms. While architectures vary, the foundation is often in-memory, and the latency is real-time. Register for this Special Edition of The Briefing Room to hear veteran Analyst Dr. Robin Bloor explain how today's data platforms enable the modern enterprise in groundbreaking ways. He'll be briefed by Chris Hallenbeck of SAP who will demonstrate how forward-looking companies are leveraging real-time data platforms to achieve operational excellence, make decisions faster, and find new ways to innovate.
Is Your Data Paying You Dividends? Data innovation is a means to an end where data as an asset can be managed, developed, monetized, and eventually expected to pay dividends to the business.While 70% of CEOs surveyed expect investments in data, analytics, ML and AI initiatives to improve their bottom-line, 56% stated concerns over the integrity of their data1. Data science teams are now tasked to deliver true business value but fundamental issues remain in data preparation, data cleansing which impedes speed to market.Join Karan Sachdeva as he demonstrates capabilities of the all-new IBM Cloud Private for Data –a single containerized platform - that bridges the gap between data consumability, governance, integration, and visualization, accelerating speed to market and dividends to your business.by Karan Sachdeva, Sales Leader Big Data Analytics, IBM Asia Pacific
Accelerate Self-Service Analytics with Data Virtualization and VisualizationDenodo
Watch full webinar here: https://bit.ly/39AhUB7
Enterprise organizations are shifting to self-service analytics as business users need real-time access to holistic and consistent views of data regardless of its location, source or type for arriving at critical decisions.
Data Virtualization and Data Visualization work together through a universal semantic layer. Learn how they enable self-service data discovery and improve performance of your reports and dashboards.
In this session, you will learn:
- Challenges faced by business users
- How data virtualization enables self-service analytics
- Use case and lessons from customer success
- Overview of the highlight features in Tableau
Using real time big data analytics for competitive advantageAmazon Web Services
Many organisations find it challenging to successfully perform real-time data analytics using their own on premise IT infrastructure. Building a system that can adapt and scale rapidly to handle dramatic increases in transaction loads can potentially be quite a costly and time consuming exercise.
Most of the time, infrastructure is under-utilised and it’s near impossible for organisations to forecast the amount of computing power they will need in the future to serve their customers and suppliers.
To overcome these challenges, organisations can instead utilise the cloud to support their real-time data analytics activities. Scalable, agile and secure, cloud-based infrastructure enables organisations to quickly spin up infrastructure to support their data analytics projects exactly when it is needed. Importantly, they can ‘switch off’ infrastructure when it is not.
BluePi Consulting and Amazon Web Services (AWS) are giving you the opportunity to discover how organisations are using real time data analytics to gain new insights from their information to improve the customer experience and drive competitive advantage.
Big Data, IoT, data lake, unstructured data, Hadoop, cloud, and massively parallel processing (MPP) are all just fancy words unless you can find uses cases for all this technology. Join me as I talk about the many use cases I have seen, from streaming data to advanced analytics, broken down by industry. I’ll show you how all this technology fits together by discussing various architectures and the most common approaches to solving data problems and hopefully set off light bulbs in your head on how big data can help your organization make better business decisions.
Transforming Financial Services with Event Streaming Dataconfluent
The document discusses how event streaming can transform financial services by providing real-time and scalable data. It describes how banks have become software-driven and the challenges of legacy infrastructure. The document then provides an overview of how Confluent event streaming works and its benefits. Finally, it discusses some key use cases for financial services including improving customer experiences, unlocking value from mainframes and core systems, payments, open banking, security and fraud, and regulatory compliance.
The Double win business transformation and in-year ROI and TCO reductionMongoDB
This document discusses how modern information management with flexible data platforms like MongoDB can help businesses transform and drive ROI through cost reduction and increased productivity compared to legacy systems. It provides examples of strategic areas where MongoDB can modernize an organization's full technology stack from data in motion/at rest to apps, compute, storage and networks. Success stories show how MongoDB has helped companies like Barclays reduce costs and complexity while improving resiliency, agility and innovation.
Sponsored by Data Transformed, the KNIME Meetup was a big success. Please find the slides for Dan's, Tom's, Anand's and Chhitesh's presentations.
Agenda:
Registration & Networking
Keynote – Dan Cox, CEO of Data Transformed
KNIME & Harvest Analytics – Tom Park
Office of State Revenue Case Study – Anand Antony
Using Spark with KNIME – Chhitesh Shrestha
Networking & Drinks
Similar to Architecting for Real-Time Big Data Analytics (20)
Observability Concepts EVERY Developer Should Know -- DeveloperWeek Europe.pdfPaige Cruz
Monitoring and observability aren’t traditionally found in software curriculums and many of us cobble this knowledge together from whatever vendor or ecosystem we were first introduced to and whatever is a part of your current company’s observability stack.
While the dev and ops silo continues to crumble….many organizations still relegate monitoring & observability as the purview of ops, infra and SRE teams. This is a mistake - achieving a highly observable system requires collaboration up and down the stack.
I, a former op, would like to extend an invitation to all application developers to join the observability party will share these foundational concepts to build on:
UiPath Test Automation using UiPath Test Suite series, part 5DianaGray10
Welcome to UiPath Test Automation using UiPath Test Suite series part 5. In this session, we will cover CI/CD with devops.
Topics covered:
CI/CD with in UiPath
End-to-end overview of CI/CD pipeline with Azure devops
Speaker:
Lyndsey Byblow, Test Suite Sales Engineer @ UiPath, Inc.
Essentials of Automations: The Art of Triggers and Actions in FMESafe Software
In this second installment of our Essentials of Automations webinar series, we’ll explore the landscape of triggers and actions, guiding you through the nuances of authoring and adapting workspaces for seamless automations. Gain an understanding of the full spectrum of triggers and actions available in FME, empowering you to enhance your workspaces for efficient automation.
We’ll kick things off by showcasing the most commonly used event-based triggers, introducing you to various automation workflows like manual triggers, schedules, directory watchers, and more. Plus, see how these elements play out in real scenarios.
Whether you’re tweaking your current setup or building from the ground up, this session will arm you with the tools and insights needed to transform your FME usage into a powerhouse of productivity. Join us to discover effective strategies that simplify complex processes, enhancing your productivity and transforming your data management practices with FME. Let’s turn complexity into clarity and make your workspaces work wonders!
Unlock the Future of Search with MongoDB Atlas_ Vector Search Unleashed.pdfMalak Abu Hammad
Discover how MongoDB Atlas and vector search technology can revolutionize your application's search capabilities. This comprehensive presentation covers:
* What is Vector Search?
* Importance and benefits of vector search
* Practical use cases across various industries
* Step-by-step implementation guide
* Live demos with code snippets
* Enhancing LLM capabilities with vector search
* Best practices and optimization strategies
Perfect for developers, AI enthusiasts, and tech leaders. Learn how to leverage MongoDB Atlas to deliver highly relevant, context-aware search results, transforming your data retrieval process. Stay ahead in tech innovation and maximize the potential of your applications.
#MongoDB #VectorSearch #AI #SemanticSearch #TechInnovation #DataScience #LLM #MachineLearning #SearchTechnology
Pushing the limits of ePRTC: 100ns holdover for 100 daysAdtran
At WSTS 2024, Alon Stern explored the topic of parametric holdover and explained how recent research findings can be implemented in real-world PNT networks to achieve 100 nanoseconds of accuracy for up to 100 days.
Unlocking Productivity: Leveraging the Potential of Copilot in Microsoft 365, a presentation by Christoforos Vlachos, Senior Solutions Manager – Modern Workplace, Uni Systems
UiPath Test Automation using UiPath Test Suite series, part 6DianaGray10
Welcome to UiPath Test Automation using UiPath Test Suite series part 6. In this session, we will cover Test Automation with generative AI and Open AI.
UiPath Test Automation with generative AI and Open AI webinar offers an in-depth exploration of leveraging cutting-edge technologies for test automation within the UiPath platform. Attendees will delve into the integration of generative AI, a test automation solution, with Open AI advanced natural language processing capabilities.
Throughout the session, participants will discover how this synergy empowers testers to automate repetitive tasks, enhance testing accuracy, and expedite the software testing life cycle. Topics covered include the seamless integration process, practical use cases, and the benefits of harnessing AI-driven automation for UiPath testing initiatives. By attending this webinar, testers, and automation professionals can gain valuable insights into harnessing the power of AI to optimize their test automation workflows within the UiPath ecosystem, ultimately driving efficiency and quality in software development processes.
What will you get from this session?
1. Insights into integrating generative AI.
2. Understanding how this integration enhances test automation within the UiPath platform
3. Practical demonstrations
4. Exploration of real-world use cases illustrating the benefits of AI-driven test automation for UiPath
Topics covered:
What is generative AI
Test Automation with generative AI and Open AI.
UiPath integration with generative AI
Speaker:
Deepak Rai, Automation Practice Lead, Boundaryless Group and UiPath MVP
Goodbye Windows 11: Make Way for Nitrux Linux 3.5.0!SOFTTECHHUB
As the digital landscape continually evolves, operating systems play a critical role in shaping user experiences and productivity. The launch of Nitrux Linux 3.5.0 marks a significant milestone, offering a robust alternative to traditional systems such as Windows 11. This article delves into the essence of Nitrux Linux 3.5.0, exploring its unique features, advantages, and how it stands as a compelling choice for both casual users and tech enthusiasts.
How to Get CNIC Information System with Paksim Ga.pptxdanishmna97
Pakdata Cf is a groundbreaking system designed to streamline and facilitate access to CNIC information. This innovative platform leverages advanced technology to provide users with efficient and secure access to their CNIC details.
GraphSummit Singapore | The Art of the Possible with Graph - Q2 2024Neo4j
Neha Bajwa, Vice President of Product Marketing, Neo4j
Join us as we explore breakthrough innovations enabled by interconnected data and AI. Discover firsthand how organizations use relationships in data to uncover contextual insights and solve our most pressing challenges – from optimizing supply chains, detecting fraud, and improving customer experiences to accelerating drug discoveries.
Alt. GDG Cloud Southlake #33: Boule & Rebala: Effective AppSec in SDLC using ...James Anderson
Effective Application Security in Software Delivery lifecycle using Deployment Firewall and DBOM
The modern software delivery process (or the CI/CD process) includes many tools, distributed teams, open-source code, and cloud platforms. Constant focus on speed to release software to market, along with the traditional slow and manual security checks has caused gaps in continuous security as an important piece in the software supply chain. Today organizations feel more susceptible to external and internal cyber threats due to the vast attack surface in their applications supply chain and the lack of end-to-end governance and risk management.
The software team must secure its software delivery process to avoid vulnerability and security breaches. This needs to be achieved with existing tool chains and without extensive rework of the delivery processes. This talk will present strategies and techniques for providing visibility into the true risk of the existing vulnerabilities, preventing the introduction of security issues in the software, resolving vulnerabilities in production environments quickly, and capturing the deployment bill of materials (DBOM).
Speakers:
Bob Boule
Robert Boule is a technology enthusiast with PASSION for technology and making things work along with a knack for helping others understand how things work. He comes with around 20 years of solution engineering experience in application security, software continuous delivery, and SaaS platforms. He is known for his dynamic presentations in CI/CD and application security integrated in software delivery lifecycle.
Gopinath Rebala
Gopinath Rebala is the CTO of OpsMx, where he has overall responsibility for the machine learning and data processing architectures for Secure Software Delivery. Gopi also has a strong connection with our customers, leading design and architecture for strategic implementations. Gopi is a frequent speaker and well-known leader in continuous delivery and integrating security into software delivery.
Communications Mining Series - Zero to Hero - Session 1DianaGray10
This session provides introduction to UiPath Communication Mining, importance and platform overview. You will acquire a good understand of the phases in Communication Mining as we go over the platform with you. Topics covered:
• Communication Mining Overview
• Why is it important?
• How can it help today’s business and the benefits
• Phases in Communication Mining
• Demo on Platform overview
• Q/A
zkStudyClub - Reef: Fast Succinct Non-Interactive Zero-Knowledge Regex ProofsAlex Pruden
This paper presents Reef, a system for generating publicly verifiable succinct non-interactive zero-knowledge proofs that a committed document matches or does not match a regular expression. We describe applications such as proving the strength of passwords, the provenance of email despite redactions, the validity of oblivious DNS queries, and the existence of mutations in DNA. Reef supports the Perl Compatible Regular Expression syntax, including wildcards, alternation, ranges, capture groups, Kleene star, negations, and lookarounds. Reef introduces a new type of automata, Skipping Alternating Finite Automata (SAFA), that skips irrelevant parts of a document when producing proofs without undermining soundness, and instantiates SAFA with a lookup argument. Our experimental evaluation confirms that Reef can generate proofs for documents with 32M characters; the proofs are small and cheap to verify (under a second).
Paper: https://eprint.iacr.org/2023/1886
“An Outlook of the Ongoing and Future Relationship between Blockchain Technologies and Process-aware Information Systems.” Invited talk at the joint workshop on Blockchain for Information Systems (BC4IS) and Blockchain for Trusted Data Sharing (B4TDS), co-located with with the 36th International Conference on Advanced Information Systems Engineering (CAiSE), 3 June 2024, Limassol, Cyprus.
2. www.robertwinters.nl
2
ROBERT WINTERS
Head of Business Intelligence, TravelBird
With ten years’ experience leading analytics teams across retail, gaming, travel, and telecom, I’ve had the opportunity to roll out several successful
big data projects based on a variety of platforms. In my current role as Head of BI at TravelBird I am responsible for the infrastructure, development,
and products associated with personalization, business intelligence, A/B testing, and general business analytics.
Ten years’ experience in analytics, five years with Vertica and big data
About Me
3. www.robertwinters.nl
3
What is different about big data?Architecting for real-time big data analytics
Volume
The average Fortune 500
company has 235 terabytes of
data, doubling every two years.
However, only 0,5% of data is
used for analysis
Velocity
“Real-time” has gone from “by
start of business tomorrow” to
“within milliseconds”.
Variety
More than 70% of data is semi-
structured/unstructured and
growing more complex; user
generated content is one of the
richest sources of information.
Veracity
Increasing volume, velocity, and
veracity with decreasing control
leads to lower reliability of any
given data point. Data can arrive
several times, out of order, or not
at all.
4. www.robertwinters.nl
4
NEW INSIGHTS
Big data analysis has allowed us to
discover which days were in demand but
unavailable, how often individuals read a
given email, and how much patience
people have for video ads.
NEW OPPORTUNITIES
The power of additional insights has
unlocked additional revenue streams via
product creation, new partnerships
based on insights, and demand-driven
optimisation.
PREDICTIVE POWER
Having thousands of events per
customer allows us to know what to say,
when to say it, and how to say it on an
individual level.
BETTER CONTROL
Real time monitoring of events provides
faster identification of service failures
and risk identification, reducing the risk
of negative customer experiences.
What can big data bring?Architecting for real-time big data analytics
5. www.robertwinters.nl
5
Features benefitting from real-time analyticsArchitecting for real-time big data analytics
A number of features can be built based on real-time data processing feeds which significantly improve customer experience and business performance. All of
the above have either been tested or are under development.
Personal
Suggestions
Suggestions can be made
based on changing behaviour,
maximising relevancy
Behaviour
Prediction
Models can estimate
emotional propensity,
activating business rules
Product
Optimisation
Offer content and pricing can
be adjusted continuously
based on customer behaviour
Experience
Improvement
Customer interactions can
highlight demand or difficulty,
allowing rapid correction
Relevant
Messaging
Messaging can be send at the
exact moment of effectiveness
based on location or state
6. www.robertwinters.nl
6
1,7M 75% 33% 48%
Staff shortage
McKinsey estimates that
1,7M unstaffed big data
positions will exist by
2018.
Management
Complexity
75% of companies
report big data
platforms as somewhat
or extremely challenging
Untrustworthy
One in three business
executives reports their
big data sources as
untrustworthy
Value Creation
Almost half of all big
data projects create low
or no ROI for
organisations
But it brings new challengesArchitecting for real-time big data analytics
7. www.robertwinters.nl
7
Architecture to enable real-time big dataArchitecting for real-time big data analytics
Data Collection
How you gather data must be
extremely highly performant,
dynamically scalable, and able to
ingest both unstructured and
structured records.
Data Pipeline
The data pipeline should support
multiple speeds of processing
and allow for out of sync or
corrupted data.
Data Storage
In an ideal environment, storage
allows for the analysis of both
structured and semi-structured
data and can horizontally scale.
Analytical Tools
Self-service oriented tooling
dominates today’s BI
requirements and should
empower end users on all data
sources.
8. www.robertwinters.nl
8
Real-time stream: when you need it now
For decisions and reporting where timeliness is more important than
completeness, real time pipelines are used to achieve sub-second timing
between the event and the targeted feed. This is useful for recommendations,
in-session optimization, and monitoring.
“Slow” stream: when you need it right
At the same time, data is written to a more persistent store for later (eg. nightly)
processing and analysis. This is used to ensure completeness, cleanliness, apply
complex transformations, and ensure that data can be trusted.
Lambda ArchitectureArchitecting for real-time big data analytics
9. www.robertwinters.nl
9
Relational
Pipelines
Data
Bus
Event
Collectors
Email, mobile,
web events
JSON objects are created in
clients and handed to event
collectors. Success with both “roll
your own” and open source
(Snowplow).
Transactions and
dimensions
To capture changes in production
databases, both heterogenous
replication and a pull-based
approach can be used.
Landing point for
data streams
Both stream types write to a bus
(Kafka, Kinesis, etc) which makes
the data available for both real
time analysis and ELT.
Data CollectionArchitecting for real-time big data analytics
10. www.robertwinters.nl
10
Data ProcessingArchitecting for real-time big data analytics
Data is read directly off
the bus, receives
minimal transformation,
and pipes each event
into the real time
systems. No validation is
done for quality or
completeness.
STREAM
PROCESSING
Every few minutes,
batches are fetched
from the bus for more
robust processing,
loading to the DWH for
analysis, and rotated to
permanent storage.
BATCH
PROCESSING
Every hour, data from all
sources is processed into
the “system of truth”
data warehouse model
and subjected to all
business rules before
presentation to
reporting.
TRADITIONAL
ETL
11. www.robertwinters.nl
11
The data problem that you are optimising for dictates the best technology for that scope. With the prevalence of cloud hosting and
managed solutions, having a variety of components in your landscape is easier and more cost effective than ever.
For teams dealing with mostly relational data
in the tens/hundreds of terabytes range, a
MPP column store is often the best tool for
the primary data environment.
Real time aggregations in Redis or Spark often
provide the fastest way to get meaningful
insights from your data when seconds matter.
Some form of “data lake” should exist to keep
a snapshot of all time and allow broad
analysis. The lake could be either Hadoop or a
well organised file store like S3/GFS.
We can use these technologies in conjunction
to have a performant, federated data
platform.
Data PersistenceArchitecting for real-time big data analytics
12. www.robertwinters.nl
12
Speed of data loading
Data loading which took 70 minutes in Redshift completes
in nine minutes in Vertica, lowering time to analysis
Flex tables
All event data is loaded as semi-structured JSON,
allowing rapid iteration without any DB changes
Ease of administration and tuning
Adjusting table structure for performance optimisation
is trivially easy; multiple projections can be built to
cover different query types
High performance queries
Queries complete orders of magnitude faster than OLTP
systems or Hive, allowing faster iteration in analytics
Event series analytics
We use event analytics to do complex analytics like
dynamic sessionization using simple SQL
Significant SQL extensions
Extensions for text analytics, data manipulation, and
analytical aggregation allow us to do most work directly in
the database, speeding analysis
Why VerticaArchitecting for real-time big data analytics
13. www.robertwinters.nl
13
Tableau PythonSpark
Machine learning
Predictive analytical models are
built and evaluated within spark
running on AWS, then loaded into
Vertica for user scoring
Business analysis
Business users analyse data via
Tableau’s web interface,
generating >1000 view requests
per day.
Data analysis
General data analytics including
forecasting and regression is
conducted via python models on
top of Vertica queries
Analysis ToolingArchitecting for real-time big data analytics
14. 14
Service oriented
Using a number of simple
services provides technical
flexibility
Analytics focused
Every aspect of the stack
either supports analysis or
application of insight
Low cost
Use of cloud and dynamic
scaling allows excellent
cost management
Cloud based
AWS hosting allows
infinite scaling and easy
administration
All Together
$
15. www.robertwinters.nl
15
Personalised
Emails
Delivered +20% CTR and
+35% offer views vs marketing
selections
Clustering
Achieved a 60% reduction in
email pressure while
maintaining 90% of clicks
Individual
Suggestions
+11% increase in content
consumption
Calendar
Heatmap
Increased price based on
demand, increasing margin
while maintaining sales
Feature SuccessesSuccesses across a variety of market segments