Download to read offline

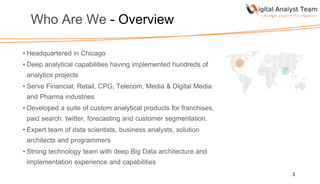
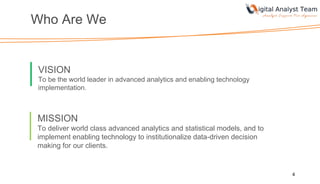

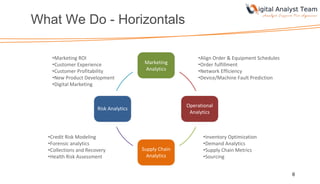
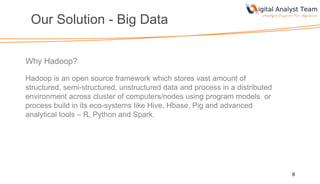
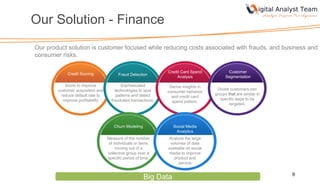
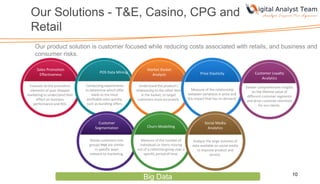


The company provides advanced analytics and data-driven decision making services. It has deep analytical capabilities across various industries, developed custom products, and has an expert team of data scientists, analysts, architects and programmers. The vision is to be a world leader in advanced analytics and enabling technology. Services include marketing, operations, supply chain and risk analytics. The company uses big data technologies like Hadoop and advanced tools to deliver solutions focused on customers across industries.


![[DSC Europe 25] Ekaterina Bubenko - Behind the Curtain: How Data Roles Collab...](https://cdn.slidesharecdn.com/ss_thumbnails/anmv6x8dstqbbzchoklr-ekaterina-bubenko-behind-the-curtain-how-data-roles-collaborate-in-the-ai-era-a-260123083019-4b252ec7-thumbnail.jpg?width=640&height=640&fit=bounds)


