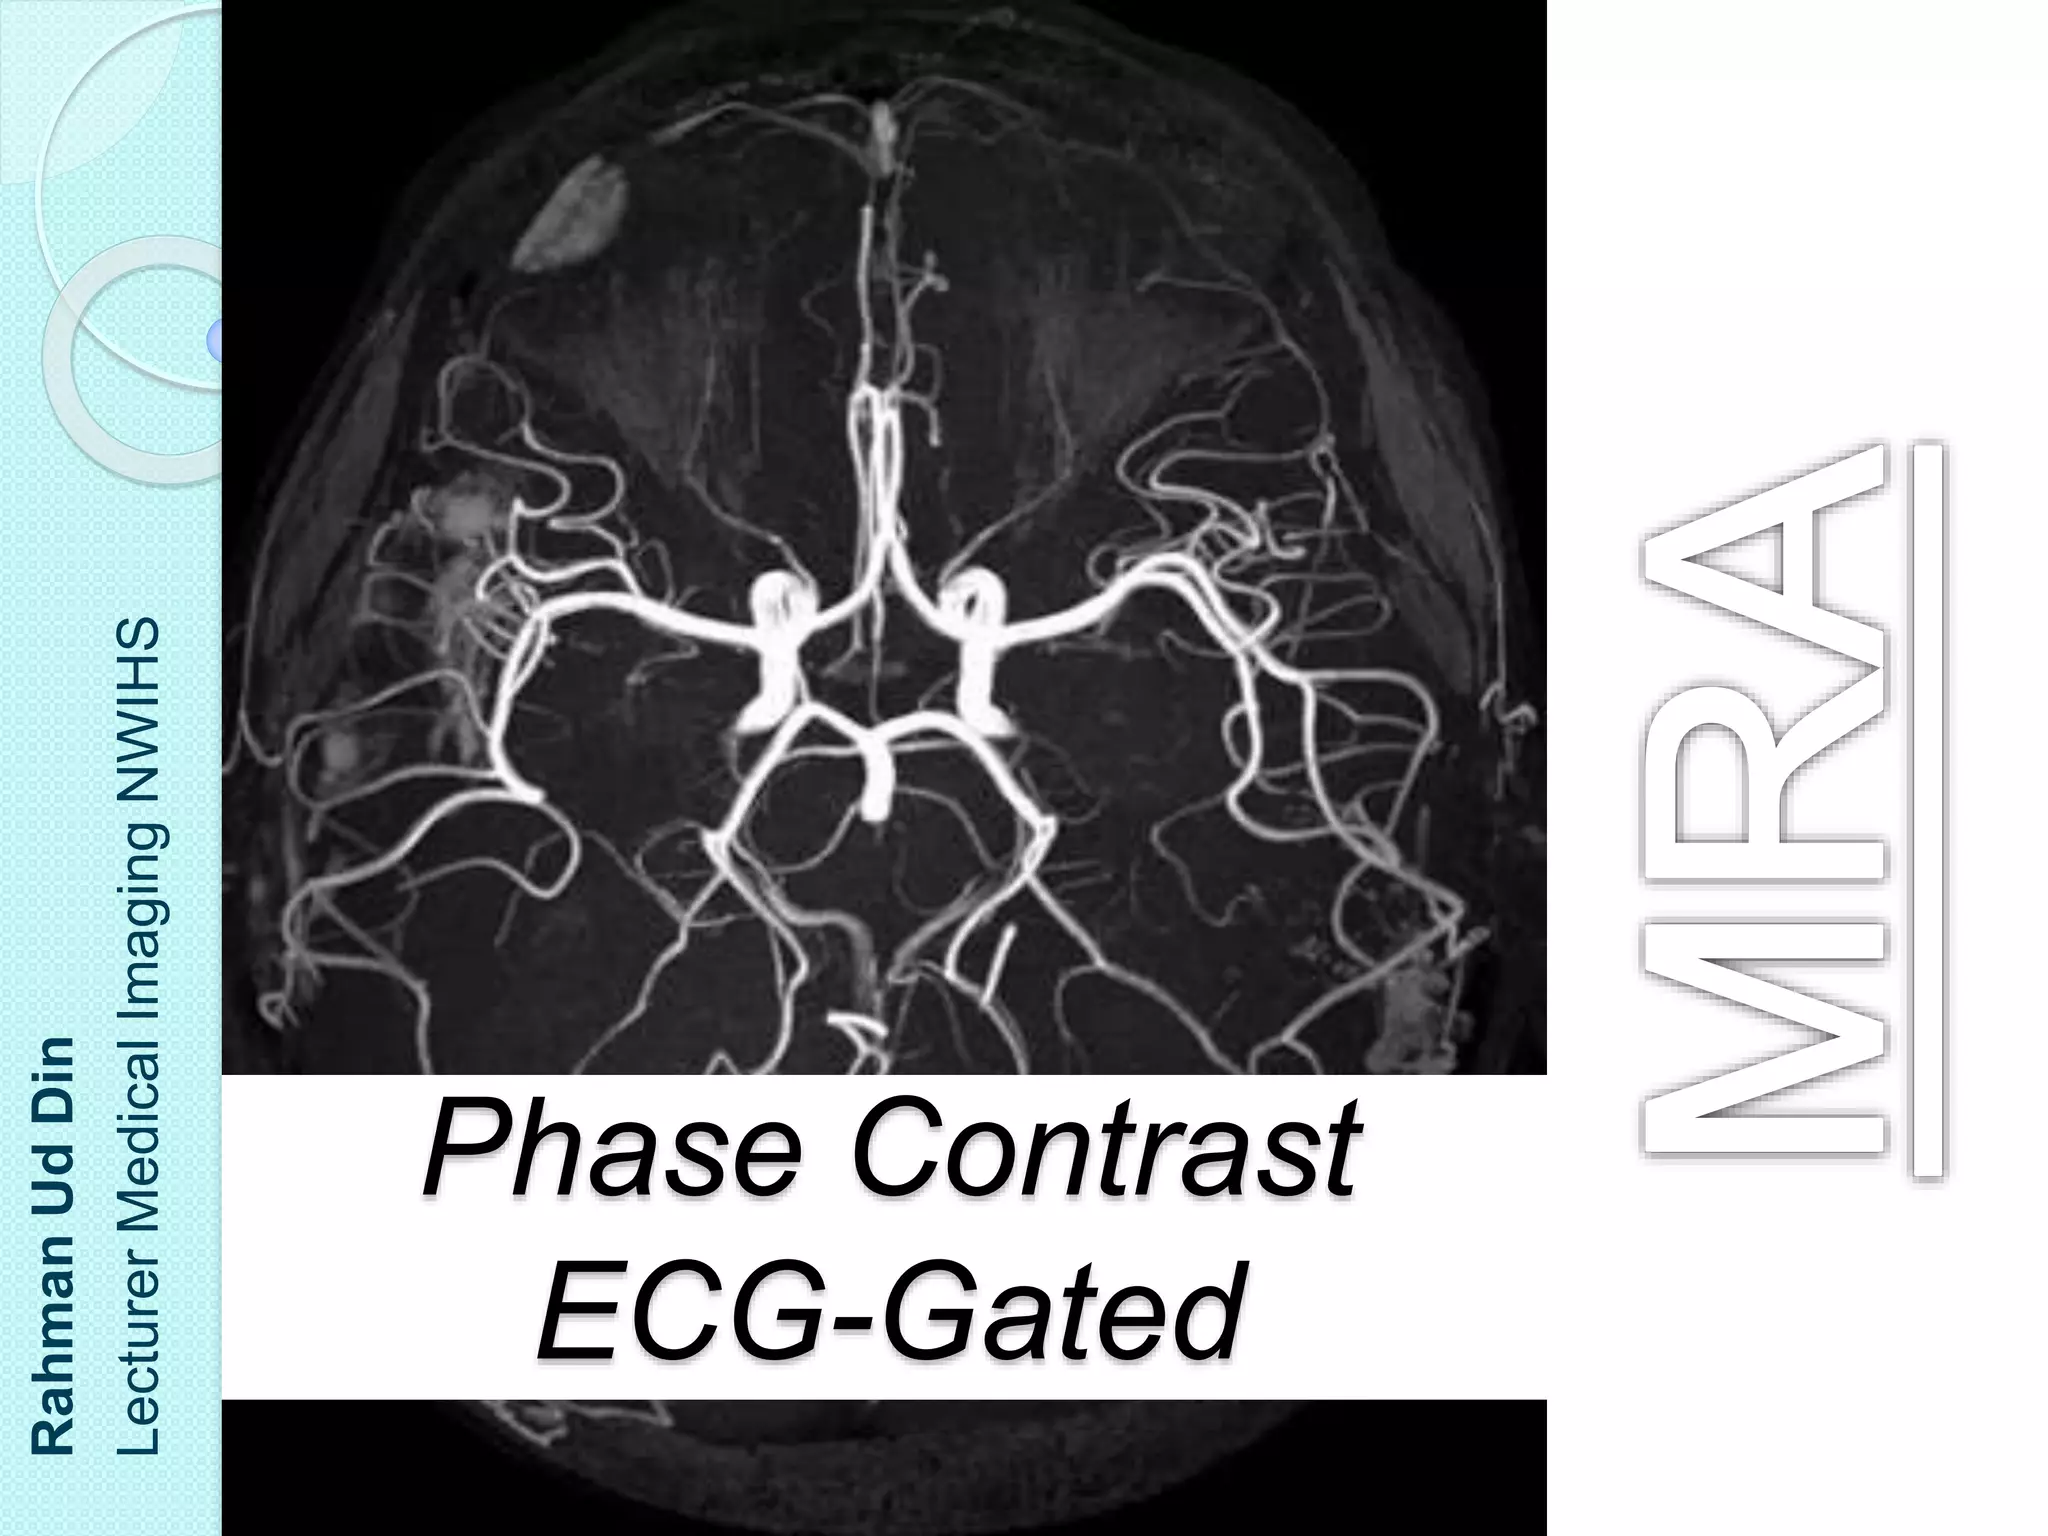
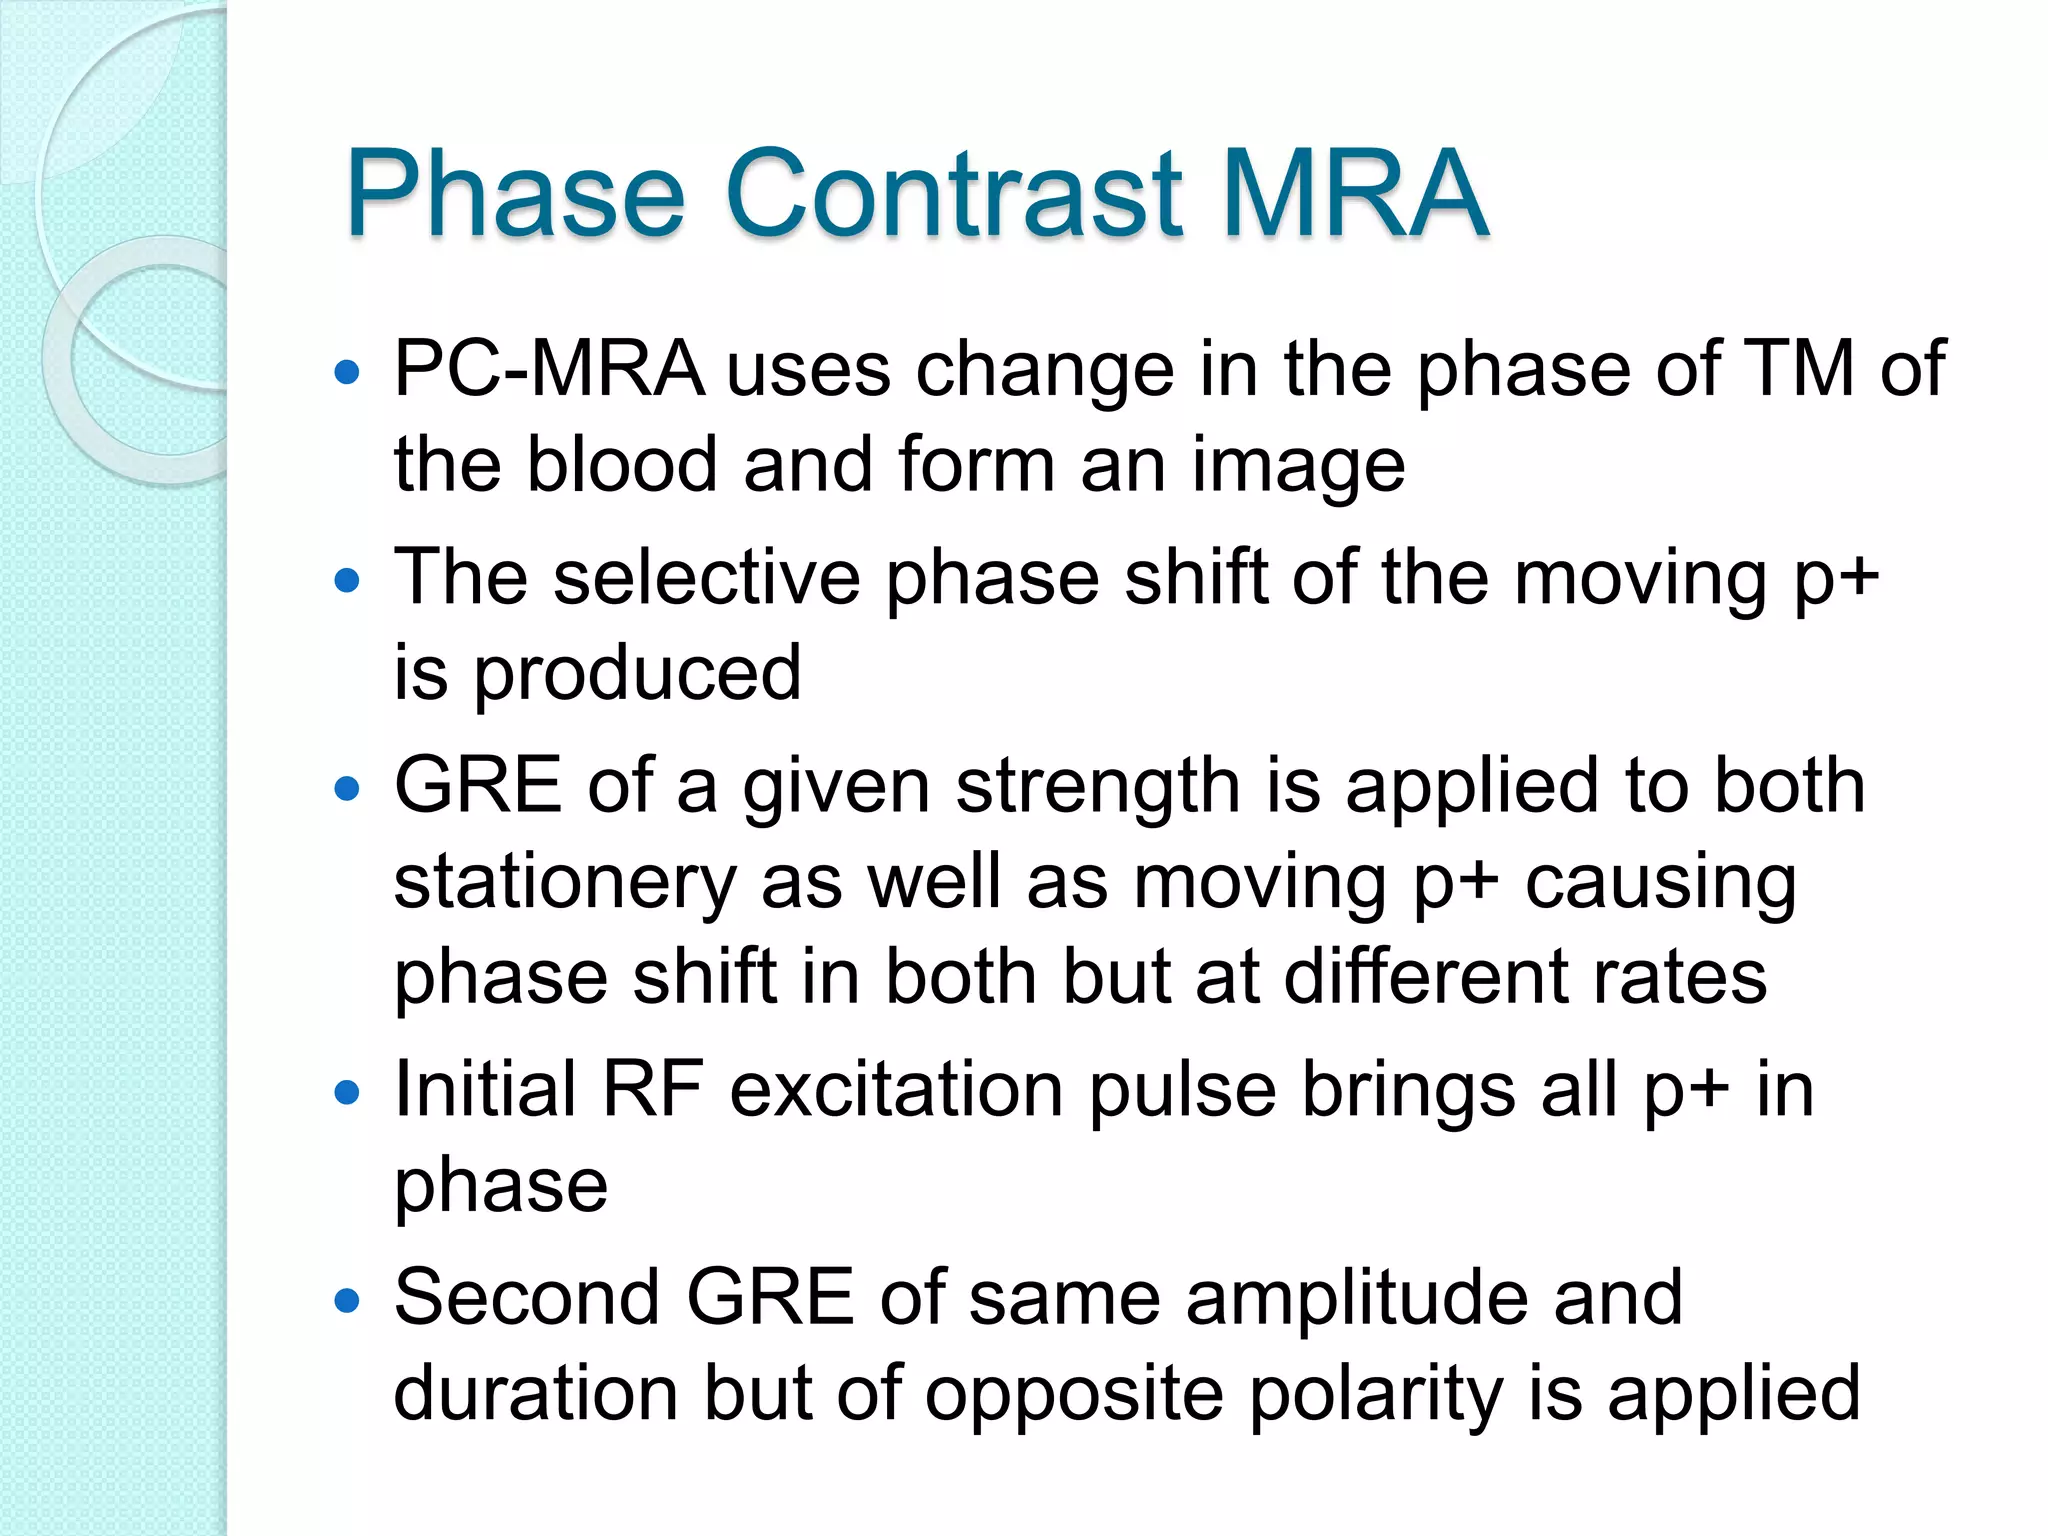
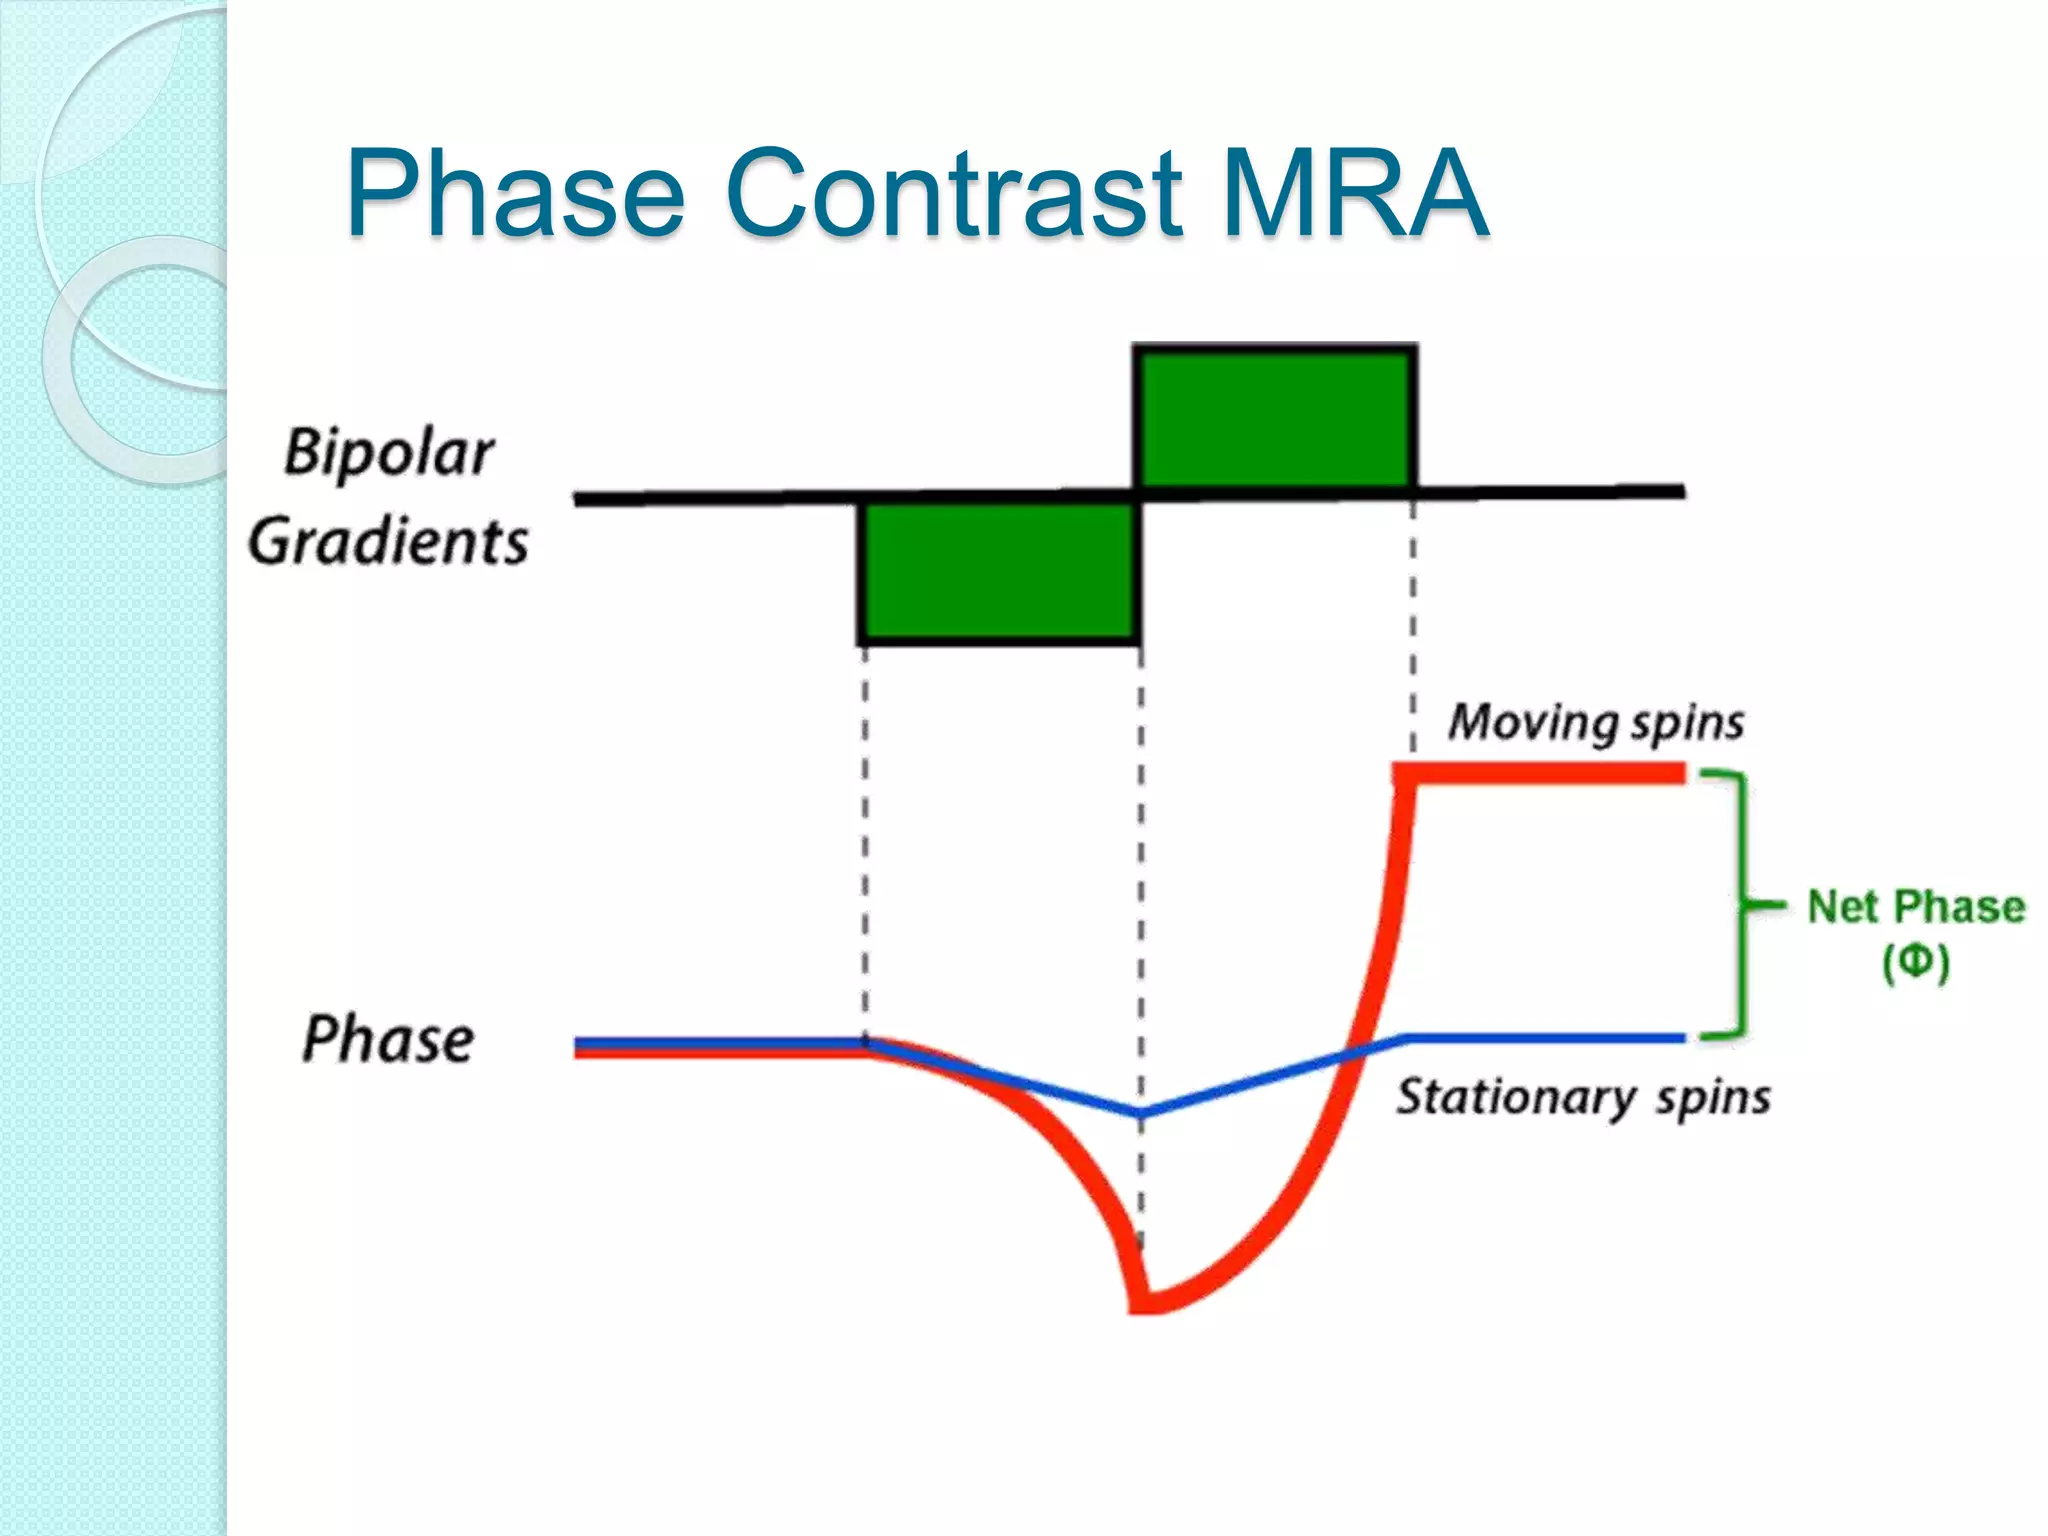
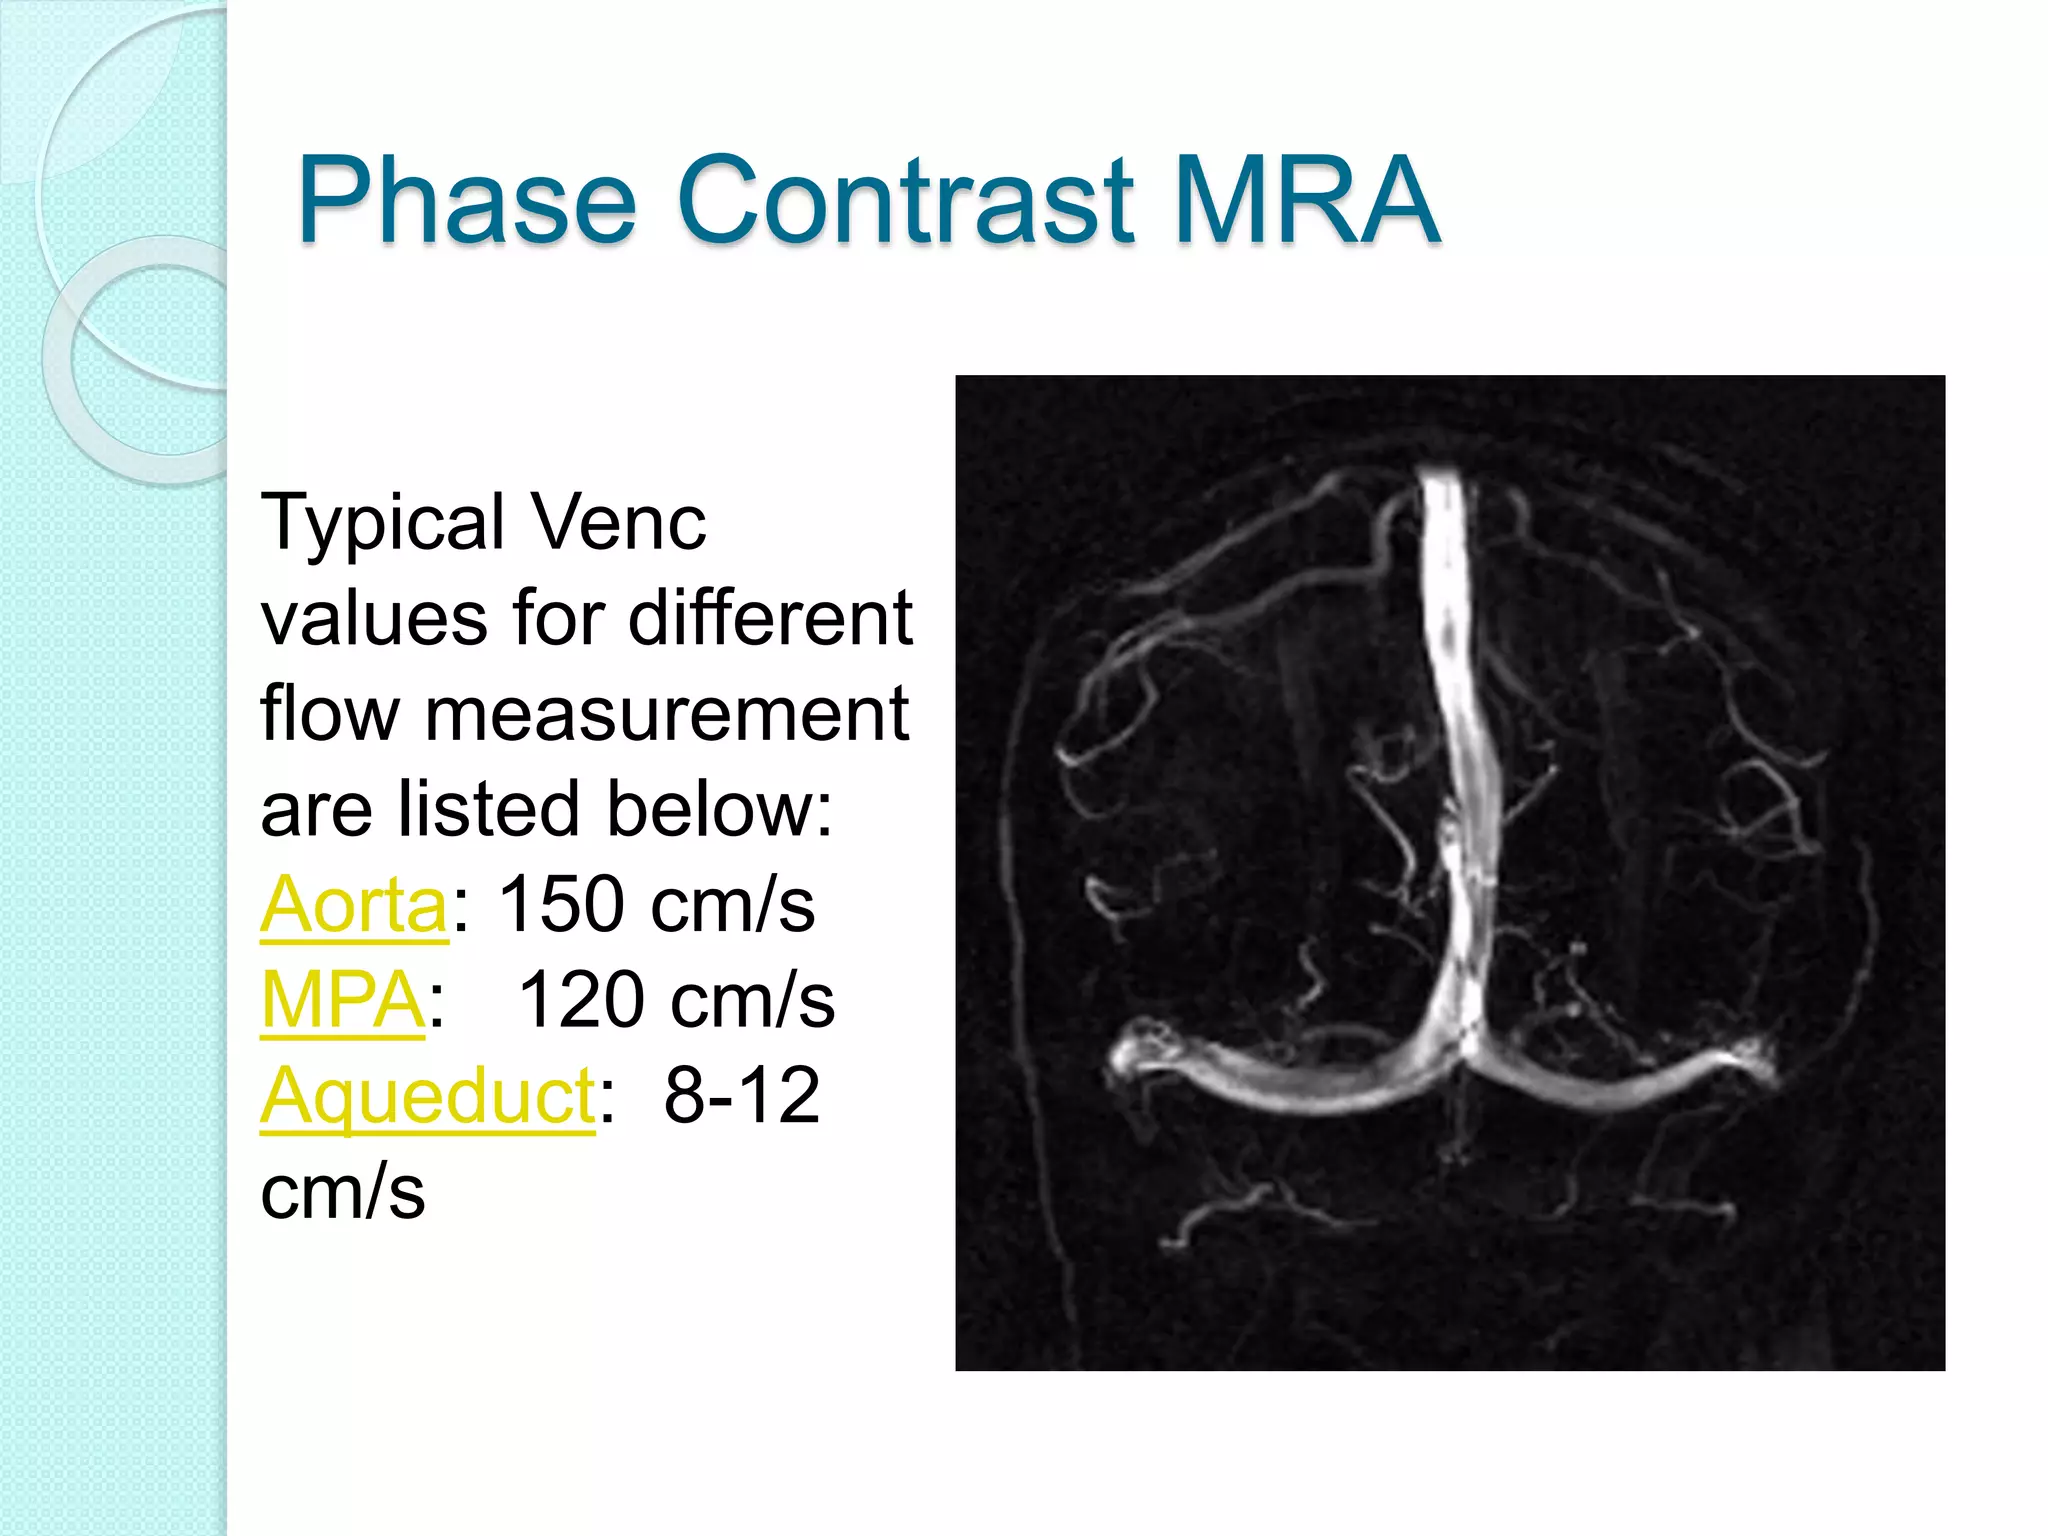
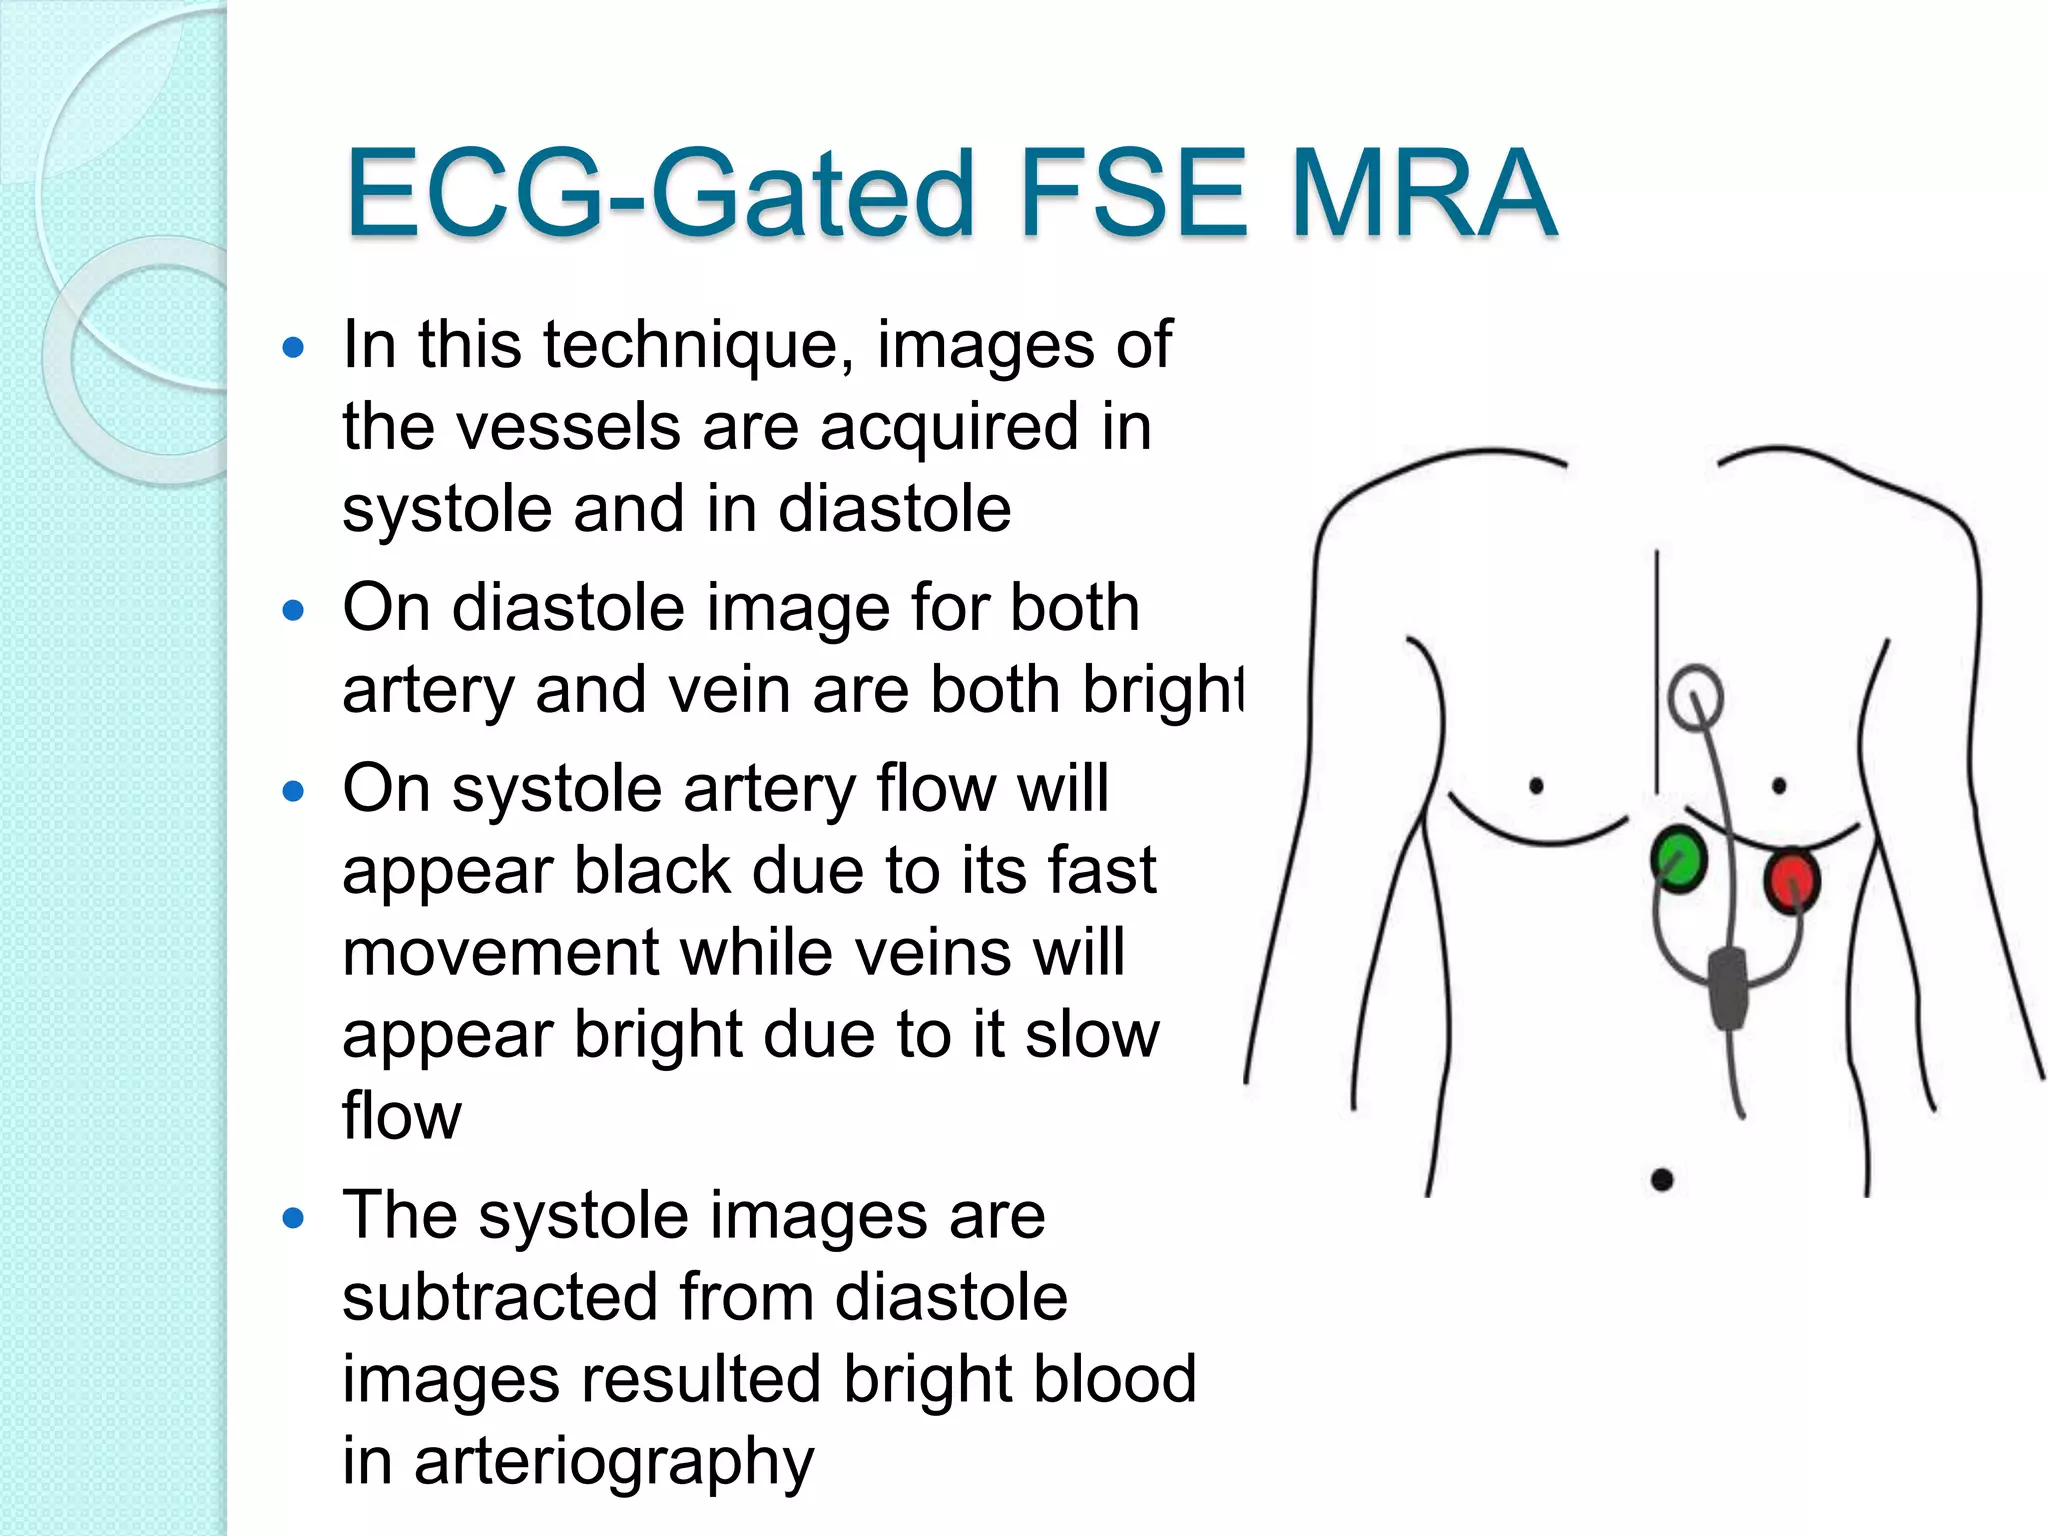
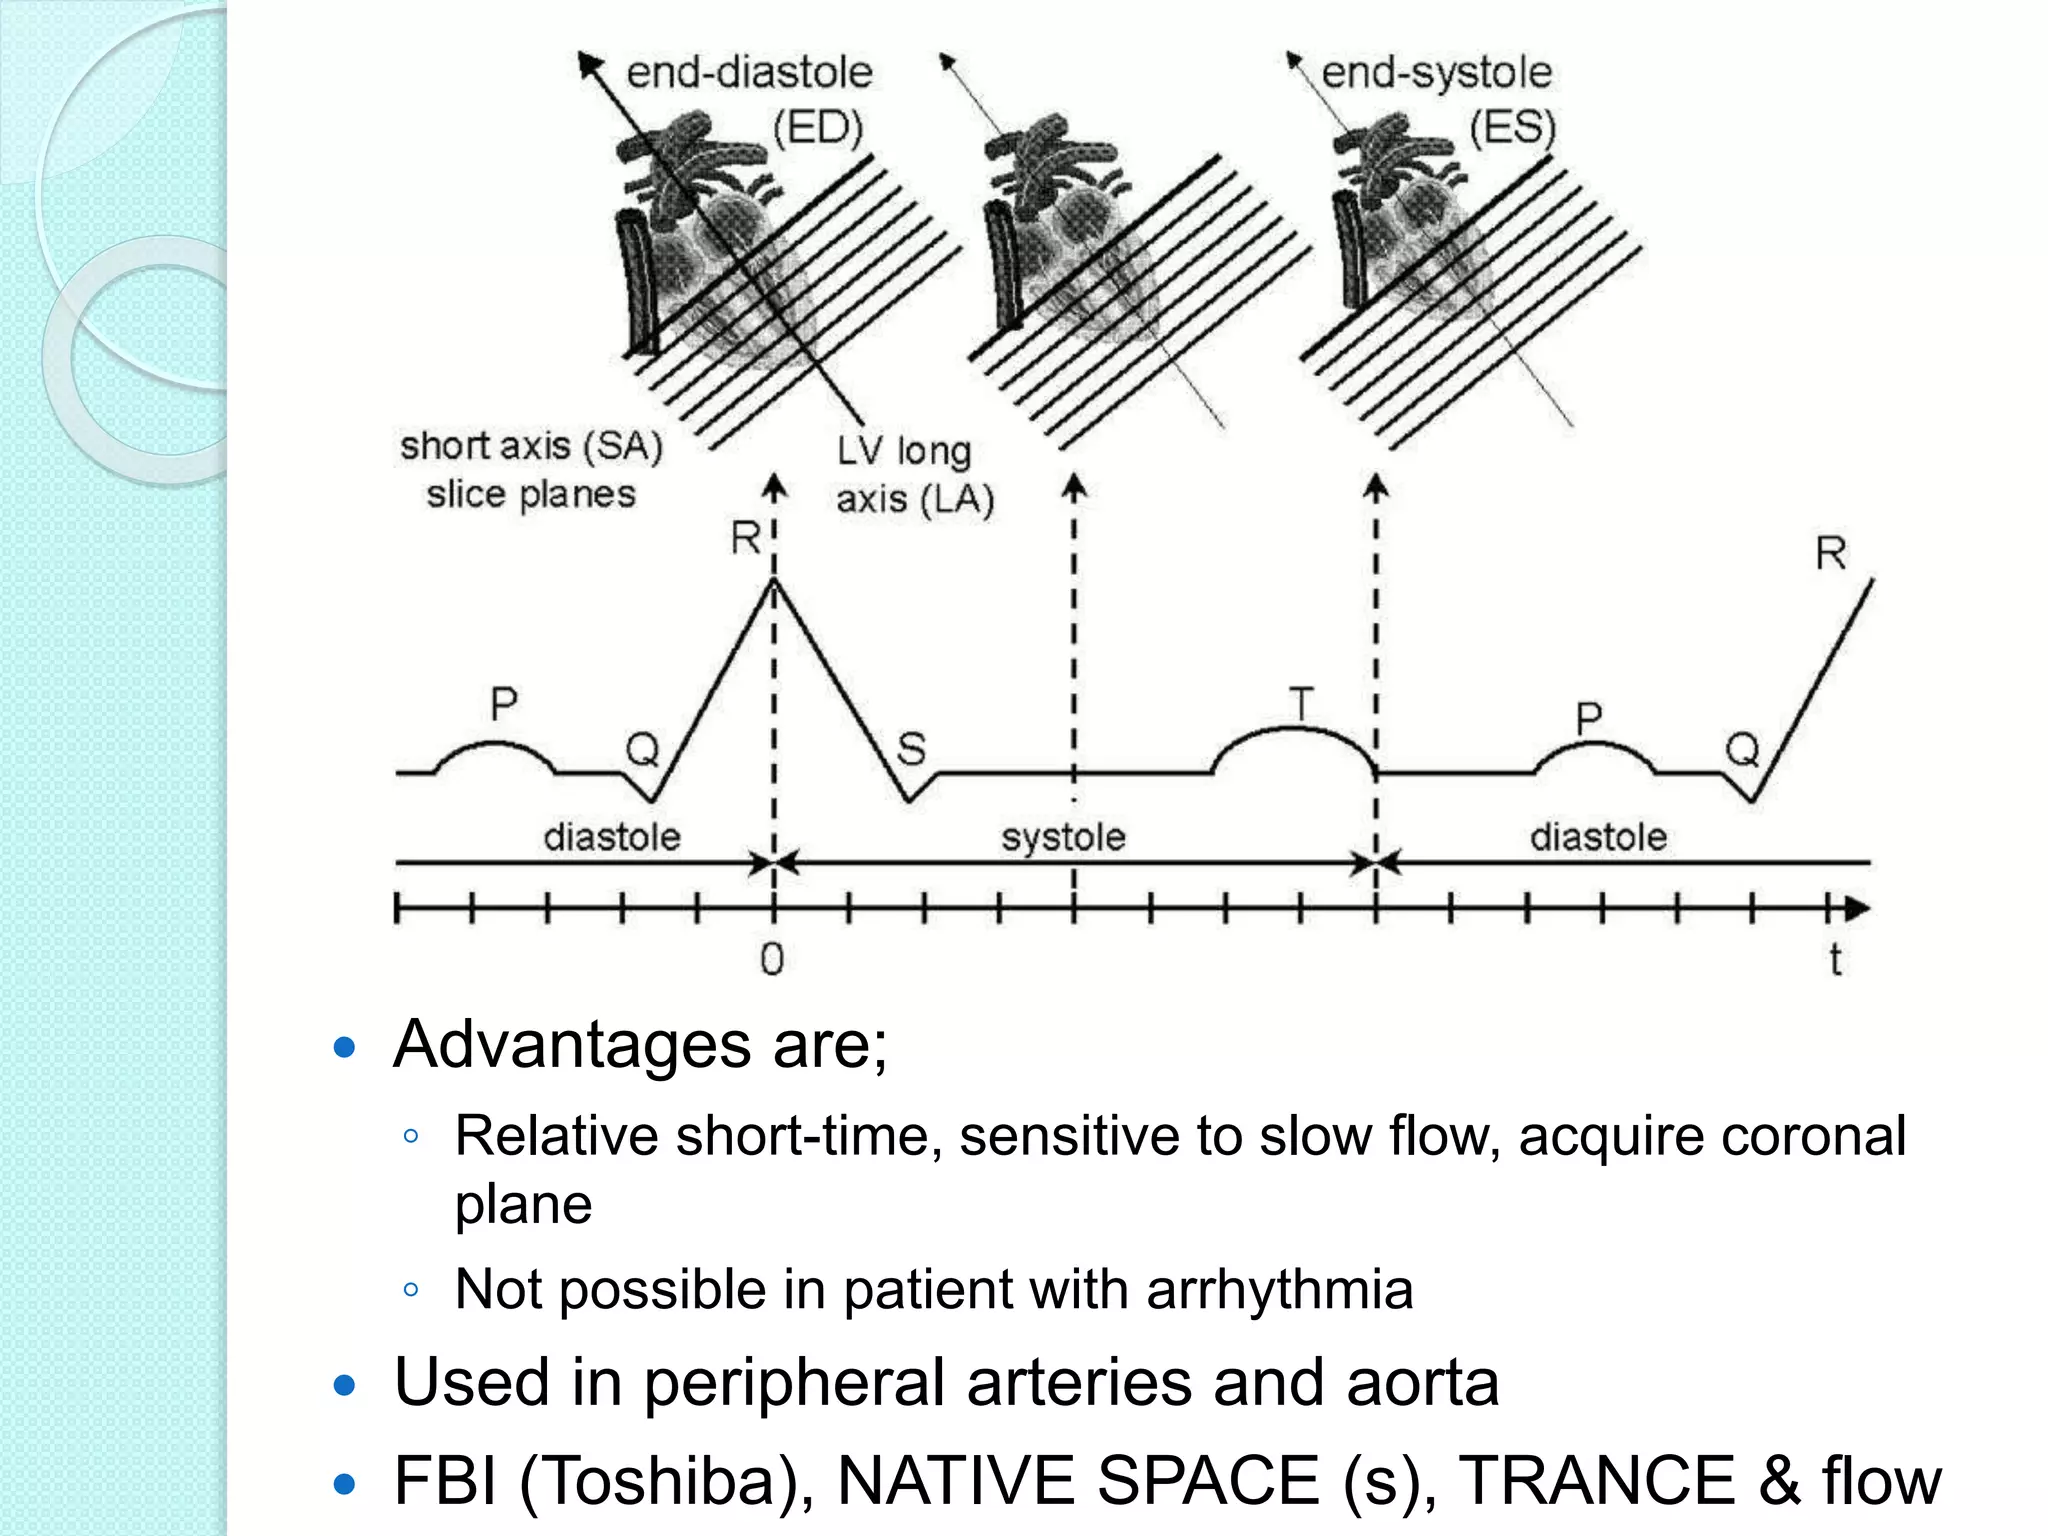
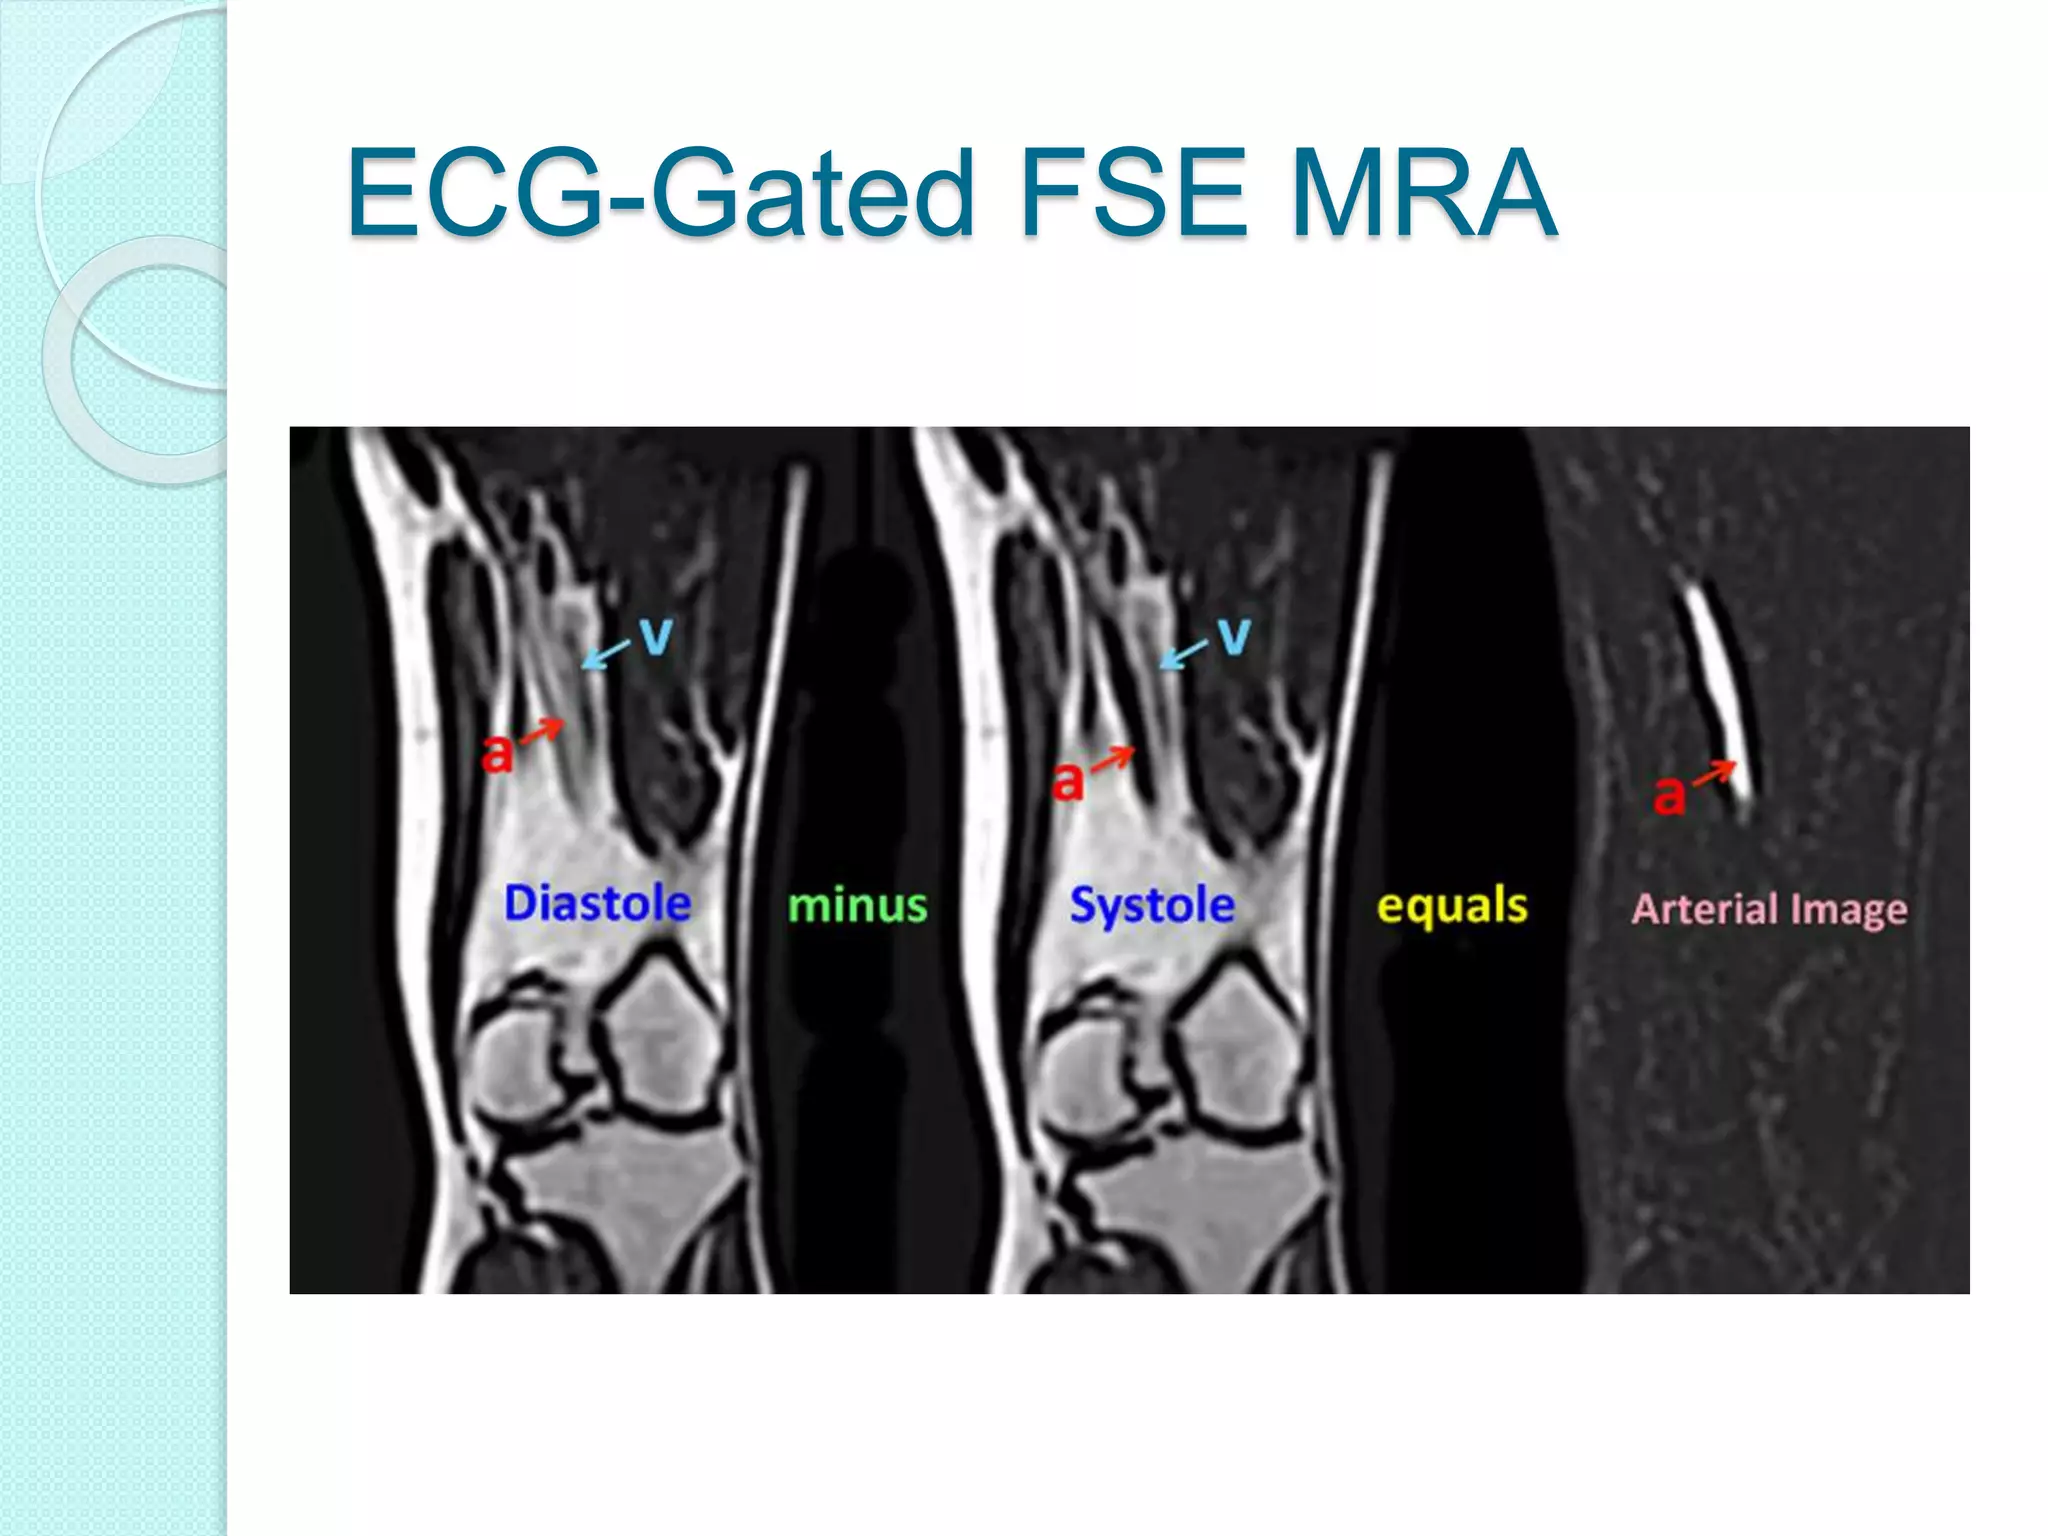
Phase contrast MRI uses changes in the phase of tissue magnetization from moving protons to create angiographic images and measure flow velocity. ECG-gated MRI acquires images during systole and diastole, subtracting the former to highlight arteries based on their faster flow during cardiac contraction. Typical velocity encoding values are 20-30 cm/s for veins, 40-60 cm/s for higher arterial flow, and over 60 cm/s to determine flow direction and velocity.
Everything regarding the physics of MRA is given along with flow charts and images. Also have covered new advances and refrences taken from MR made easy and some articles related to MRI
Magnetic Resonance Angiography and VenographyAnjan Dangal
Introduction to MR Angiography and Venography Procedure of Brain . Includes Indication, MRI protocol, planning and anatomy as well as brief intoduction to physics behind MRA and MRV principle.
Image Quality, Artifacts and it's Remedies in CT-Avinesh ShresthaAvinesh Shrestha
CT is one of the frequently used diagnostic imaging modalities in Radiology. Knowledge about image quality and artifacts is essential when diagnosing a patient with the help of CT images. Moreover, Radiology Technologist's should be very well aware about the ways to identify and eliminate or minimize the artifacts in CT for better image quality.
One test can save your life. Know what a CT Scan Enterography is, why you should have it, who should get it, and where can you get tested as well as get your results fast. If you want to read more about CT Scan Enterography, just click the link below.
Visit: https://www.labfinder.com/labexams/ct-scan-enterography/ and get tested now!
MDCT Principles and Applications- Avinesh ShresthaAvinesh Shrestha
Multidetector CT (MDCT) is one of the most commonly used imaging modality in the field of Radiology. Development and advancement in MDCT has made it's application as a major component in diagnosis and treatment planning of multitude of disease across the planet. This presentation briefly describes its basic principle and it's wide variety of application in medical imaging.
A detailed description of ct coronary angiography and calcium scoring with various aspects regarding the preparation, procedure, limitations and a short review regarding post CABG imaging.
MAGNETIC RESONANCE ANGIOGRAPHY (MRA).pptxRohit Bansal
MAGNETIC RESONANCE ANGIOGRAPHY (MRA) AND MAGNETIC RESONANCE SPECTROSCOPY (MRS) ARE DESCRIBED IN DETAILIN THIS PPT. CONTENT TAKEN FROM MUTIPLE BOOKS AND GENERALS.
Singular value decomposition filtering in high-frame-rate cardiac vector flow...journalBEEI
Dysfunction of the left ventricle (LV) weakens the cardiac function and affects the physical activity. Echocardiagraphy has been used to visualize the blood flow dynamics and to evaluate the cardiac function. However, the signal processing to suppress the clutter signals should be employed. In this study, we employed the singular value decomposition (SVD) clutter filtering to obtain the cardiac blood speckle images. We also employed the adaptive thresholding metric to determine the proper cutoff values at each phase during the cardiac cycle. Moreover, we employed a depth-dependent SVD clutter filter for more accurate estimation of the cardiac blood echo signals. The 2D blood flow velocity vectors were estimated by applying the block matching method to obtained blood speckle images. The obtained results show that the proposed filter suppressed the clutter signals from left ventricular wall significantly, and the contrast-to-noise ratio (CNR) was improved from -0.5 dB to 13.8 dB by the proposed SVD clutter filtering.
ECG Signal Compression Technique Based on Discrete Wavelet Transform and QRS-...CSCJournals
In this paper, an Electrocardiogram (ECG) signal is compressed based on discrete wavelet transform (DWT) and QRS-complex estimation. The ECG signal is preprocessed by normalization and mean removal. Then, an error signal is formed as the difference between the preprocessed ECG signal and the estimated QRS-complex waveform. This error signal is wavelet transformed and the resulting wavelet coefficients are thresholded by setting to zero all coefficients that are smaller than certain threshold levels. The threshold levels of all subbands are calculated based on Energy Packing Efficiency (EPE) such that minimum percentage root mean square difference (PRD) and maximum compression ratio (CR) are obtained. The resulted thresholded DWT coefficients are coded using the coding technique given in [1], [20]. The compression algorithm was implemented and tested upon records selected from the MIT - BIH arrhythmia database [2]. Simulation results show that the proposed algorithm leads to high CR associated with low distortion level relative to previously reported compression algorithms [1], [14] and [18]. For example, the compression of record 100 using the proposed algorithm yields to CR = 25.15 associated with PRD = 0.7% and PSNR = 45 dB. This achieves compression rate of nearly 128 bit/sec. The main features of this compression algorithm are the high efficiency, high speed and simplicity in design.
Electromagnetic Flow meters
Blood flow helps to understand basic physiological processes and e.g. the dissolution of a medicine into the body.
Blood flow and changes in blood volume, are usually correlated with concentration of nutrients and other substance in the blood.
Also, Blood Flow measurement reflects the concentration of O2.
International Journal of Engineering Research and Applications (IJERA) is an open access online peer reviewed international journal that publishes research and review articles in the fields of Computer Science, Neural Networks, Electrical Engineering, Software Engineering, Information Technology, Mechanical Engineering, Chemical Engineering, Plastic Engineering, Food Technology, Textile Engineering, Nano Technology & science, Power Electronics, Electronics & Communication Engineering, Computational mathematics, Image processing, Civil Engineering, Structural Engineering, Environmental Engineering, VLSI Testing & Low Power VLSI Design etc.
Analysis Predicted Location of Harmonic Distortion in RF Upconverter StructureTELKOMNIKA JOURNAL
A new mathematical analysis to predict the magnitude size of the distortion products from the
signal up-conversion process output is presented. The signal up-conversion process converts the digital
baseband from the analog baseband into a radio frequency signal. When the signal baseband involves
frequency offsetting then occurring a number of distortion products which can reduce the dynamic range
so it is difficult to meet the spectrum mask requirements within the operating band. This paper will focus on
methods of new mathematical analysis using a continuous frequency range and only applies to a single
side band tone, with constant amplitude into any value of frequency offsets. The novel contribution to the
analysis starts at generating the gate signal and convolution of the gate signal into the reference carrier
signal. The results show very close between the simulation results and the calculation of the predicted
location of the distortions.
- Video recording of this lecture in English language: https://youtu.be/lK81BzxMqdo
- Video recording of this lecture in Arabic language: https://youtu.be/Ve4P0COk9OI
- Link to download the book free: https://nephrotube.blogspot.com/p/nephrotube-nephrology-books.html
- Link to NephroTube website: www.NephroTube.com
- Link to NephroTube social media accounts: https://nephrotube.blogspot.com/p/join-nephrotube-on-social-media.html
Title: Sense of Taste
Presenter: Dr. Faiza, Assistant Professor of Physiology
Qualifications:
MBBS (Best Graduate, AIMC Lahore)
FCPS Physiology
ICMT, CHPE, DHPE (STMU)
MPH (GC University, Faisalabad)
MBA (Virtual University of Pakistan)
Learning Objectives:
Describe the structure and function of taste buds.
Describe the relationship between the taste threshold and taste index of common substances.
Explain the chemical basis and signal transduction of taste perception for each type of primary taste sensation.
Recognize different abnormalities of taste perception and their causes.
Key Topics:
Significance of Taste Sensation:
Differentiation between pleasant and harmful food
Influence on behavior
Selection of food based on metabolic needs
Receptors of Taste:
Taste buds on the tongue
Influence of sense of smell, texture of food, and pain stimulation (e.g., by pepper)
Primary and Secondary Taste Sensations:
Primary taste sensations: Sweet, Sour, Salty, Bitter, Umami
Chemical basis and signal transduction mechanisms for each taste
Taste Threshold and Index:
Taste threshold values for Sweet (sucrose), Salty (NaCl), Sour (HCl), and Bitter (Quinine)
Taste index relationship: Inversely proportional to taste threshold
Taste Blindness:
Inability to taste certain substances, particularly thiourea compounds
Example: Phenylthiocarbamide
Structure and Function of Taste Buds:
Composition: Epithelial cells, Sustentacular/Supporting cells, Taste cells, Basal cells
Features: Taste pores, Taste hairs/microvilli, and Taste nerve fibers
Location of Taste Buds:
Found in papillae of the tongue (Fungiform, Circumvallate, Foliate)
Also present on the palate, tonsillar pillars, epiglottis, and proximal esophagus
Mechanism of Taste Stimulation:
Interaction of taste substances with receptors on microvilli
Signal transduction pathways for Umami, Sweet, Bitter, Sour, and Salty tastes
Taste Sensitivity and Adaptation:
Decrease in sensitivity with age
Rapid adaptation of taste sensation
Role of Saliva in Taste:
Dissolution of tastants to reach receptors
Washing away the stimulus
Taste Preferences and Aversions:
Mechanisms behind taste preference and aversion
Influence of receptors and neural pathways
Impact of Sensory Nerve Damage:
Degeneration of taste buds if the sensory nerve fiber is cut
Abnormalities of Taste Detection:
Conditions: Ageusia, Hypogeusia, Dysgeusia (parageusia)
Causes: Nerve damage, neurological disorders, infections, poor oral hygiene, adverse drug effects, deficiencies, aging, tobacco use, altered neurotransmitter levels
Neurotransmitters and Taste Threshold:
Effects of serotonin (5-HT) and norepinephrine (NE) on taste sensitivity
Supertasters:
25% of the population with heightened sensitivity to taste, especially bitterness
Increased number of fungiform papillae
Title: Sense of Smell
Presenter: Dr. Faiza, Assistant Professor of Physiology
Qualifications:
MBBS (Best Graduate, AIMC Lahore)
FCPS Physiology
ICMT, CHPE, DHPE (STMU)
MPH (GC University, Faisalabad)
MBA (Virtual University of Pakistan)
Learning Objectives:
Describe the primary categories of smells and the concept of odor blindness.
Explain the structure and location of the olfactory membrane and mucosa, including the types and roles of cells involved in olfaction.
Describe the pathway and mechanisms of olfactory signal transmission from the olfactory receptors to the brain.
Illustrate the biochemical cascade triggered by odorant binding to olfactory receptors, including the role of G-proteins and second messengers in generating an action potential.
Identify different types of olfactory disorders such as anosmia, hyposmia, hyperosmia, and dysosmia, including their potential causes.
Key Topics:
Olfactory Genes:
3% of the human genome accounts for olfactory genes.
400 genes for odorant receptors.
Olfactory Membrane:
Located in the superior part of the nasal cavity.
Medially: Folds downward along the superior septum.
Laterally: Folds over the superior turbinate and upper surface of the middle turbinate.
Total surface area: 5-10 square centimeters.
Olfactory Mucosa:
Olfactory Cells: Bipolar nerve cells derived from the CNS (100 million), with 4-25 olfactory cilia per cell.
Sustentacular Cells: Produce mucus and maintain ionic and molecular environment.
Basal Cells: Replace worn-out olfactory cells with an average lifespan of 1-2 months.
Bowman’s Gland: Secretes mucus.
Stimulation of Olfactory Cells:
Odorant dissolves in mucus and attaches to receptors on olfactory cilia.
Involves a cascade effect through G-proteins and second messengers, leading to depolarization and action potential generation in the olfactory nerve.
Quality of a Good Odorant:
Small (3-20 Carbon atoms), volatile, water-soluble, and lipid-soluble.
Facilitated by odorant-binding proteins in mucus.
Membrane Potential and Action Potential:
Resting membrane potential: -55mV.
Action potential frequency in the olfactory nerve increases with odorant strength.
Adaptation Towards the Sense of Smell:
Rapid adaptation within the first second, with further slow adaptation.
Psychological adaptation greater than receptor adaptation, involving feedback inhibition from the central nervous system.
Primary Sensations of Smell:
Camphoraceous, Musky, Floral, Pepperminty, Ethereal, Pungent, Putrid.
Odor Detection Threshold:
Examples: Hydrogen sulfide (0.0005 ppm), Methyl-mercaptan (0.002 ppm).
Some toxic substances are odorless at lethal concentrations.
Characteristics of Smell:
Odor blindness for single substances due to lack of appropriate receptor protein.
Behavioral and emotional influences of smell.
Transmission of Olfactory Signals:
From olfactory cells to glomeruli in the olfactory bulb, involving lateral inhibition.
Primitive, less old, and new olfactory systems with different path
Explore natural remedies for syphilis treatment in Singapore. Discover alternative therapies, herbal remedies, and lifestyle changes that may complement conventional treatments. Learn about holistic approaches to managing syphilis symptoms and supporting overall health.
Ozempic: Preoperative Management of Patients on GLP-1 Receptor Agonists Saeid Safari
Preoperative Management of Patients on GLP-1 Receptor Agonists like Ozempic and Semiglutide
ASA GUIDELINE
NYSORA Guideline
2 Case Reports of Gastric Ultrasound
Lung Cancer: Artificial Intelligence, Synergetics, Complex System Analysis, S...Oleg Kshivets
RESULTS: Overall life span (LS) was 2252.1±1742.5 days and cumulative 5-year survival (5YS) reached 73.2%, 10 years – 64.8%, 20 years – 42.5%. 513 LCP lived more than 5 years (LS=3124.6±1525.6 days), 148 LCP – more than 10 years (LS=5054.4±1504.1 days).199 LCP died because of LC (LS=562.7±374.5 days). 5YS of LCP after bi/lobectomies was significantly superior in comparison with LCP after pneumonectomies (78.1% vs.63.7%, P=0.00001 by log-rank test). AT significantly improved 5YS (66.3% vs. 34.8%) (P=0.00000 by log-rank test) only for LCP with N1-2. Cox modeling displayed that 5YS of LCP significantly depended on: phase transition (PT) early-invasive LC in terms of synergetics, PT N0—N12, cell ratio factors (ratio between cancer cells- CC and blood cells subpopulations), G1-3, histology, glucose, AT, blood cell circuit, prothrombin index, heparin tolerance, recalcification time (P=0.000-0.038). Neural networks, genetic algorithm selection and bootstrap simulation revealed relationships between 5YS and PT early-invasive LC (rank=1), PT N0—N12 (rank=2), thrombocytes/CC (3), erythrocytes/CC (4), eosinophils/CC (5), healthy cells/CC (6), lymphocytes/CC (7), segmented neutrophils/CC (8), stick neutrophils/CC (9), monocytes/CC (10); leucocytes/CC (11). Correct prediction of 5YS was 100% by neural networks computing (area under ROC curve=1.0; error=0.0).
CONCLUSIONS: 5YS of LCP after radical procedures significantly depended on: 1) PT early-invasive cancer; 2) PT N0--N12; 3) cell ratio factors; 4) blood cell circuit; 5) biochemical factors; 6) hemostasis system; 7) AT; 8) LC characteristics; 9) LC cell dynamics; 10) surgery type: lobectomy/pneumonectomy; 11) anthropometric data. Optimal diagnosis and treatment strategies for LC are: 1) screening and early detection of LC; 2) availability of experienced thoracic surgeons because of complexity of radical procedures; 3) aggressive en block surgery and adequate lymph node dissection for completeness; 4) precise prediction; 5) adjuvant chemoimmunoradiotherapy for LCP with unfavorable prognosis.
Report Back from SGO 2024: What’s the Latest in Cervical Cancer?bkling
Are you curious about what’s new in cervical cancer research or unsure what the findings mean? Join Dr. Emily Ko, a gynecologic oncologist at Penn Medicine, to learn about the latest updates from the Society of Gynecologic Oncology (SGO) 2024 Annual Meeting on Women’s Cancer. Dr. Ko will discuss what the research presented at the conference means for you and answer your questions about the new developments.
Anti ulcer drugs and their Advance pharmacology ||
Anti-ulcer drugs are medications used to prevent and treat ulcers in the stomach and upper part of the small intestine (duodenal ulcers). These ulcers are often caused by an imbalance between stomach acid and the mucosal lining, which protects the stomach lining.
||Scope: Overview of various classes of anti-ulcer drugs, their mechanisms of action, indications, side effects, and clinical considerations.
micro teaching on communication m.sc nursing.pdfAnurag Sharma
Microteaching is a unique model of practice teaching. It is a viable instrument for the. desired change in the teaching behavior or the behavior potential which, in specified types of real. classroom situations, tends to facilitate the achievement of specified types of objectives.
3. Phase Contrast MRA
PC-MRA uses change in the phase of TM of
the blood and form an image
The selective phase shift of the moving p+
is produced
GRE of a given strength is applied to both
stationery as well as moving p+ causing
phase shift in both but at different rates
Initial RF excitation pulse brings all p+ in
phase
Second GRE of same amplitude and
duration but of opposite polarity is applied
5. In stationery p+ reversal of phase shift
occur of exact amount
Canceling the effect of original phase
shift
Resulting into no net phase shift
Hence, flowing p+ changed their position
the phase shift will not be corrected
This shift is directly proportional to the
change in location or distance the p+
travel b/w application of first and second
gradients
The phase shift is used by PC-MRA to
create angiographic image and to
measure flow velocity
7. Velocity encoding gradients are applied
in one or all three directions to acquire
quantitative information
Velocity encoding technique
compensates for projected flow velocity
within the vessel by controlling the
amplitude or strength of the bipolar
gradient
If velocity encoding (VENC) is selected
lower than the velocity within the vessel-
aliasing occurs
Aliasing results in low signal intensity in
the centre of the vessel and
Better delineation of the vessel wall
8.
9. Typical values of the VENC are
◦ 20-30 cm/s for venous flow
◦ 40-60 cm/s for higher velocity with some aliasing
◦ 60-80 cm/s to determine velocity and flow
direction
PC-MRA provides information about flow
direction
If flow is encoded from superior to inferior
Head will appears bright and feet appears
black
PC-MRA are in 2D or 3D acquisition
2D used in routine practice bcoz of
acceptable acquisition time of 1-3 minutes
10. Phase Contrast MRA
Typical Venc
values for different
flow measurement
are listed below:
Aorta: 150 cm/s
MPA: 120 cm/s
Aqueduct: 8-12
cm/s
11. ECG-Gated FSE MRA
In this technique, images of
the vessels are acquired in
systole and in diastole
On diastole image for both
artery and vein are both bright
On systole artery flow will
appear black due to its fast
movement while veins will
appear bright due to it slow
flow
The systole images are
subtracted from diastole
images resulted bright blood
in arteriography
12. Advantages are;
◦ Relative short-time, sensitive to slow flow, acquire coronal
plane
◦ Not possible in patient with arrhythmia
Used in peripheral arteries and aorta
FBI (Toshiba), NATIVE SPACE (s), TRANCE & flow