4D flow MRI is an advanced MRI technique that allows for the acquisition of three-directional blood flow data throughout the entire cardiac cycle. It provides a time-resolved 3D velocity field that offers improved characterization of cardiovascular disease compared to standard 2D phase contrast MRI. The 4D flow MRI data undergoes preprocessing to correct for errors from factors like eddy currents before blood flow visualization and quantification. Clinical applications of 4D flow MRI include assessing congenital heart disease, such as evaluating the severity of pulmonary regurgitation after tetralogy of Fallot repair. It also has potential benefits for predicting complications earlier and aiding surgical planning.

![What is 4D flow?
MRI techniques carry valuable tools for:
Diagnosing cardiac and vascular diseases
Measuring disease severity
Assessing patient response to medical and
surgical therapy.
Provides morphological information
Provides functional information on cardiac
perfusion, myocardial viability, and blood flow.
Figure 1: a 3D rendering of the heart with blood flow
depicted through streamlines of varying color. The
different colors determine areas of high/low velocity.
[4]](https://image.slidesharecdn.com/c4ce9698-fd4d-40cb-934d-51d97807f920-150515170744-lva1-app6891/75/4D-Flow-MRI-2-2048.jpg)
![What is 4D flow?
Further development of phase
contrast (PC) techniques has resulted
in the acquisition of a time-resolved
(CINE), 3D PC-MRI. This includes:
Three-directional velocity
encoding. This is known as 4D flow
MRI.
4D flow MRI can provide information
on a temporal and spatial evolution
of 3D blood flow that includes full
volumetric coverage of any cardiac
region of interest.
MRI_gadolinium
-enhanced MR
angiogarphy
with 3D
reconstruction.
[1]](https://image.slidesharecdn.com/c4ce9698-fd4d-40cb-934d-51d97807f920-150515170744-lva1-app6891/75/4D-Flow-MRI-3-2048.jpg)
![What is 4D flow?
Images from 2D CINE PC-MRI
examination of right renal
artery. [1]
A Particular advantage over 2D
CINE PC-MRI is related to the
possibility for retrospective
selection of territories at any
location inside the 3D data
volume to perform post-hoc
quantification of blood flow
parameters like:
1. Total flow
2. Peak velocity
3. Regurgitant fraction
3D CINE PC-MRI of a looped
cardiac cycle. [1]](https://image.slidesharecdn.com/c4ce9698-fd4d-40cb-934d-51d97807f920-150515170744-lva1-app6891/75/4D-Flow-MRI-4-2048.jpg)
![A number of 4D flow MRI studies have attempted to assess and
corroborate blood flow parameters:
1. Peak pressure gradient
2. Peak and mean velocities
3. Net flow over the cardiac cycle
4. Vessel area
4D flow MRI can be used to derive hemodynamic measures like:
1. Wall shear stress
2. Pressure difference
3. Pulse wave velocity
4. Turbulent kinetic energy
for improved characterization of cardiovascular disease.
Summary of time-averaged wall shear stress (WSS)
results for all subjects. Mean WSS color maps (left
panel) for two representative age- and sex-matched
(top) normal subjects and (bottom) PAH patients.
Mean WSS was lower in the proximal arteries of the PAH
patients than in those of the normal subjects. Mean
WSS averaged over the area of 10-mm circumferential
strips taken at the LPA and RPA (proximal) and distal
locations was significantly different between the two
populations (right panel). [5]](https://image.slidesharecdn.com/c4ce9698-fd4d-40cb-934d-51d97807f920-150515170744-lva1-app6891/75/4D-Flow-MRI-5-2048.jpg)
![MRI flow measurements provide information of blood supply of various vessels and
tissues as well as cerebro spinal fluid movement. In addition to PC and CINE
sequences, flow can be measured and visualized with time of flight angiography;
also, contrast enhanced MRI methods may be implemented.
The different flow types encountered
in 4D flow are:
1) Stagnant flow
2) Laminar Flow
3) Vortex Flow
4) Turbulent Flow
Figure: Evolution of vortex structures during
pulsatile cycle. [1]](https://image.slidesharecdn.com/c4ce9698-fd4d-40cb-934d-51d97807f920-150515170744-lva1-app6891/75/4D-Flow-MRI-6-2048.jpg)
![Flow voids
Is the occurrence of a low
signal in regions of flow. [1]
Ghost images
These are caused by pulsatile flow
of the vessel extending across the
image in the phase encoding
direction. This image is a
subtraction of two T1 weighted
pre- and post contrast images.
The motion artifact appears as
ghosting and blurring caused by
fluid and bowel motion. [1]
Flow related
dephasing
Occurs when spin isochromats
are moving with different
velocities in an external
gradiaent field so that they
acquire different pahses.
Figure: Flow dephasing from
turbulent flow around tumor. [1]](https://image.slidesharecdn.com/c4ce9698-fd4d-40cb-934d-51d97807f920-150515170744-lva1-app6891/75/4D-Flow-MRI-7-2048.jpg)
![Flow Artifacts:
The inconsistency of the signal resulting from pulsatile flow can lead to artifacts in
the image.
Spin Phase Effect, Flow: are vascular ghosts (ghosting artifact), and
anomalous intensities in images. Reason: movement of bodily fluids.
Help: flow compensation, presaturation, triggering. Image
Guidance: reduction in artifacts in reducing phase shifts with flow
compensation, suppression of the blood signal.
Radio Frequency Overflow, Data Clipping: it is a non-uniform image.
Reason: signal too intense. Help: Manually decrease of the receiver
gain. The received radio frequency signal is too strong, resulting in a
washed out image. Image Guidance: Auto-prescanning usually
adjusts the amplification at the receiver.
Figure: Ghosting from
abdominal fat,
oriented in the phase
encoding direction.
[2]](https://image.slidesharecdn.com/c4ce9698-fd4d-40cb-934d-51d97807f920-150515170744-lva1-app6891/75/4D-Flow-MRI-8-2048.jpg)
![Standard 2D PC-MRI:
PC-MRI takes advantage of the direct relationship between
blood flow velocity and the phase of the MR signal that is
acquired during an MRI measurement.
Signal intensities in resulting phase difference images are
directly related to blood flow, allowing us to visualize and
quantify blood flow.
2D MRI of blood flow.
Cardiac mitral valve
proplapse in vertical long
axis view. [4]
3D PC-MRI image
composed of a series of 2D
slices for blood flow
intensities. [6]](https://image.slidesharecdn.com/c4ce9698-fd4d-40cb-934d-51d97807f920-150515170744-lva1-app6891/75/4D-Flow-MRI-10-2048.jpg)
![2D PC data is acquired over multiple
cardiac cycles using ECG gated
CINE imaging to measure pulsatile
blood flow.
In clinical applications, the 2D
imaging slice is typically positioned
normal to the vessel lumen. Data
acquisition is of single-direction
velocity measurement performed
during a 10-20 second breath
holding period. 2D CINE PC-MRI yield
a series of anatomical and flow
velocity images.
Typical parameters:
1. Spatial resolution, 1.5 – 2.5 ,
2. Temporal resolution, 30 – 60 ms,
3. Slice thickness, 5 – 8 mm.
Figure: Standard
2D CINE PC-MRI
with one-
directional
through-plane
velocity encoding.
[4]](https://image.slidesharecdn.com/c4ce9698-fd4d-40cb-934d-51d97807f920-150515170744-lva1-app6891/75/4D-Flow-MRI-11-2048.jpg)
![Cardiac Gating
This first 4 MRI
CINE imaging
slices are
carried out in
conventional
short axis
orientation
(two chamber
view) from a
apical to a
midventricular
slice of the
heart. [3]
Synchronizes heartbeat with
beginning of repetition time (TR),
whereat the r wave is used as
the trigger.
ECG gating techniques are
useful whenever data
acquisition is too slow to occur
during a short fraction of the
cardiac cycle.
Image blurring occurs for
imaging times above approx.
50 ms in systole, while imaging
during diastole is of the order
200 – 300 ms.
Cardiac infarct 4 chamber
view including the left
ventricular outflow tract. [3]](https://image.slidesharecdn.com/c4ce9698-fd4d-40cb-934d-51d97807f920-150515170744-lva1-app6891/75/4D-Flow-MRI-12-2048.jpg)
![PC-MRI and Velocity Encoding Sensitivity:
Important PC-MRI parameter is the
maximum flow velocity.
When the underlying velocity
exceeds the acquisition setting for
Venc, the velocity aliasing can occur
which is typically visible as a sudden
change from high to low velocity
within a region of flow.
velocity noise is directly related to
the maximum flow velocity.
selecting a high Venc may alleviate
the issue of velocity aliasing but will
also increase the level of velocity
noise in flow velocity images.
Typical settings for Venc are:
1. 150 – 200 cm/s in the thoracic aorta.
2. 250 – 400 cm/s in the aorta with
aortic stenosis or coarctation.
3. 100 – 150 cm/s for intra-cardiac flow.
4. 50 – 80 cm/s in large vessels of the
venous system.
2D CINE PC-MRI with aliasing in a patient with
bicuspid aortic valve disease and aortic
coarctation. Patient underwent standard MRA
along with 2D CINE PC-MRI for quantification of
ascending aorta and post-coarctation flow
velocity. [4]](https://image.slidesharecdn.com/c4ce9698-fd4d-40cb-934d-51d97807f920-150515170744-lva1-app6891/75/4D-Flow-MRI-13-2048.jpg)
![4D Flow MRI:
Velocity is encoded along all
three spatial dimensions
throughout the cardiac cycle,
providing a time-resolved 3D
velocity field.
Three-directional velocity
measurements can be achieved
by interleaved four-point velocity
encoding.
After completion of the 4D flow
acquisition, four time-resolved
(CINE) 3D datasets are generated. Data acquisition and analysis workflow for
4D flow MRI. [4]](https://image.slidesharecdn.com/c4ce9698-fd4d-40cb-934d-51d97807f920-150515170744-lva1-app6891/75/4D-Flow-MRI-14-2048.jpg)
![Data Analysis: Preprocessing and Corrections
There exist multiple sources of
phase offset errors that can
degrade image quality.
Most commonly encountered
errors:
1. Eddy currents
2. Maxwell terms
3. Gradient field nonlinearity
Appropriate correction strategies
must be included to compensate
for all errors.
Eddy current correction cannot
easily be automated and has to
be integrated into the data
analysis workflow. (Middle) Data preprocessing corrects for
errors due to noise, aliasing and eddy
currents and calculates the 3D PC-MRA. [4]](https://image.slidesharecdn.com/c4ce9698-fd4d-40cb-934d-51d97807f920-150515170744-lva1-app6891/75/4D-Flow-MRI-16-2048.jpg)
![Data Analysis: Preprocessing and Corrections
Black areas with bright
spots and an overall bad
image quality are
characteristic for eddy
currents. [2]
The image distortion is
visible over the whole
slice. [2]](https://image.slidesharecdn.com/c4ce9698-fd4d-40cb-934d-51d97807f920-150515170744-lva1-app6891/75/4D-Flow-MRI-17-2048.jpg)
![Data Analysis – 3D Blood Flow Visualization
Two examples of systolic 3D
streamline representation of 4D
flow MRI data in patients with
bicuspid aortic valve. [4]
4D flow MRI in a 3.5 year-old
pediatric patient with bicuspid
aortic valve and aortic coarctation
at the distal arch/proximal
descending aorta junction. [4]](https://image.slidesharecdn.com/c4ce9698-fd4d-40cb-934d-51d97807f920-150515170744-lva1-app6891/75/4D-Flow-MRI-18-2048.jpg)
![Data Analysis – 3D Blood Flow Visualization
[5]](https://image.slidesharecdn.com/c4ce9698-fd4d-40cb-934d-51d97807f920-150515170744-lva1-app6891/75/4D-Flow-MRI-19-2048.jpg)
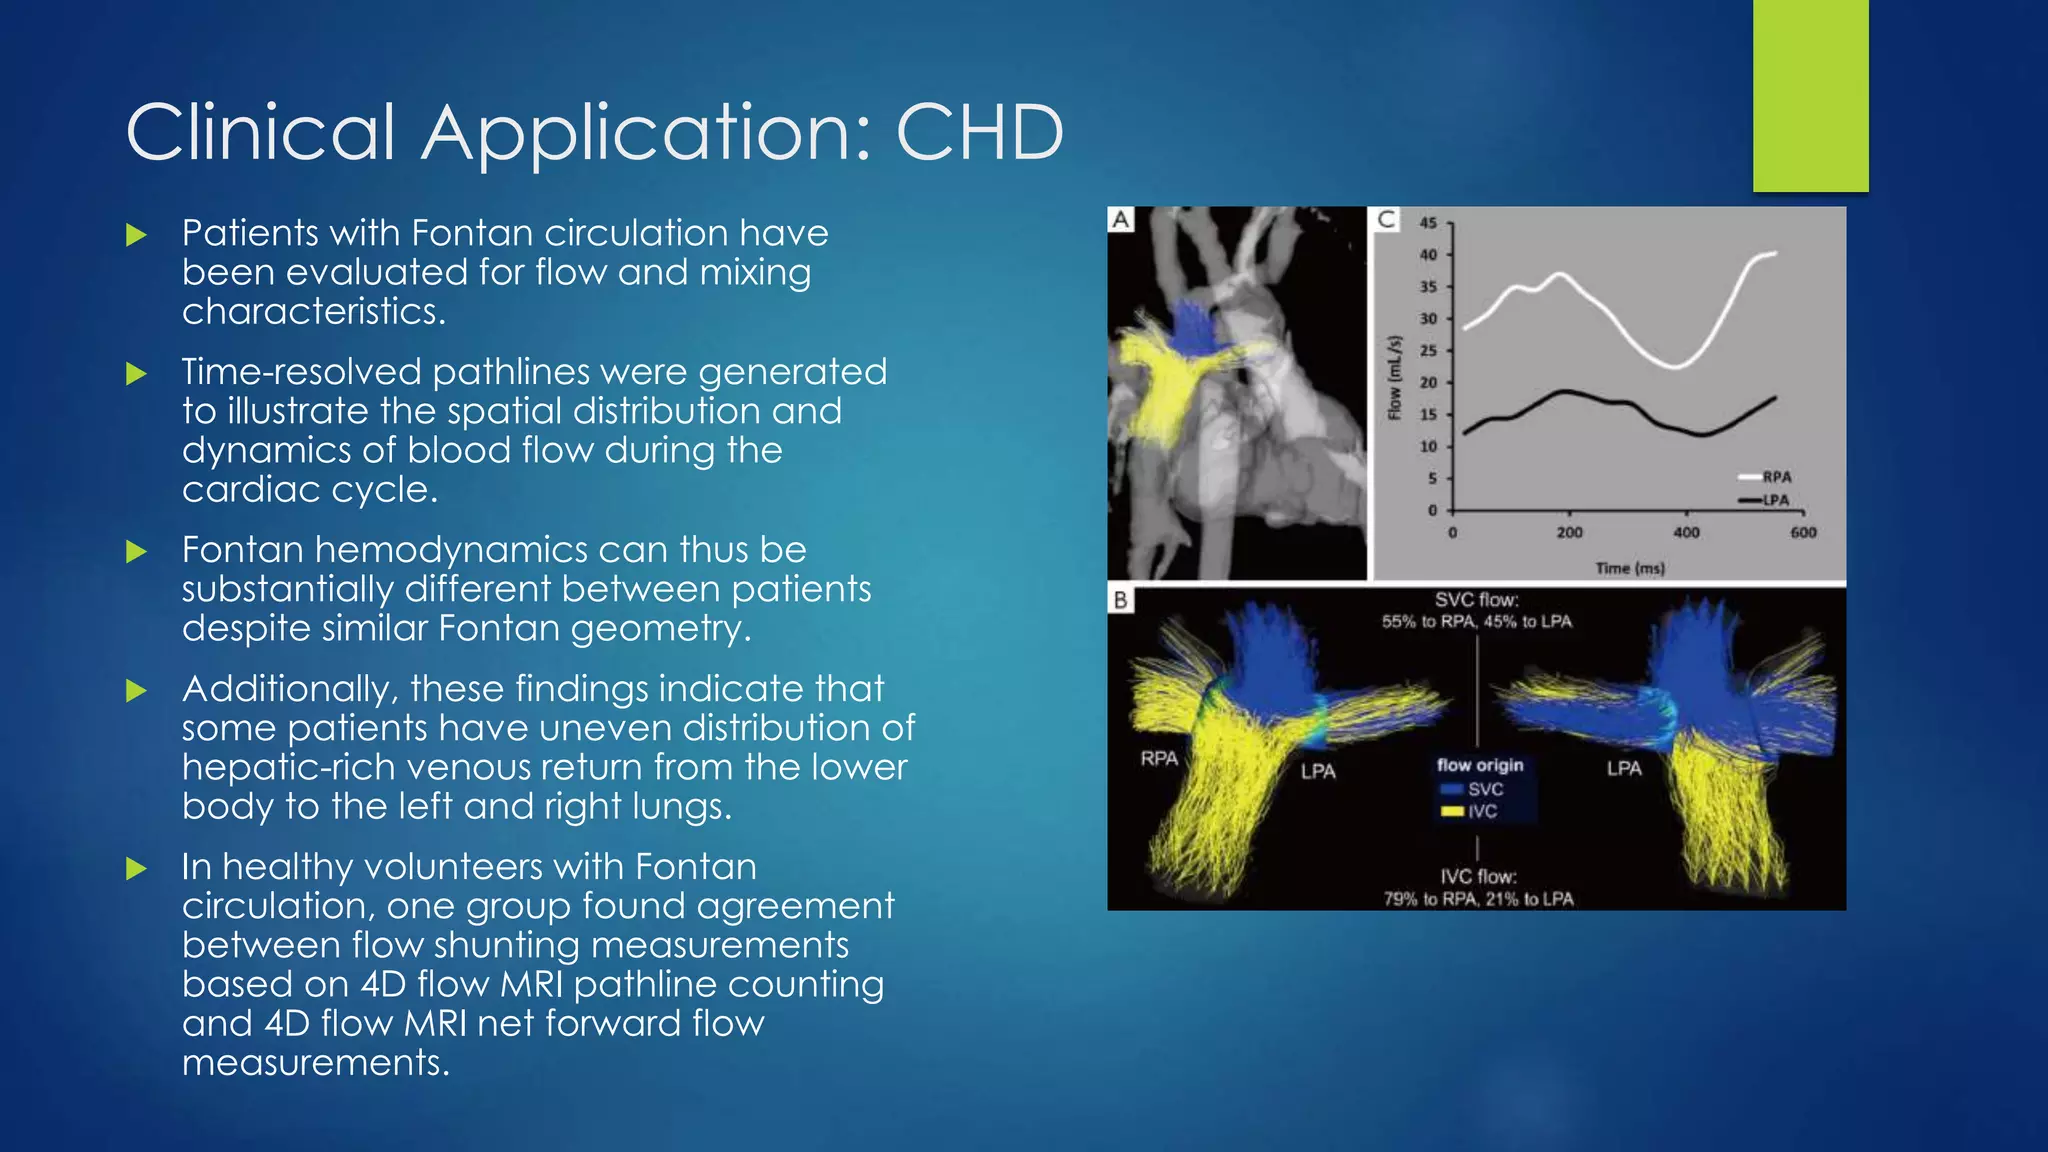
![Clinical Application: CHD
17 year-old female with Tetralogy
of Fallot repaired with
transannular patch at 2 years of
age. Particle trace visualization
during a right ventricular diastolic
time frame demonstrates
pulmonary regurgitation (closed
arrow). The majority of the flow
from the right atrium (RA) into the
RV is directed abnormally toward
the RV apex (curved dashed
arrow) with a smaller vortex just
beyond the tricuspid valve (open
arrow). Color-coding was
achieved with respect to the
absolute acquired velocities. SVC
= superior vena cava; IVC =
inferior vena cava; MPA = main
pulmonary artery; RPA = right
pulmonary artery. [6]
When complex CHD is
suspected, imaging
evaluations provide
clinicians with key
diagnostic and surgical
planning information.
Some patients develop
serious complications
and regular imaging
evaluations are critical
to their follow-up care.](https://image.slidesharecdn.com/c4ce9698-fd4d-40cb-934d-51d97807f920-150515170744-lva1-app6891/75/4D-Flow-MRI-20-2048.jpg)
![Clinical Application: CHD
Estimation of the severity of pulmonary
regurgitation after repair of tetralogy
of Fallot using velocity-encoded cine
MRI. The curve on the right plots
pulmonary arterial flow against ECG-
trigger delay time. The area between
the baseline and the curve below the
baseline represents regurgitant
volume. [5]
• Primary imaging modality for
early evaluation with
complex CHD is ultrasound;
specifically, transthoracic
and transesophageal
echocardiography.
• 4D flow MRI techniques
allow for a non-invasive
comprehensive assessment
of cardiovascular
hemodynamics.
• For this, FOV is adjusted to
contain heart and
surrounding vessels.
• Main advantages, it
facilitates the systematic
assessment of blood flow in
multiple vessels.
• 4D flow MRI has the
potential to predict or
detect complications of
CHD earlier in the disease’s
course.
Tubular hypoplasia of the aortic arch
and coarctation in a 17-year-old
female. Maximal intensity projection
image obtained by contrast-
enhanced MR angiography clearly
shows arch hypoplasia and
coarctation (arrow). This patient also
suffered intracerebral hemorrhage,
probably associated with coarctation.
[5]](https://image.slidesharecdn.com/c4ce9698-fd4d-40cb-934d-51d97807f920-150515170744-lva1-app6891/75/4D-Flow-MRI-21-2048.jpg)
![References:
[1] “Flow.” Magnetic Resonance – Technology Information Portal. Softways 2003. n.d. Web. 4
December 2014.
[2] “Flow Artifact.” Magnetic Resonance – Technology Information Portal. Softways 2003. n.d. Web.
4 December 2014.
[3] “Cardiac Gating.” Magnetic Resonance – Technology Information Portal. Softways 2003. n.d.
Web. 4 December 2014.
[4] Stankovic, Zoran. Allen, Bradley D. Garcia, Julio. Jarvis, Kelly B. Markl, Michael. “4D flow Imaging
with MRI.” The Cardiovascular Diagnosis & Therapy. 21 October 2013. Web. 1 December 2014.
[5] Choe, Yeon Hyeon. Kang, I-Seok. Park, Seung Woo. Lee, Heung Jae. “MR Imaging of
Congenital Heart Disease in Adolescents and Adults.” US National Library of Medicine. National
Institutes of Health. Korean Society of Radiology. 30 September 2001. Web. 1 December 2014.
[6] Geiger, J. Arnold, R. Frydrychowicz, A. Stiller, B. Langer, M. Markl, M. “Whole Heart Flow Sensitive
4D MRI in Congenital Heart Disease.” n.p. n.d. Web. 1 December 2014.](https://image.slidesharecdn.com/c4ce9698-fd4d-40cb-934d-51d97807f920-150515170744-lva1-app6891/75/4D-Flow-MRI-24-2048.jpg)