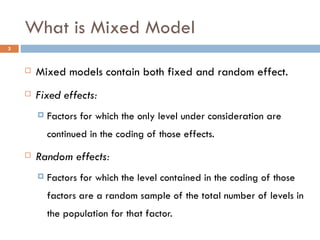
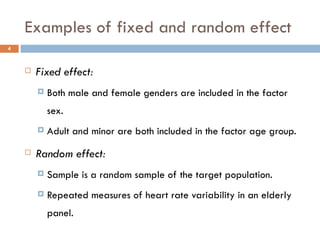
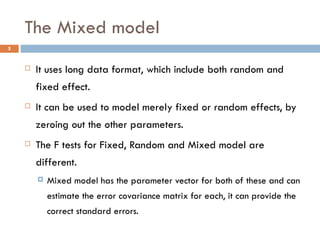
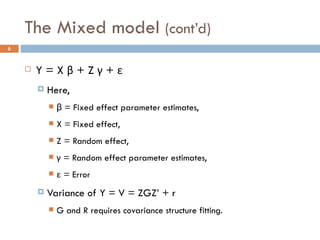
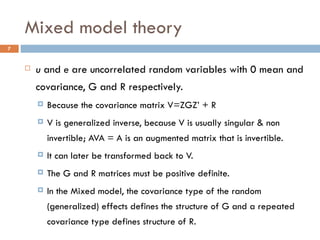
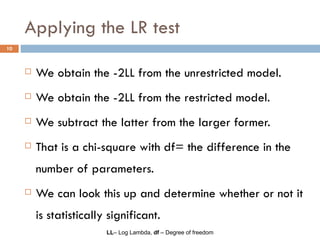
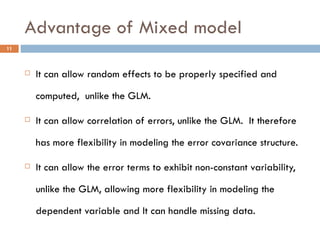
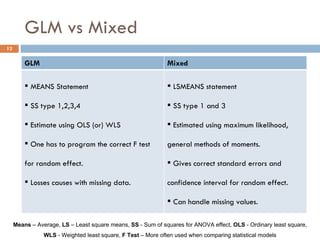
EXPERIMENTAL DESIGN AND COMPUTATIONS MIXED MODEL Presented by Arun N
Mixed model Mixed models were developed first to deal with correlated (Gaussian) model. Application of Mixed model has become an attractive tools to evaluate plants in actual breeding programs of breeding organization. It is important to properly identify which variables should be modeled as random and which as fixed.
What is Mixed Model Mixed models contain both fixed and random effect. Fixed effects: Factors for which the only level under consideration are continued in the coding of those effects. Random effects: Factors for which the level contained in the coding of those factors are a random sample of the total number of levels in the population for that factor.
Examples of fixed and random effect Fixed effect: Both male and female genders are included in the factor sex. Adult and minor are both included in the factor age group. Random effect: Sample is a random sample of the target population. Repeated measures of heart rate variability in an elderly panel.
The Mixed model It uses long data format, which include both random and fixed effect. It can be used to model merely fixed or random effects, by zeroing out the other parameters. The F tests for Fixed, Random and Mixed model are different. Mixed model has the parameter vector for both of these and can estimate the error covariance matrix for each, it can provide the correct standard errors.
The Mixed model  (cont’d) Y = X  β  + Z  γ  +  ε Here, β = Fixed effect parameter estimates, X = Fixed effect, Z = Random effect, γ  = Random effect parameter estimates, ε  = Error Variance of Y = V = ZGZ’ + r G and R requires covariance structure fitting.
Mixed model theory u  and  e  are uncorrelated random variables with 0 mean and covariance, G and R respectively. Because the covariance matrix V=ZGZ’ + R V is generalized inverse, because V is usually singular & non invertible; AVA = A is an augmented matrix that is invertible. It can later be transformed back to V. The G and R matrices must be positive definite. In the Mixed model, the covariance type of the random (generalized) effects defines the structure of G and a repeated covariance type defines structure of R.
Procedure for fitting the mixed model One can use the LR test or the lesser of the information criteria.  The smaller the information criterion, the better the model happens to be. We try to go from a larger to a smaller information criterion when we fit the model.
LR Test To test whether one model is significantly better than the other. To test random effect for statistical significance. To test covariance structure improvement. LR Test  – Likelihood ratio
Applying the LR test We obtain the -2LL from the unrestricted model.  We obtain the -2LL from the restricted model. We subtract the latter from the larger former. That is a chi-square with df= the difference in the number of parameters. We can look this up and determine whether or not it is statistically significant. LL – Log Lambda,  df  – Degree of freedom
Advantage of Mixed model It can allow random effects to be properly specified and computed,  unlike the GLM. It can allow correlation of errors, unlike the GLM.  It therefore has more flexibility in modeling the error covariance structure. It can allow the error terms to exhibit non-constant variability, unlike the GLM, allowing more flexibility in modeling the dependent variable and It can handle missing data.
GLM vs Mixed Means  – Average,  LS  – Least square means,  SS  - Sum of squares for ANOVA effect,  OLS  - Ordinary least square,  WLS  - Weighted least square,  F Test  – More often used when comparing statistical models GLM Mixed MEANS Statement SS type 1,2,3,4 Estimate using OLS (or) WLS One has to program the correct F test for random effect. Losses causes with missing data. LSMEANS statement SS type 1 and 3 Estimated using maximum likelihood, general methods of moments. Gives correct standard errors and confidence interval for random effect. Can handle missing values.
References Thank you   Dallas E. Johnson, Kansas State University, Manhattan, KS. An Introduction to the Analysis of Mixed Models,  Statistics and Data Analysis.  28:253 Raudenbush, S. W. & A. S. Bryk. 2002. Hierarchical Linear Models: Applications and Data Analysis Methods. 2nd ed. Thousand Oaks CA: Sage. Hedeker, D. (1999). MIXNO: a computer program for mixed-effects nominal logistic regression,  Journal of Statistical Software  4(5), 1–92. Brenton R. Clarke (2008), Linear Models : The theory and application of analysis of variance. Wiley Series in probability and statistics.

Mixed models

  • 1.
    EXPERIMENTAL DESIGN ANDCOMPUTATIONS MIXED MODEL Presented by Arun N
  • 2.
    Mixed model Mixedmodels were developed first to deal with correlated (Gaussian) model. Application of Mixed model has become an attractive tools to evaluate plants in actual breeding programs of breeding organization. It is important to properly identify which variables should be modeled as random and which as fixed.
  • 3.
    What is MixedModel Mixed models contain both fixed and random effect. Fixed effects: Factors for which the only level under consideration are continued in the coding of those effects. Random effects: Factors for which the level contained in the coding of those factors are a random sample of the total number of levels in the population for that factor.
  • 4.
    Examples of fixedand random effect Fixed effect: Both male and female genders are included in the factor sex. Adult and minor are both included in the factor age group. Random effect: Sample is a random sample of the target population. Repeated measures of heart rate variability in an elderly panel.
  • 5.
    The Mixed modelIt uses long data format, which include both random and fixed effect. It can be used to model merely fixed or random effects, by zeroing out the other parameters. The F tests for Fixed, Random and Mixed model are different. Mixed model has the parameter vector for both of these and can estimate the error covariance matrix for each, it can provide the correct standard errors.
  • 6.
    The Mixed model (cont’d) Y = X β + Z γ + ε Here, β = Fixed effect parameter estimates, X = Fixed effect, Z = Random effect, γ = Random effect parameter estimates, ε = Error Variance of Y = V = ZGZ’ + r G and R requires covariance structure fitting.
  • 7.
    Mixed model theoryu and e are uncorrelated random variables with 0 mean and covariance, G and R respectively. Because the covariance matrix V=ZGZ’ + R V is generalized inverse, because V is usually singular & non invertible; AVA = A is an augmented matrix that is invertible. It can later be transformed back to V. The G and R matrices must be positive definite. In the Mixed model, the covariance type of the random (generalized) effects defines the structure of G and a repeated covariance type defines structure of R.
  • 8.
    Procedure for fittingthe mixed model One can use the LR test or the lesser of the information criteria. The smaller the information criterion, the better the model happens to be. We try to go from a larger to a smaller information criterion when we fit the model.
  • 9.
    LR Test Totest whether one model is significantly better than the other. To test random effect for statistical significance. To test covariance structure improvement. LR Test – Likelihood ratio
  • 10.
    Applying the LRtest We obtain the -2LL from the unrestricted model. We obtain the -2LL from the restricted model. We subtract the latter from the larger former. That is a chi-square with df= the difference in the number of parameters. We can look this up and determine whether or not it is statistically significant. LL – Log Lambda, df – Degree of freedom
  • 11.
    Advantage of Mixedmodel It can allow random effects to be properly specified and computed, unlike the GLM. It can allow correlation of errors, unlike the GLM. It therefore has more flexibility in modeling the error covariance structure. It can allow the error terms to exhibit non-constant variability, unlike the GLM, allowing more flexibility in modeling the dependent variable and It can handle missing data.
  • 12.
    GLM vs MixedMeans – Average, LS – Least square means, SS - Sum of squares for ANOVA effect, OLS - Ordinary least square, WLS - Weighted least square, F Test – More often used when comparing statistical models GLM Mixed MEANS Statement SS type 1,2,3,4 Estimate using OLS (or) WLS One has to program the correct F test for random effect. Losses causes with missing data. LSMEANS statement SS type 1 and 3 Estimated using maximum likelihood, general methods of moments. Gives correct standard errors and confidence interval for random effect. Can handle missing values.
  • 13.
    References Thank you  Dallas E. Johnson, Kansas State University, Manhattan, KS. An Introduction to the Analysis of Mixed Models, Statistics and Data Analysis. 28:253 Raudenbush, S. W. & A. S. Bryk. 2002. Hierarchical Linear Models: Applications and Data Analysis Methods. 2nd ed. Thousand Oaks CA: Sage. Hedeker, D. (1999). MIXNO: a computer program for mixed-effects nominal logistic regression, Journal of Statistical Software 4(5), 1–92. Brenton R. Clarke (2008), Linear Models : The theory and application of analysis of variance. Wiley Series in probability and statistics.