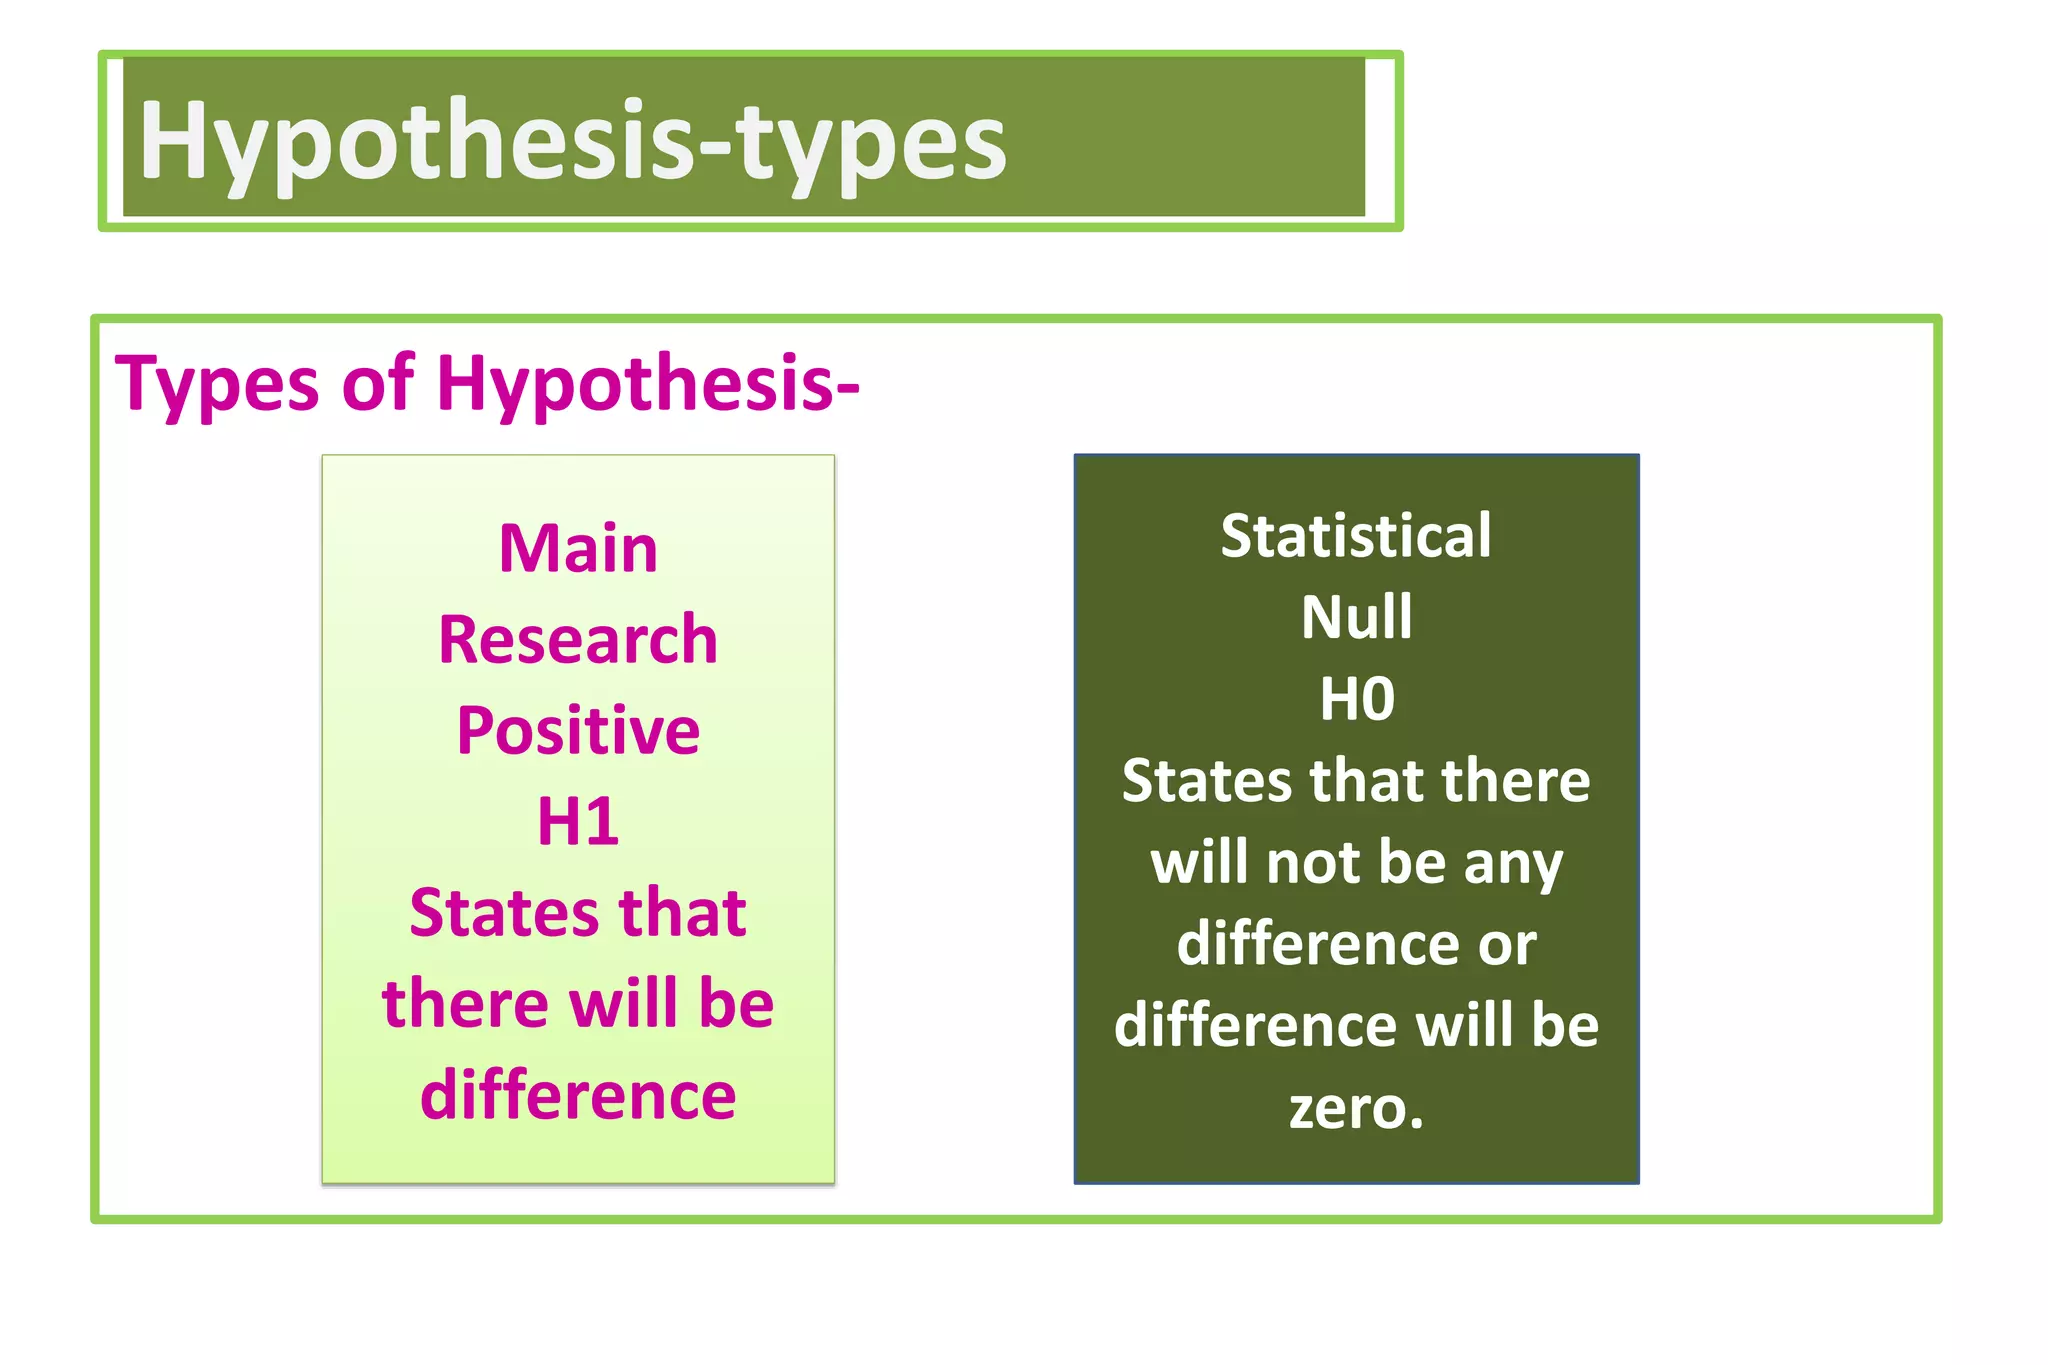
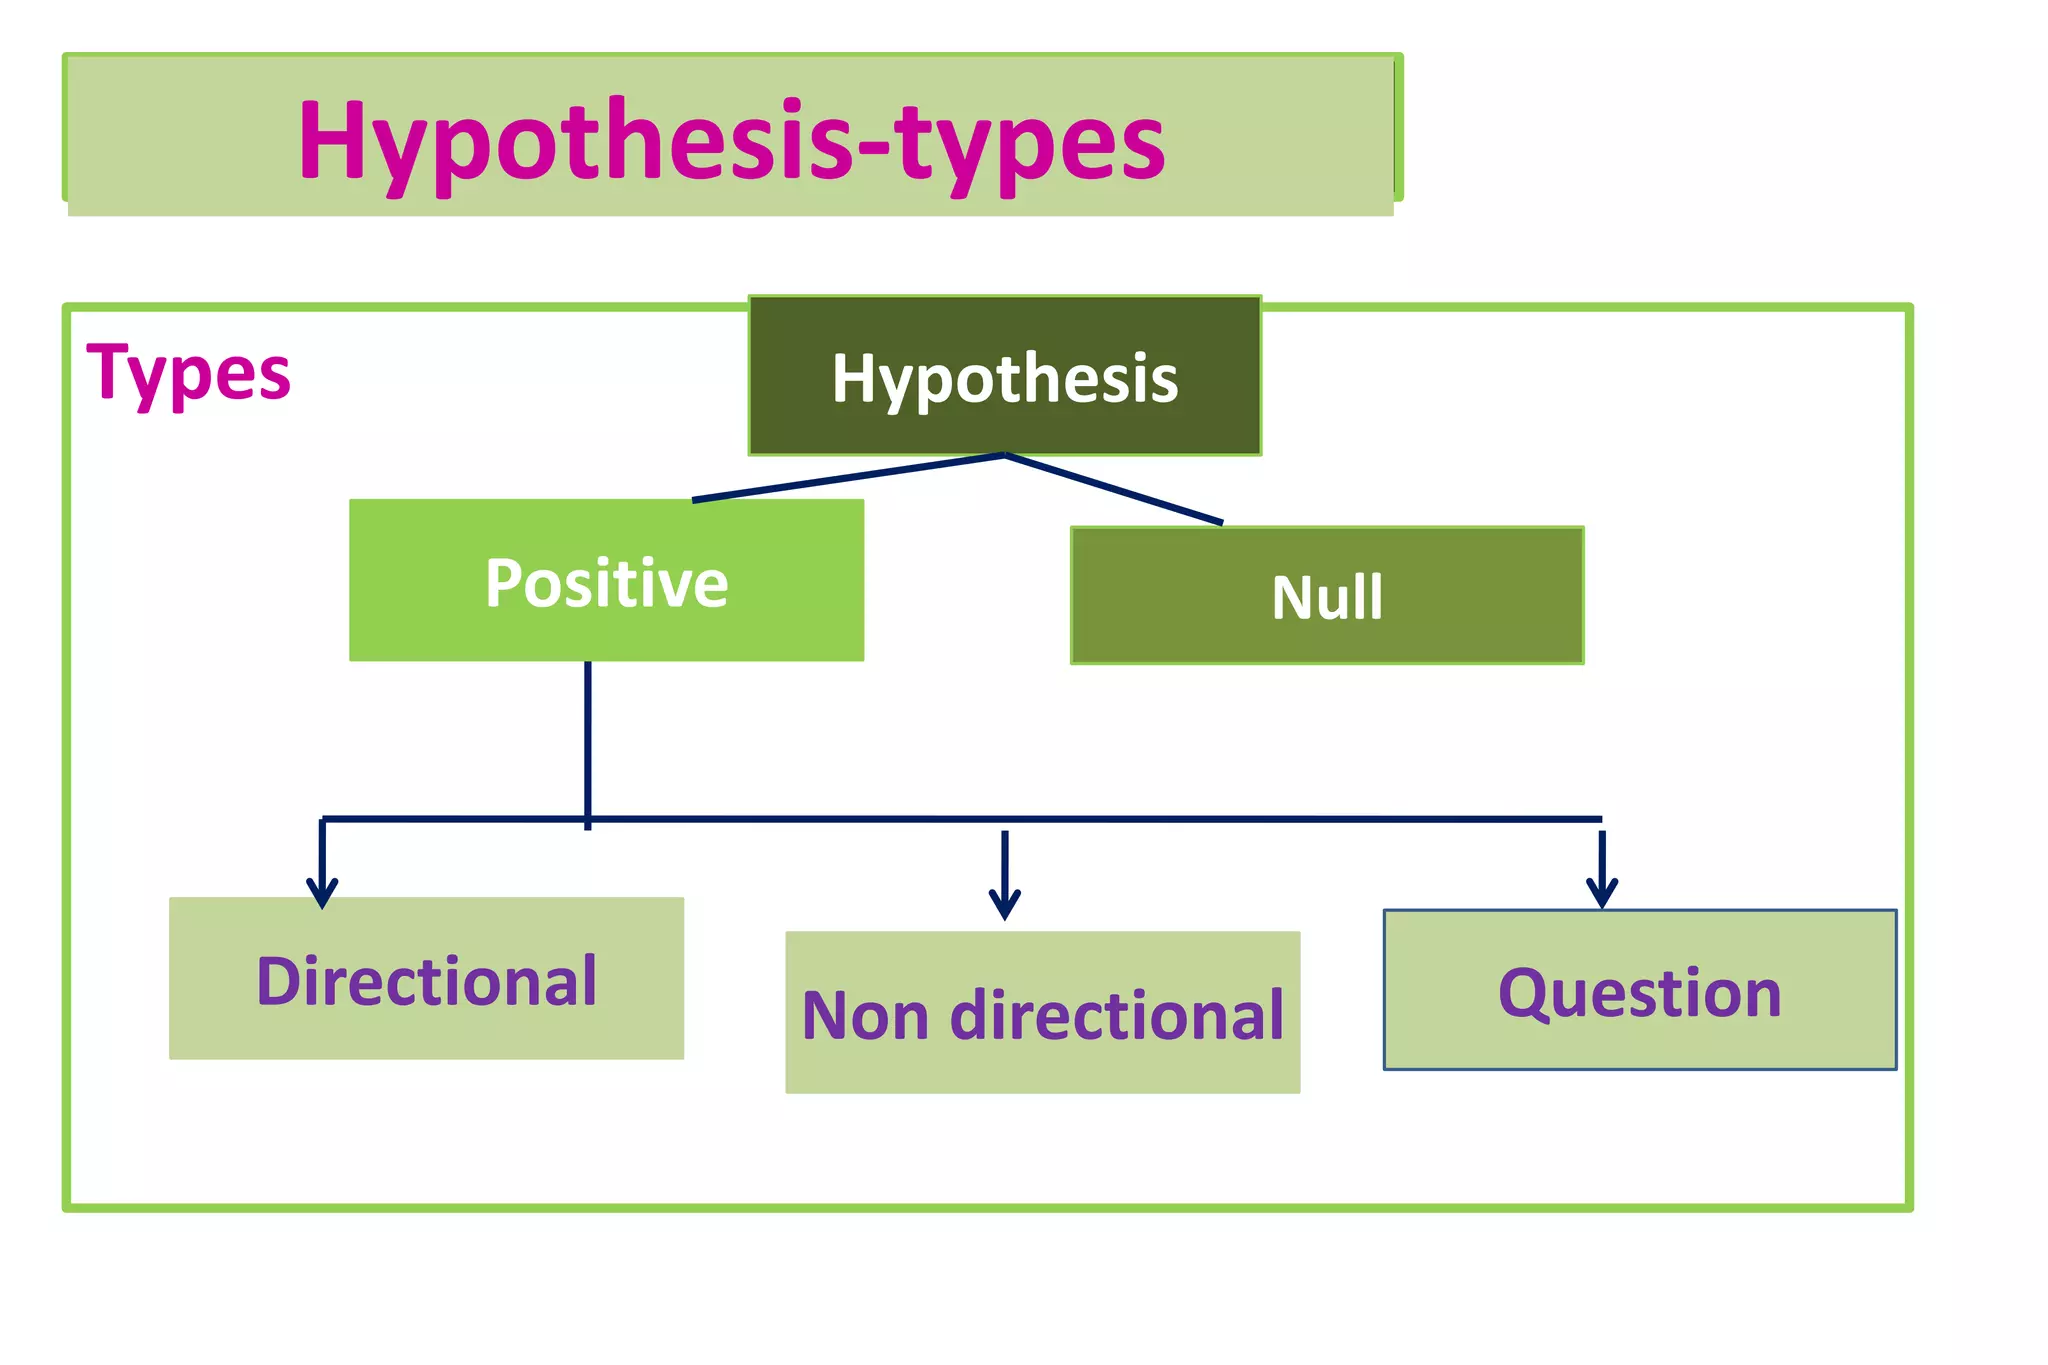
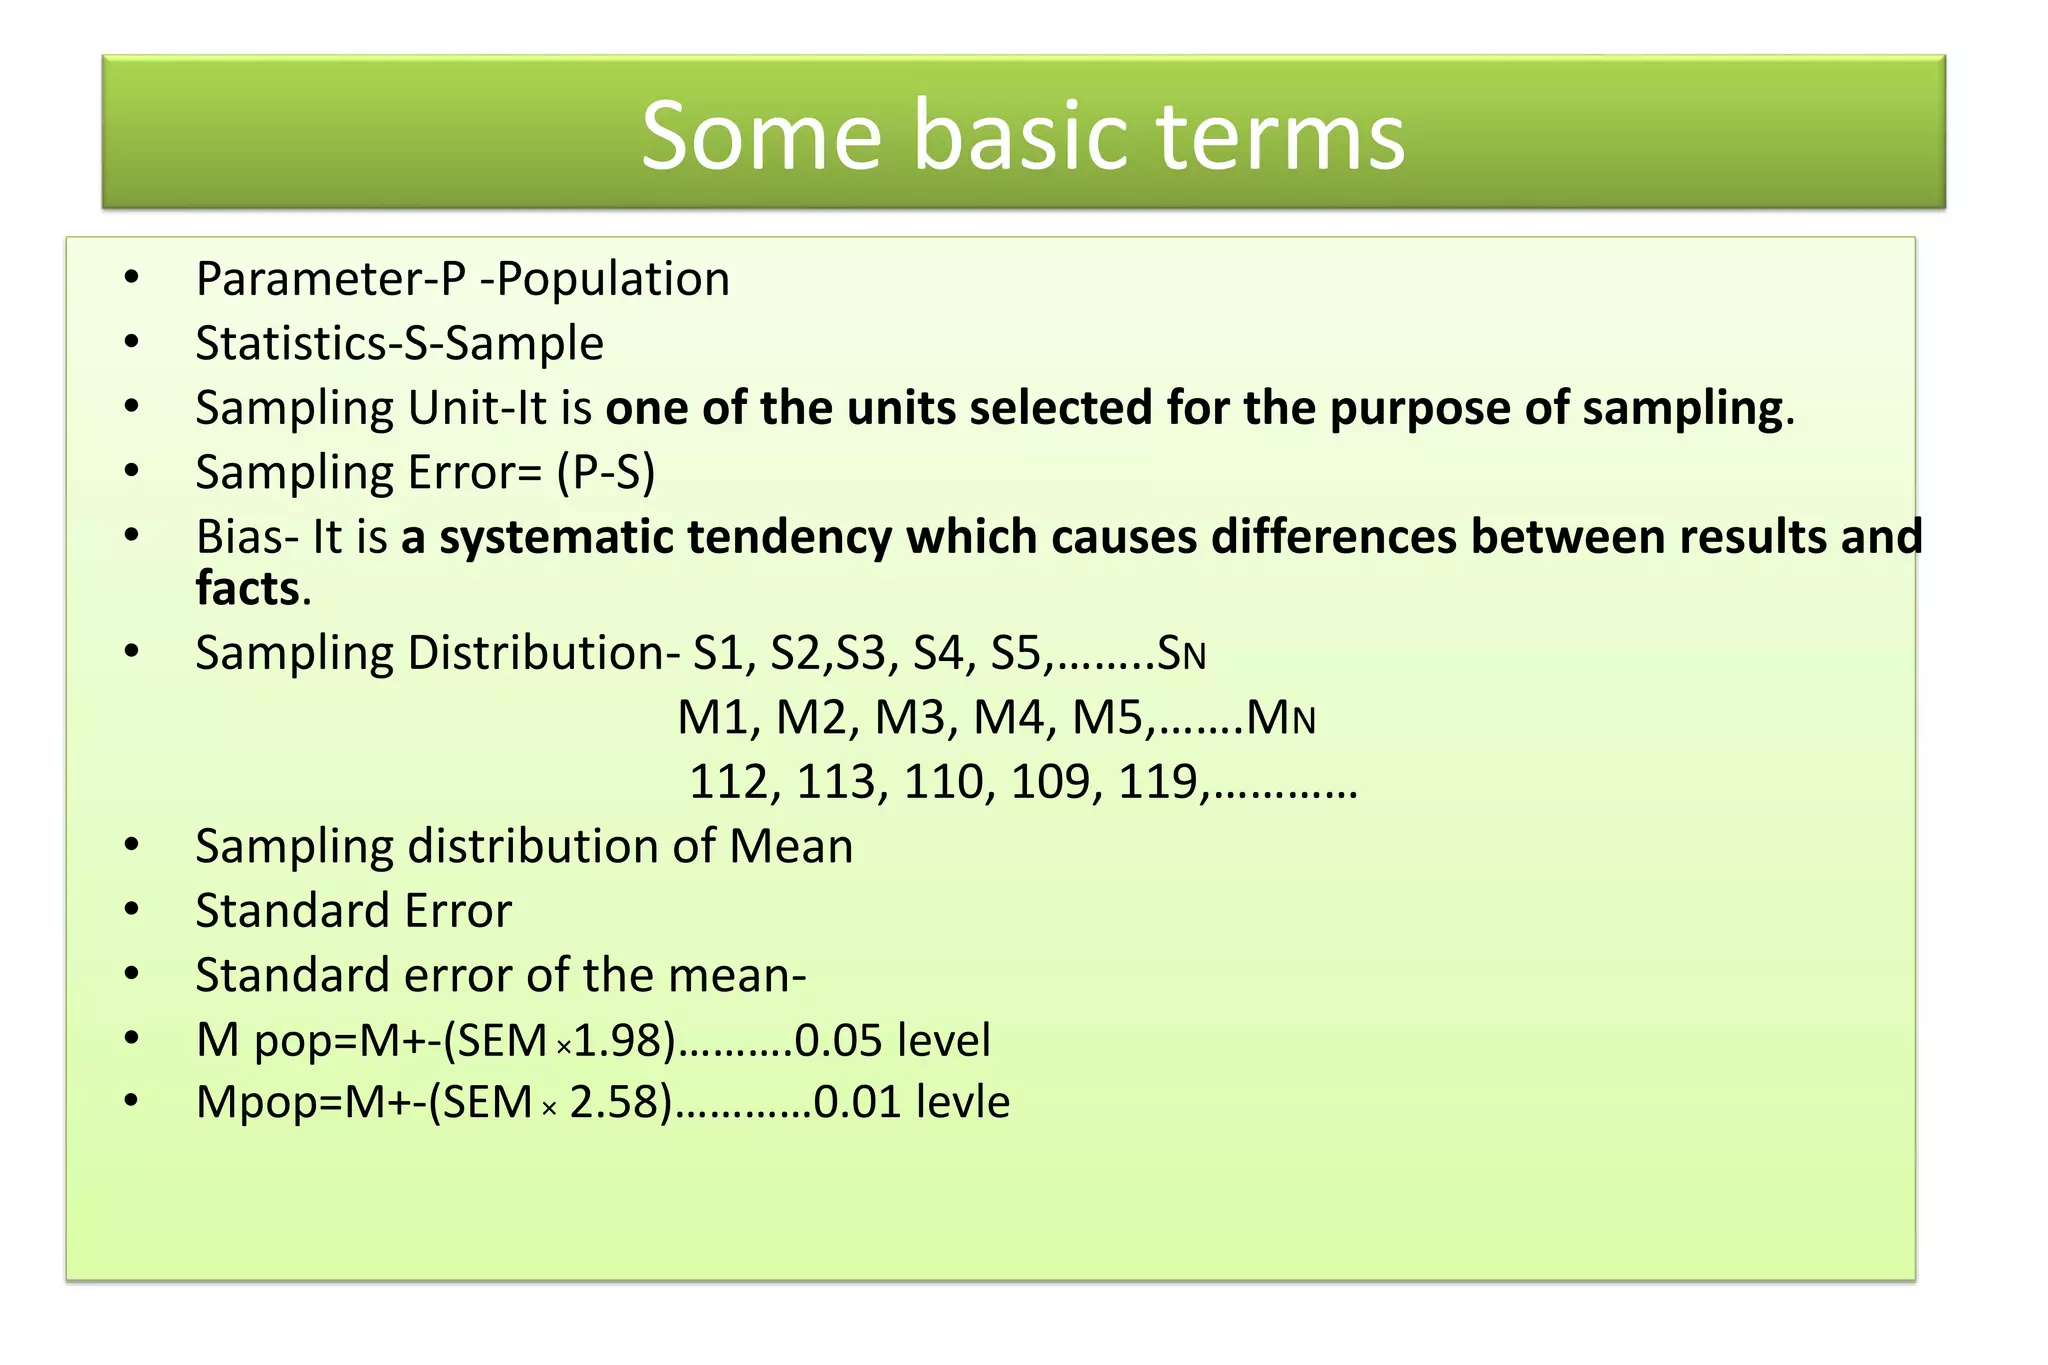
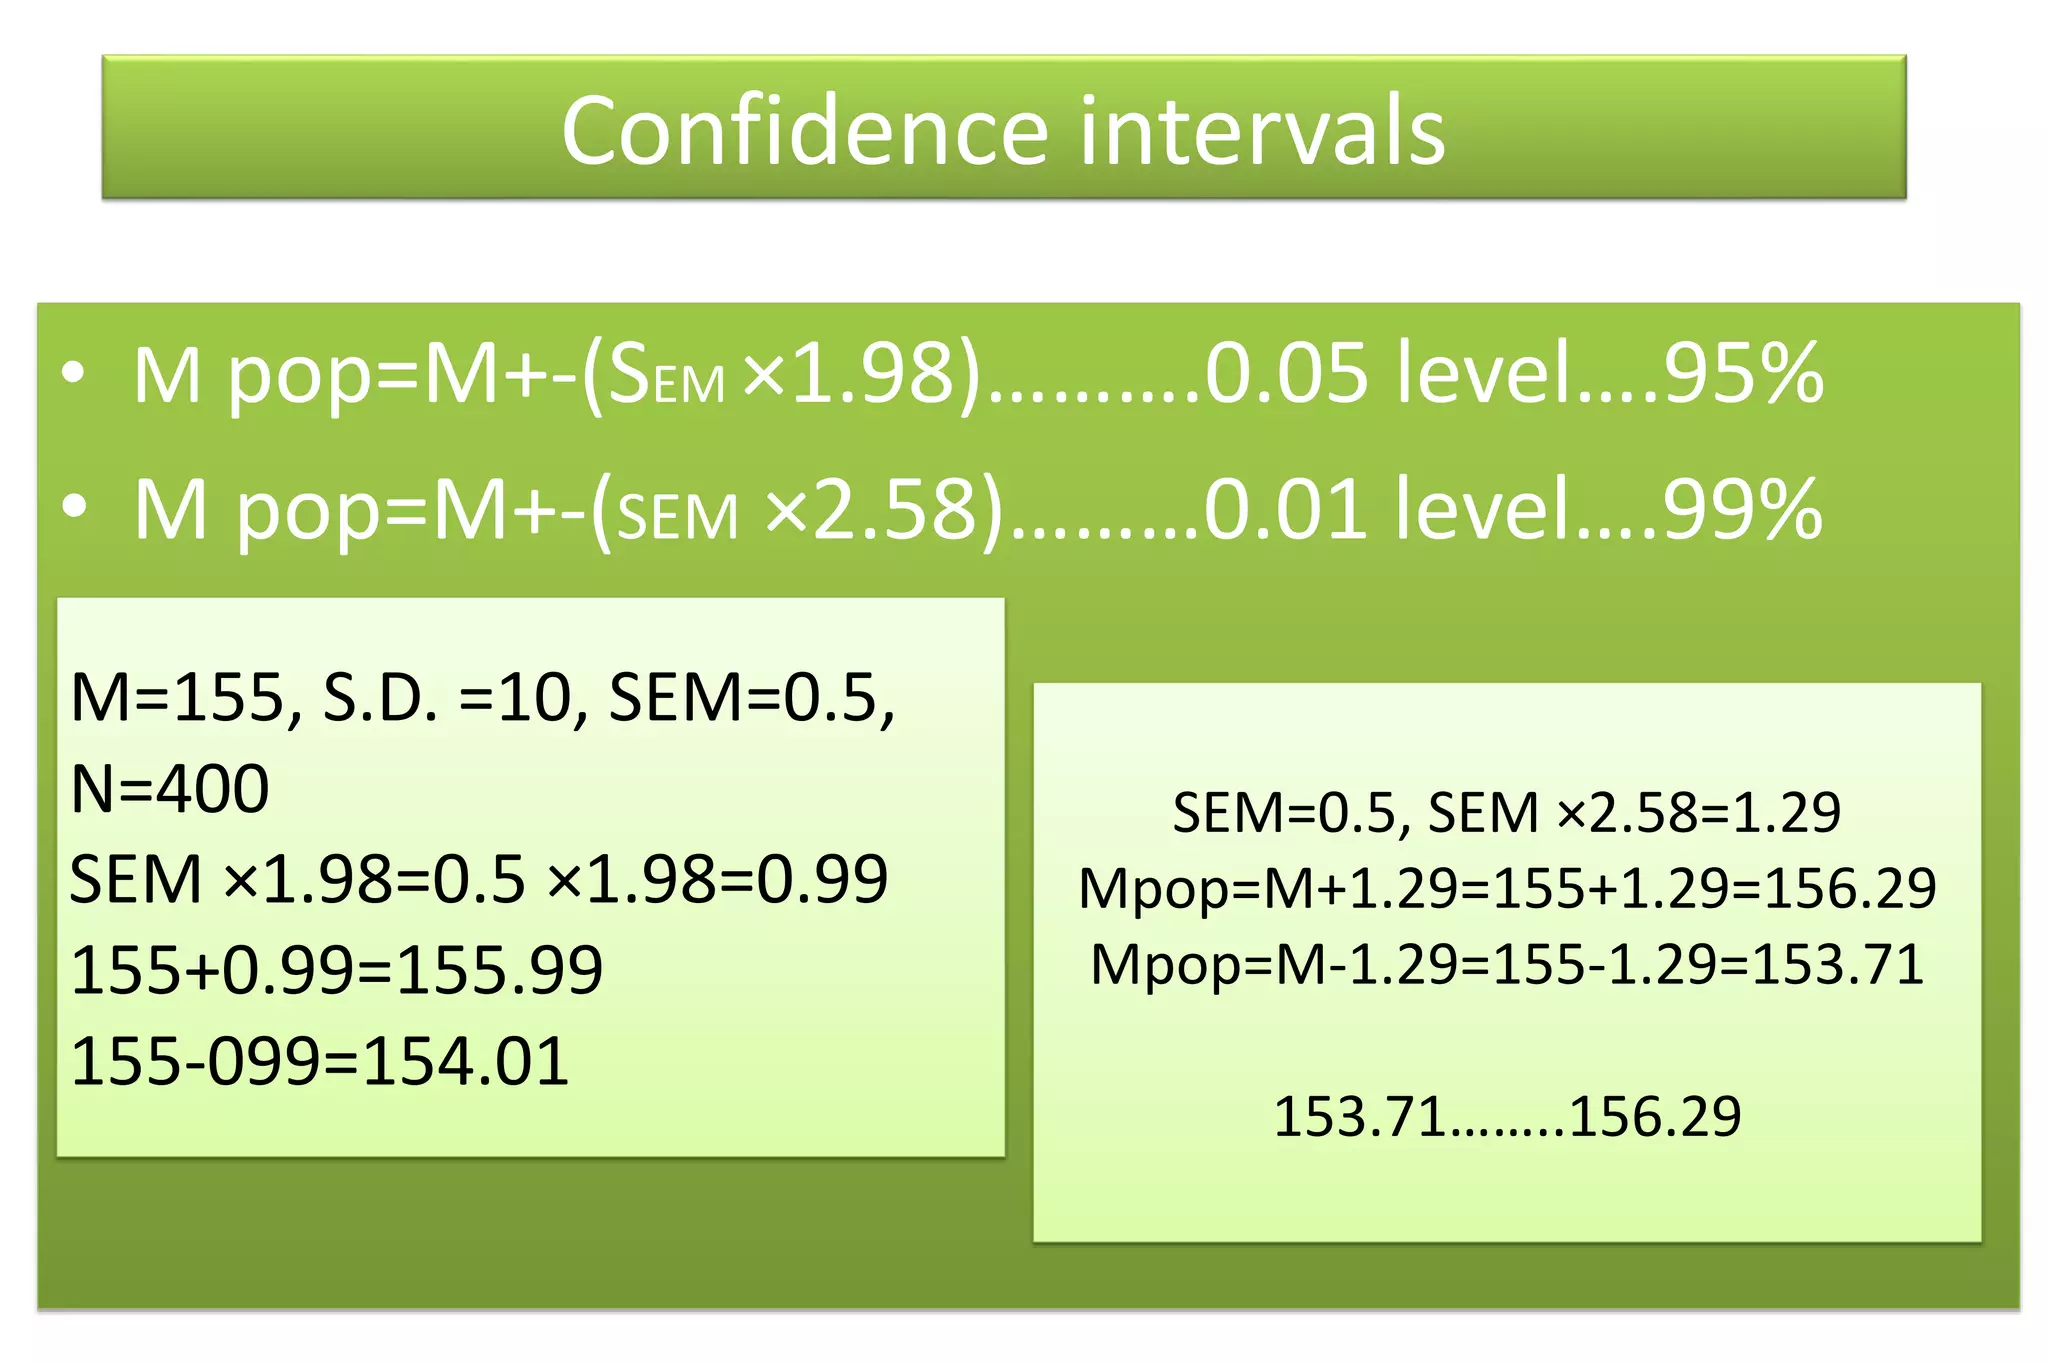
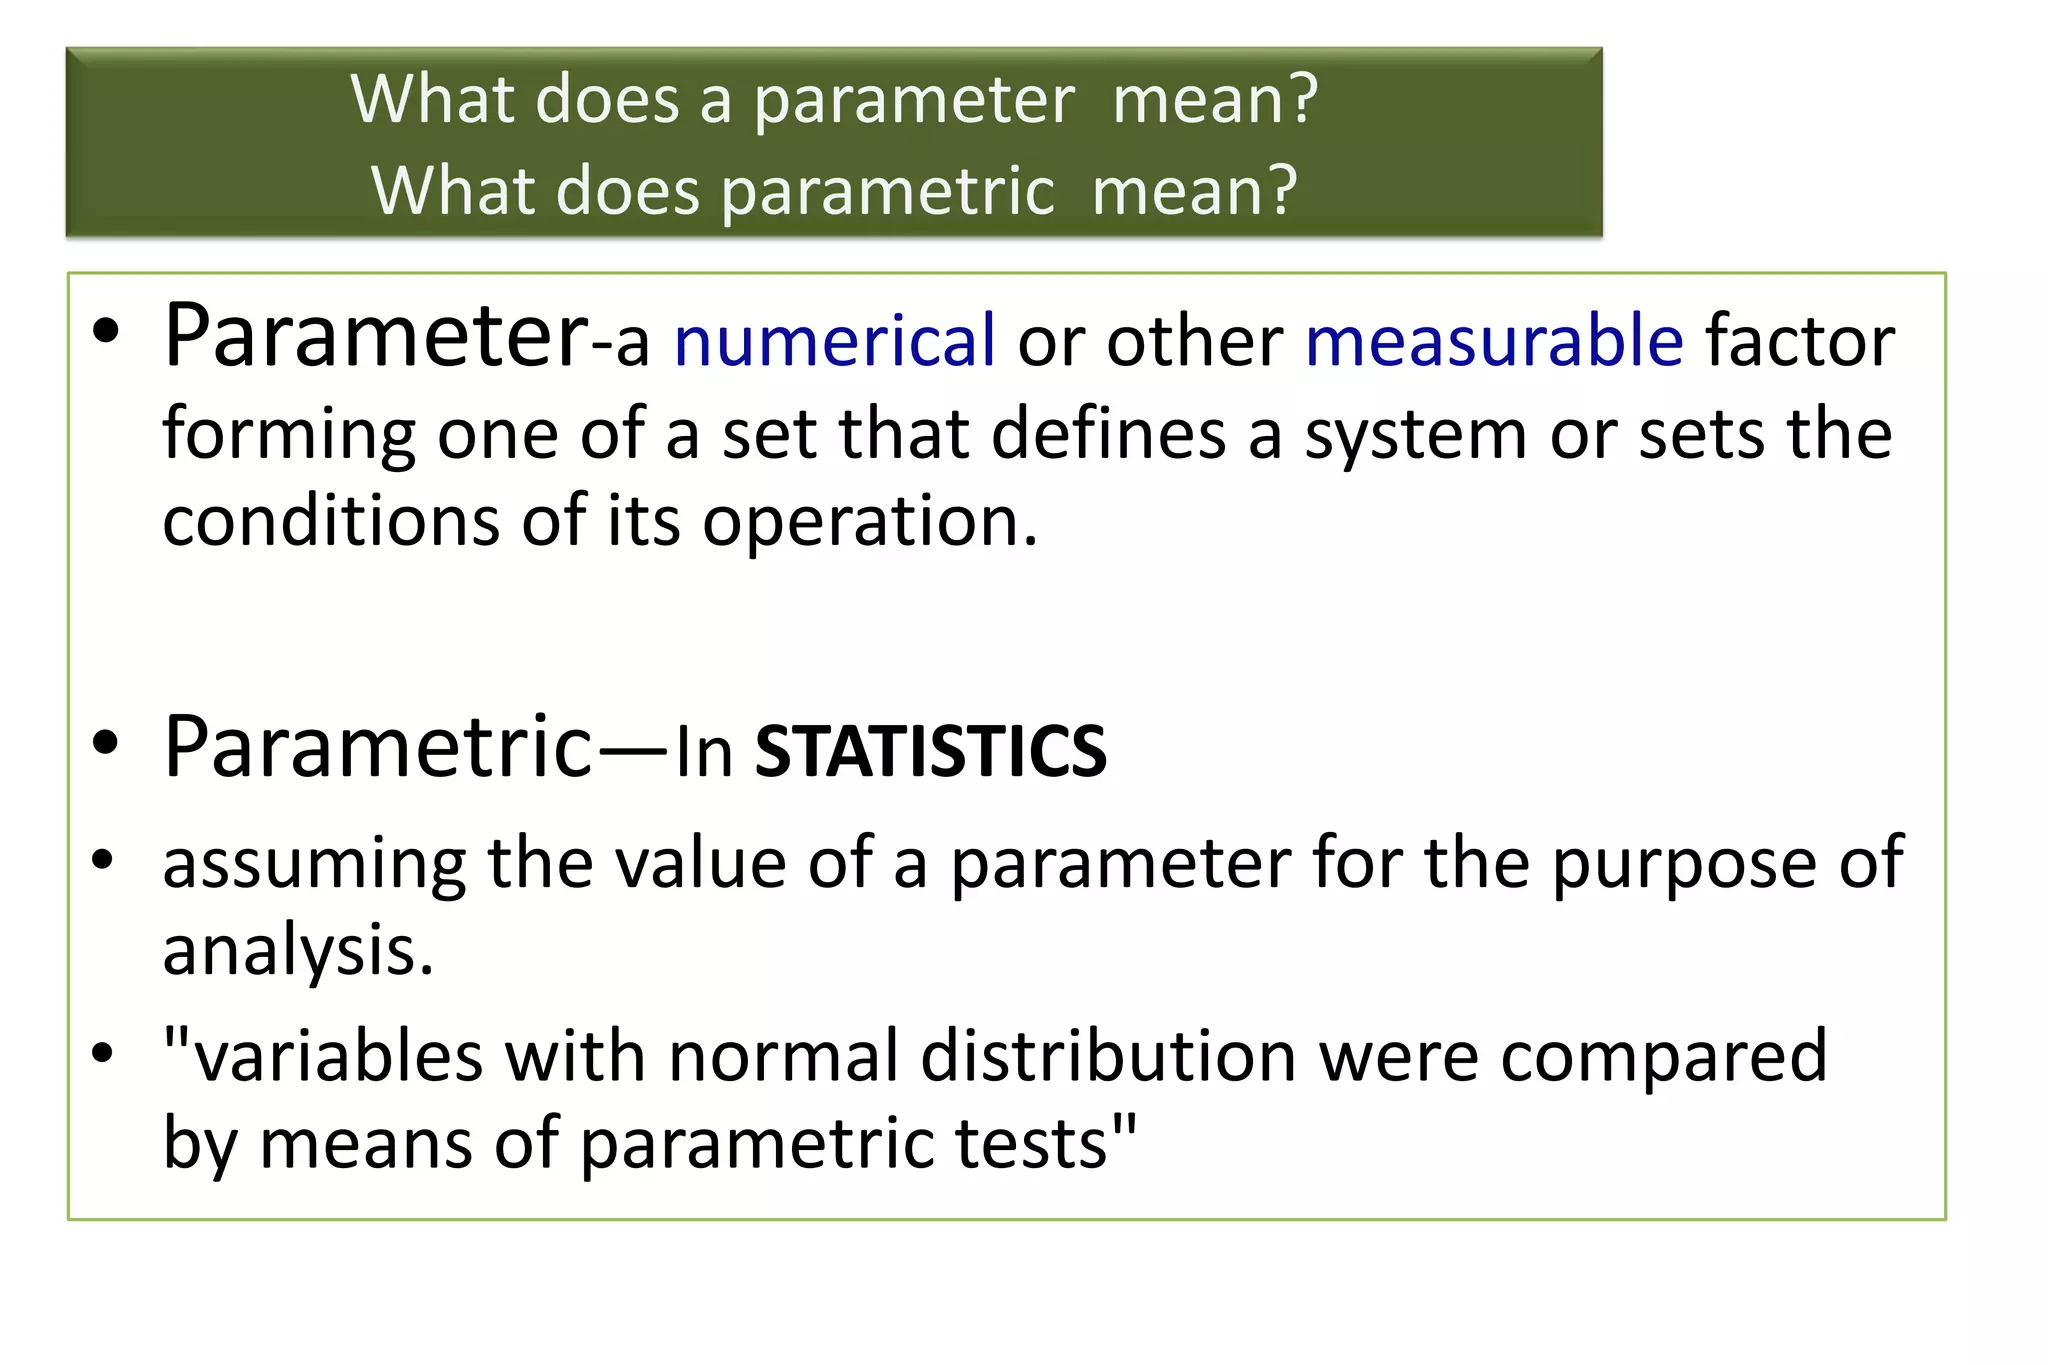
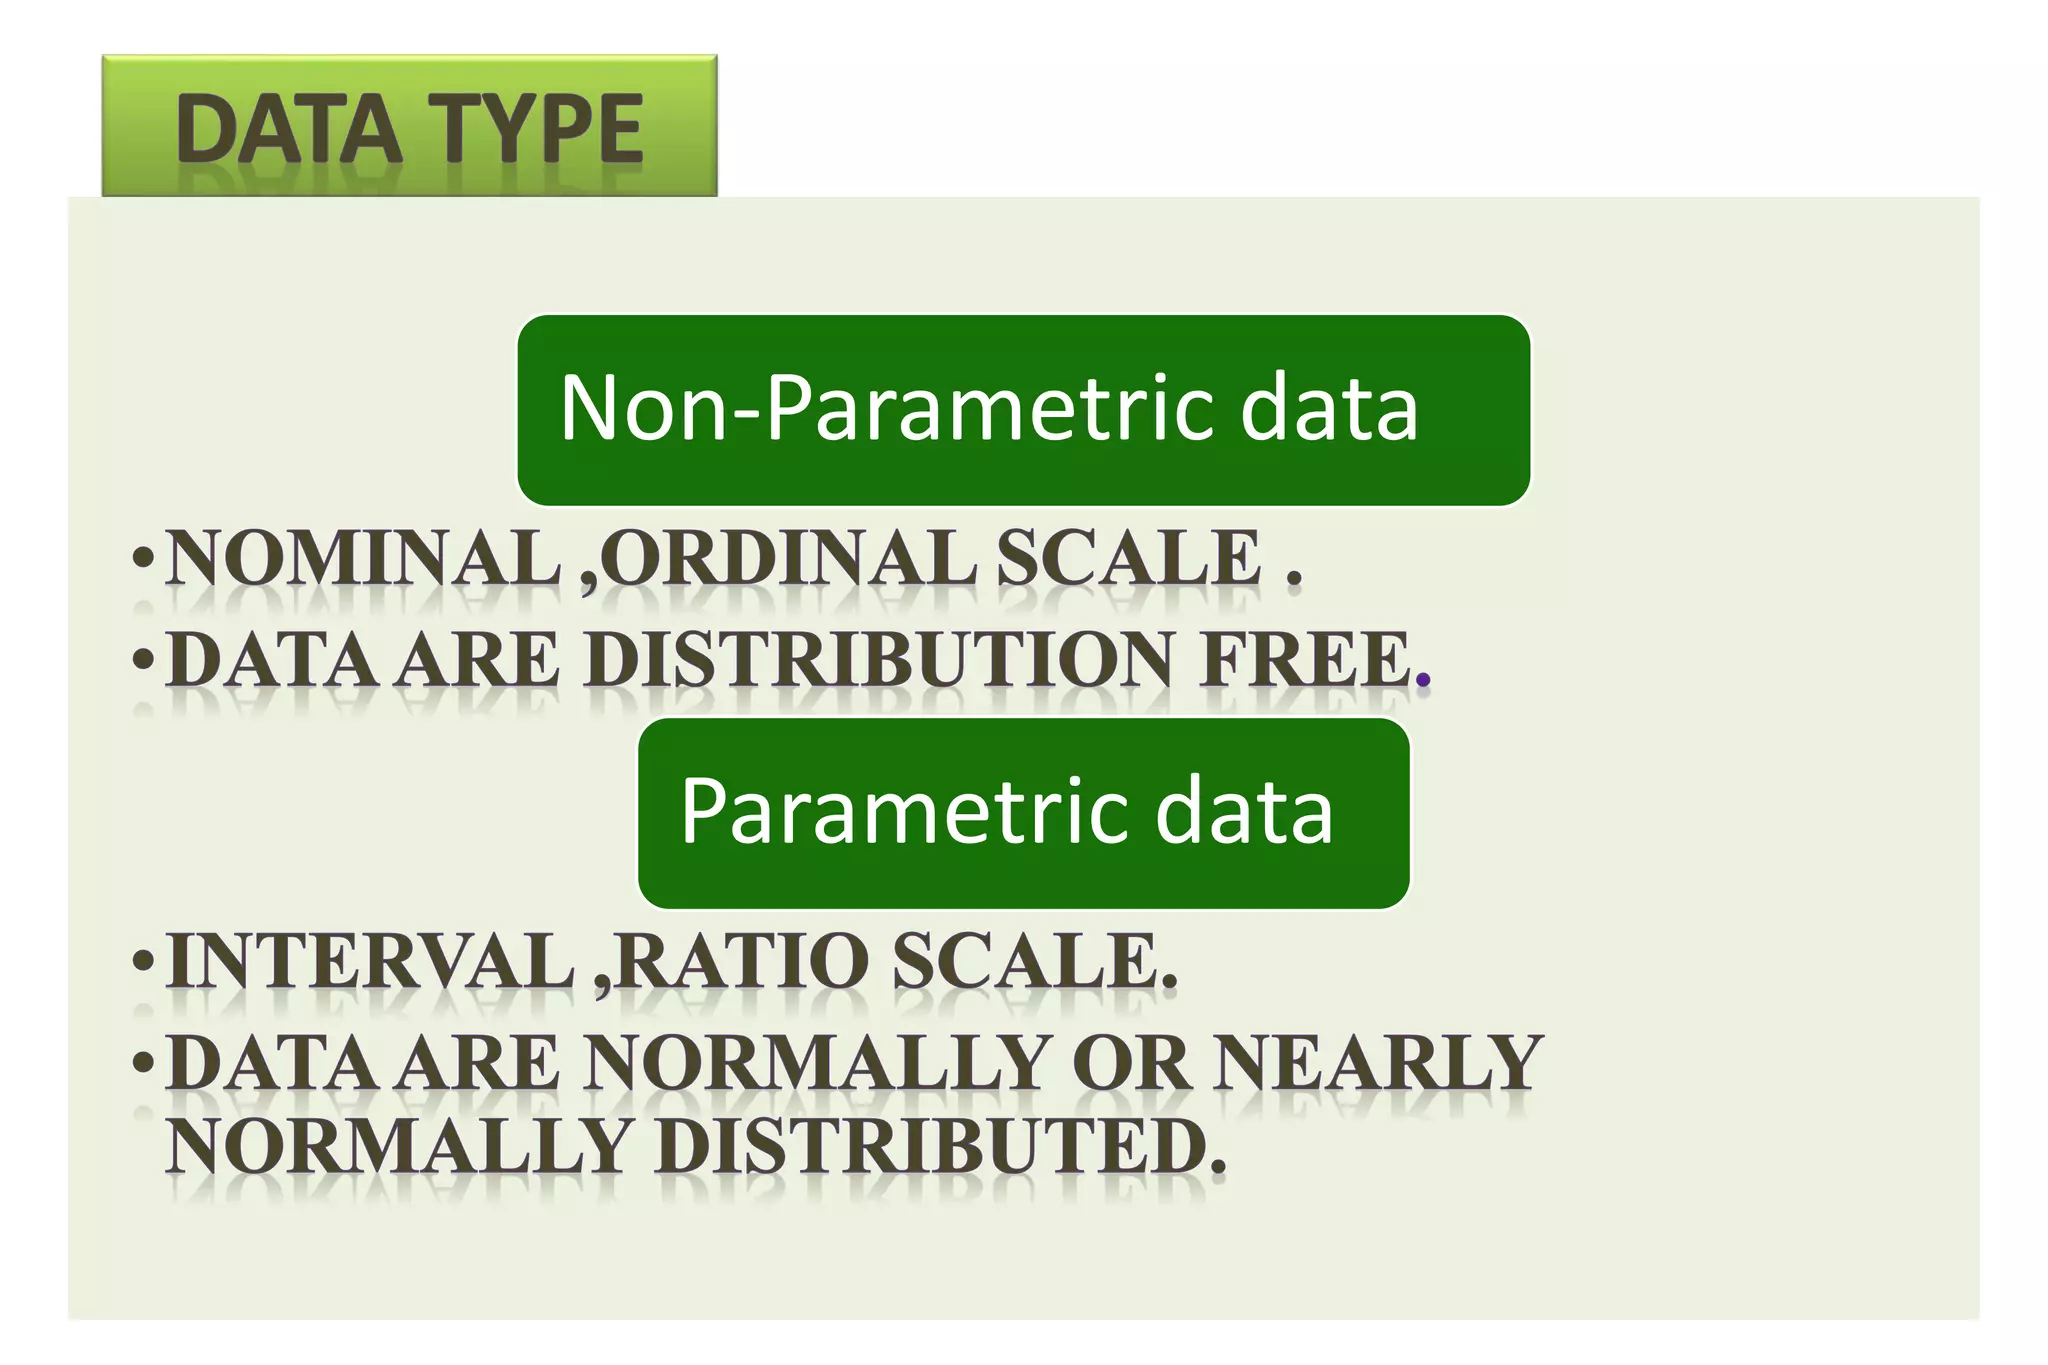
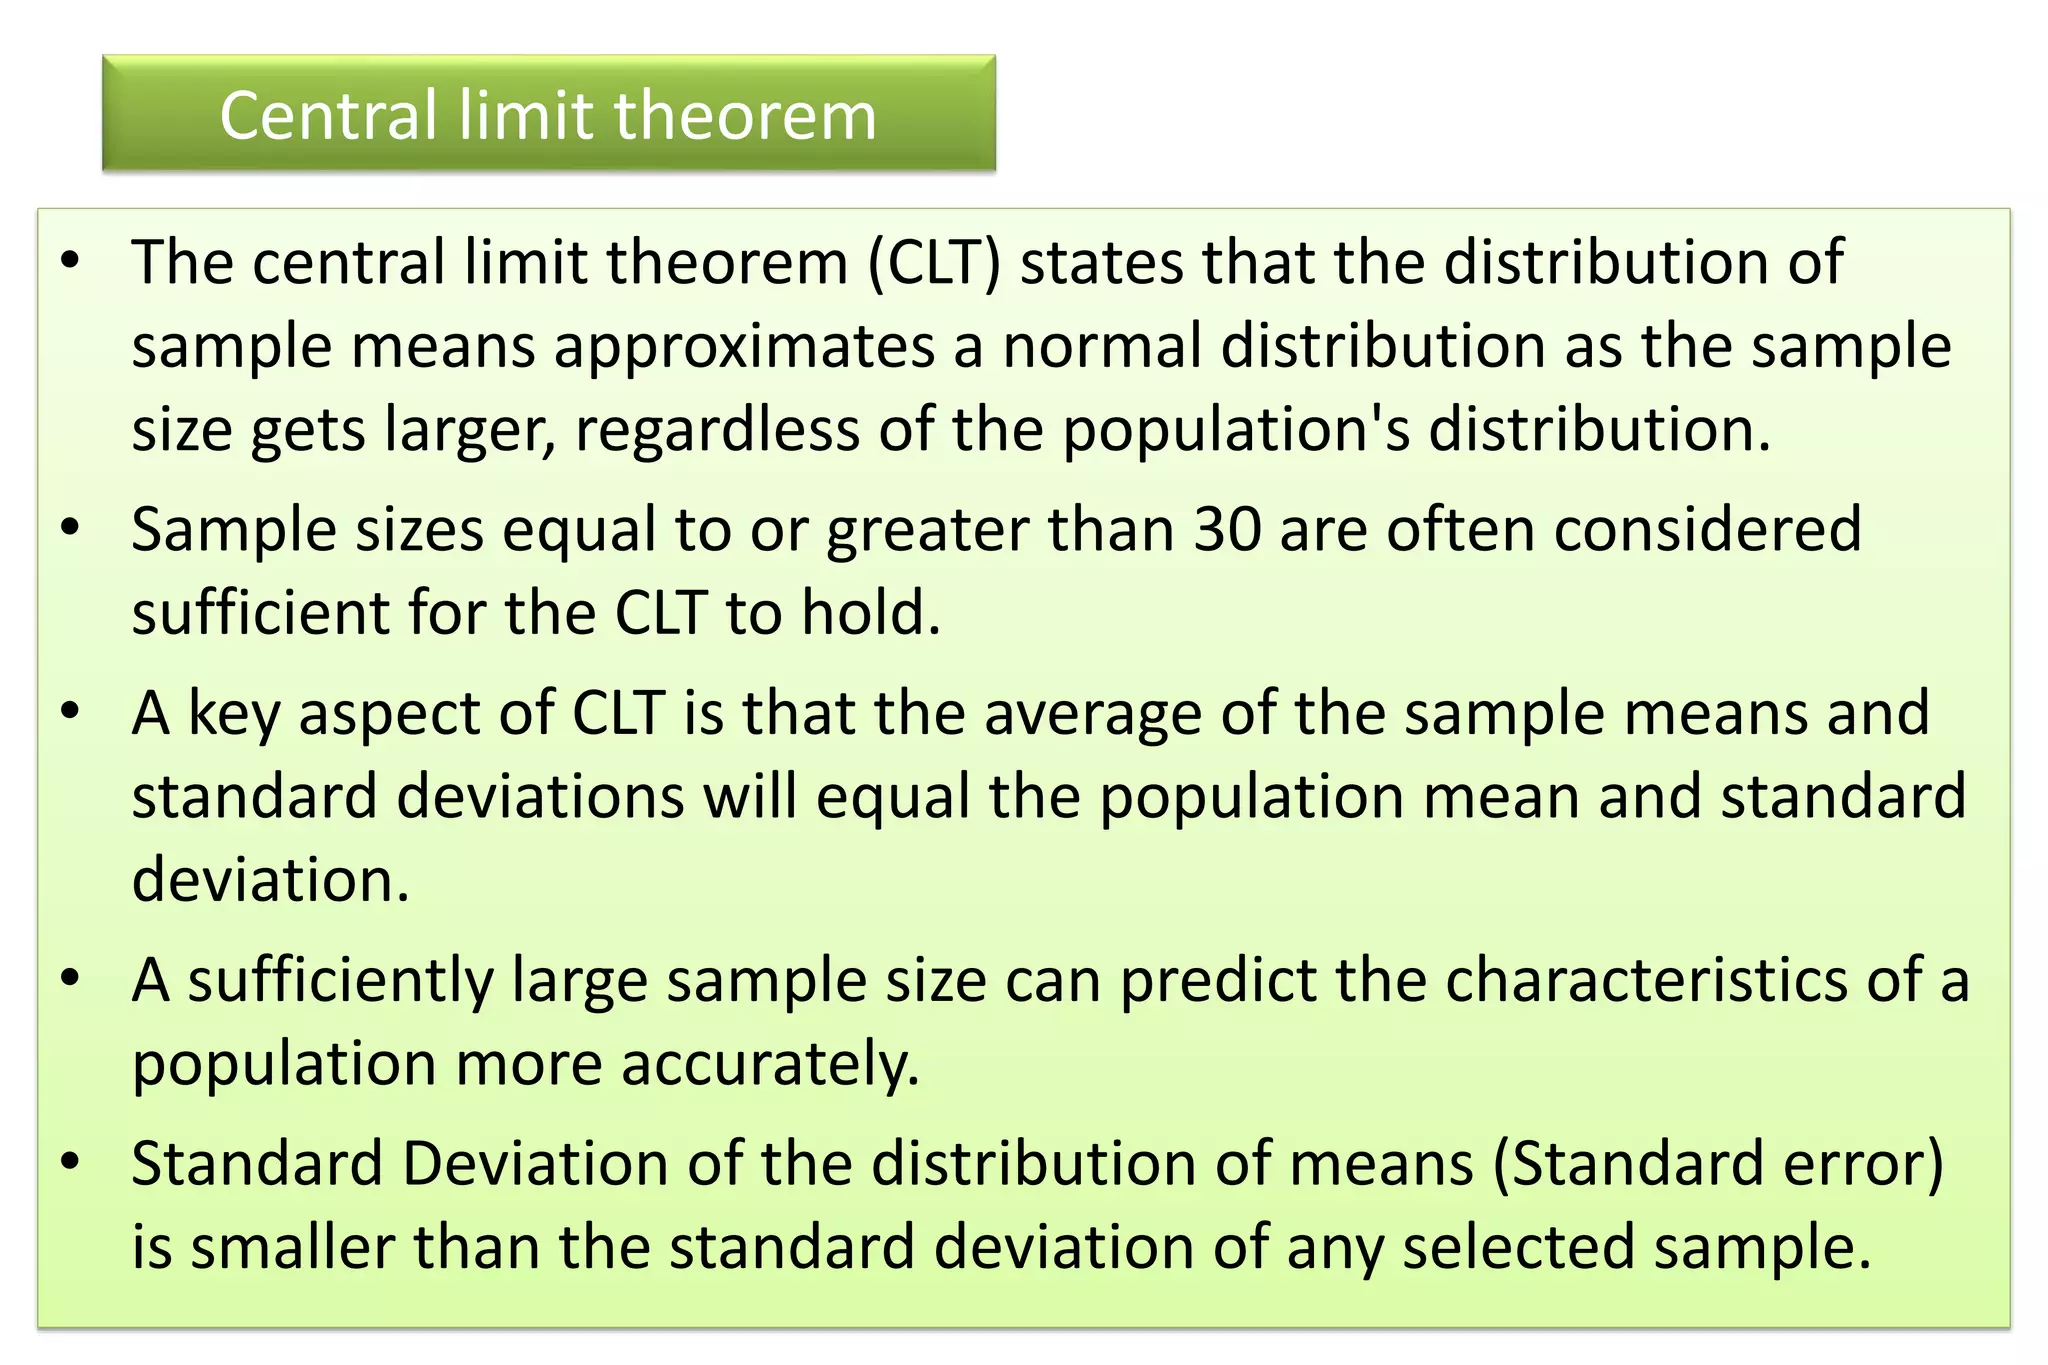
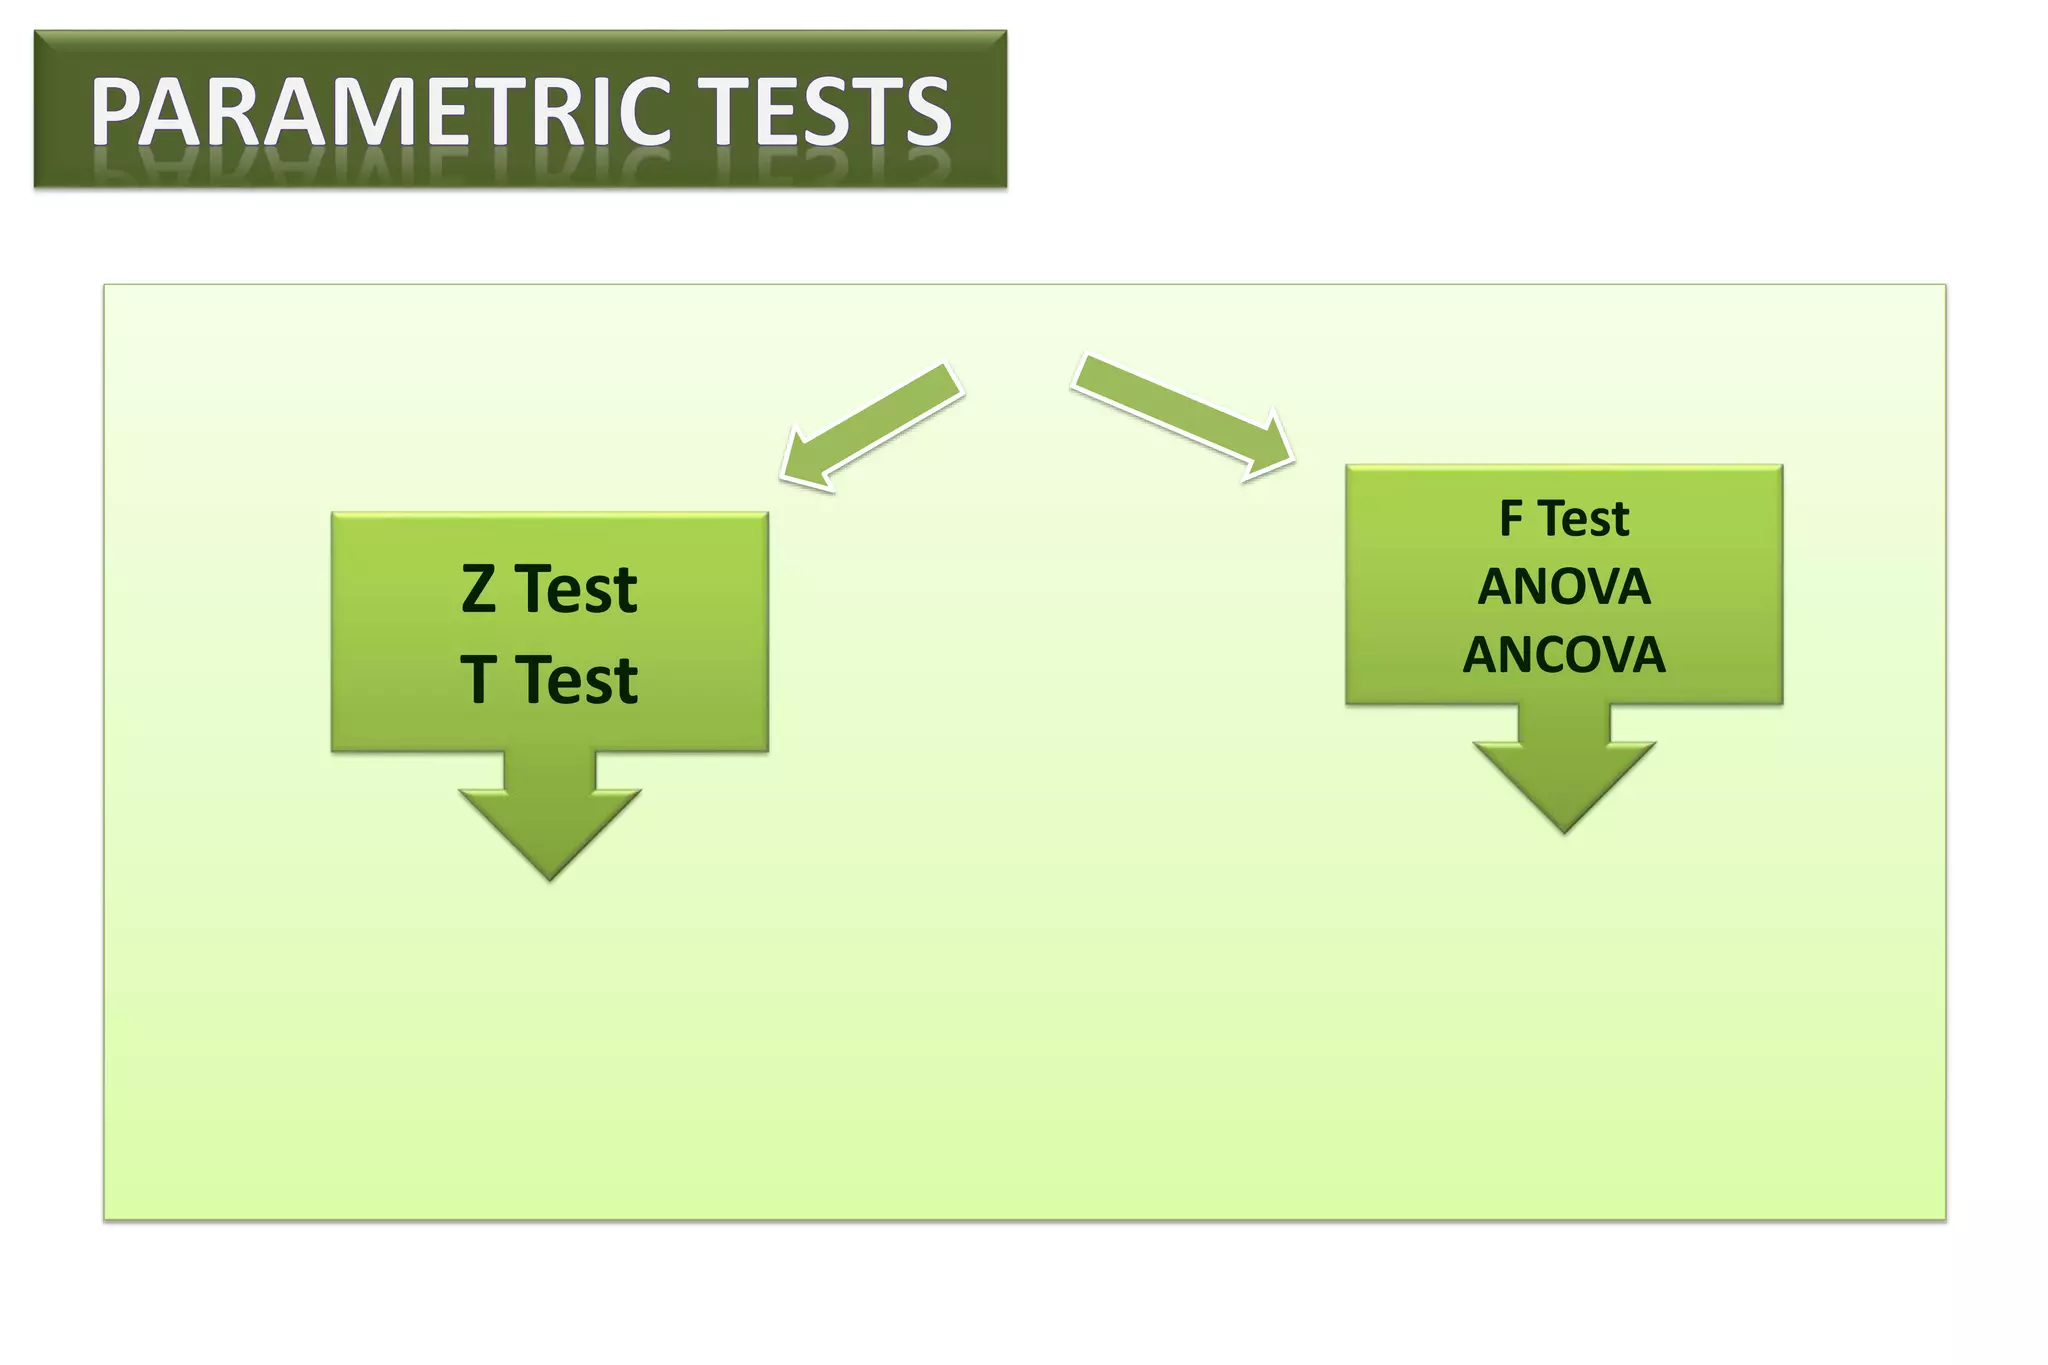
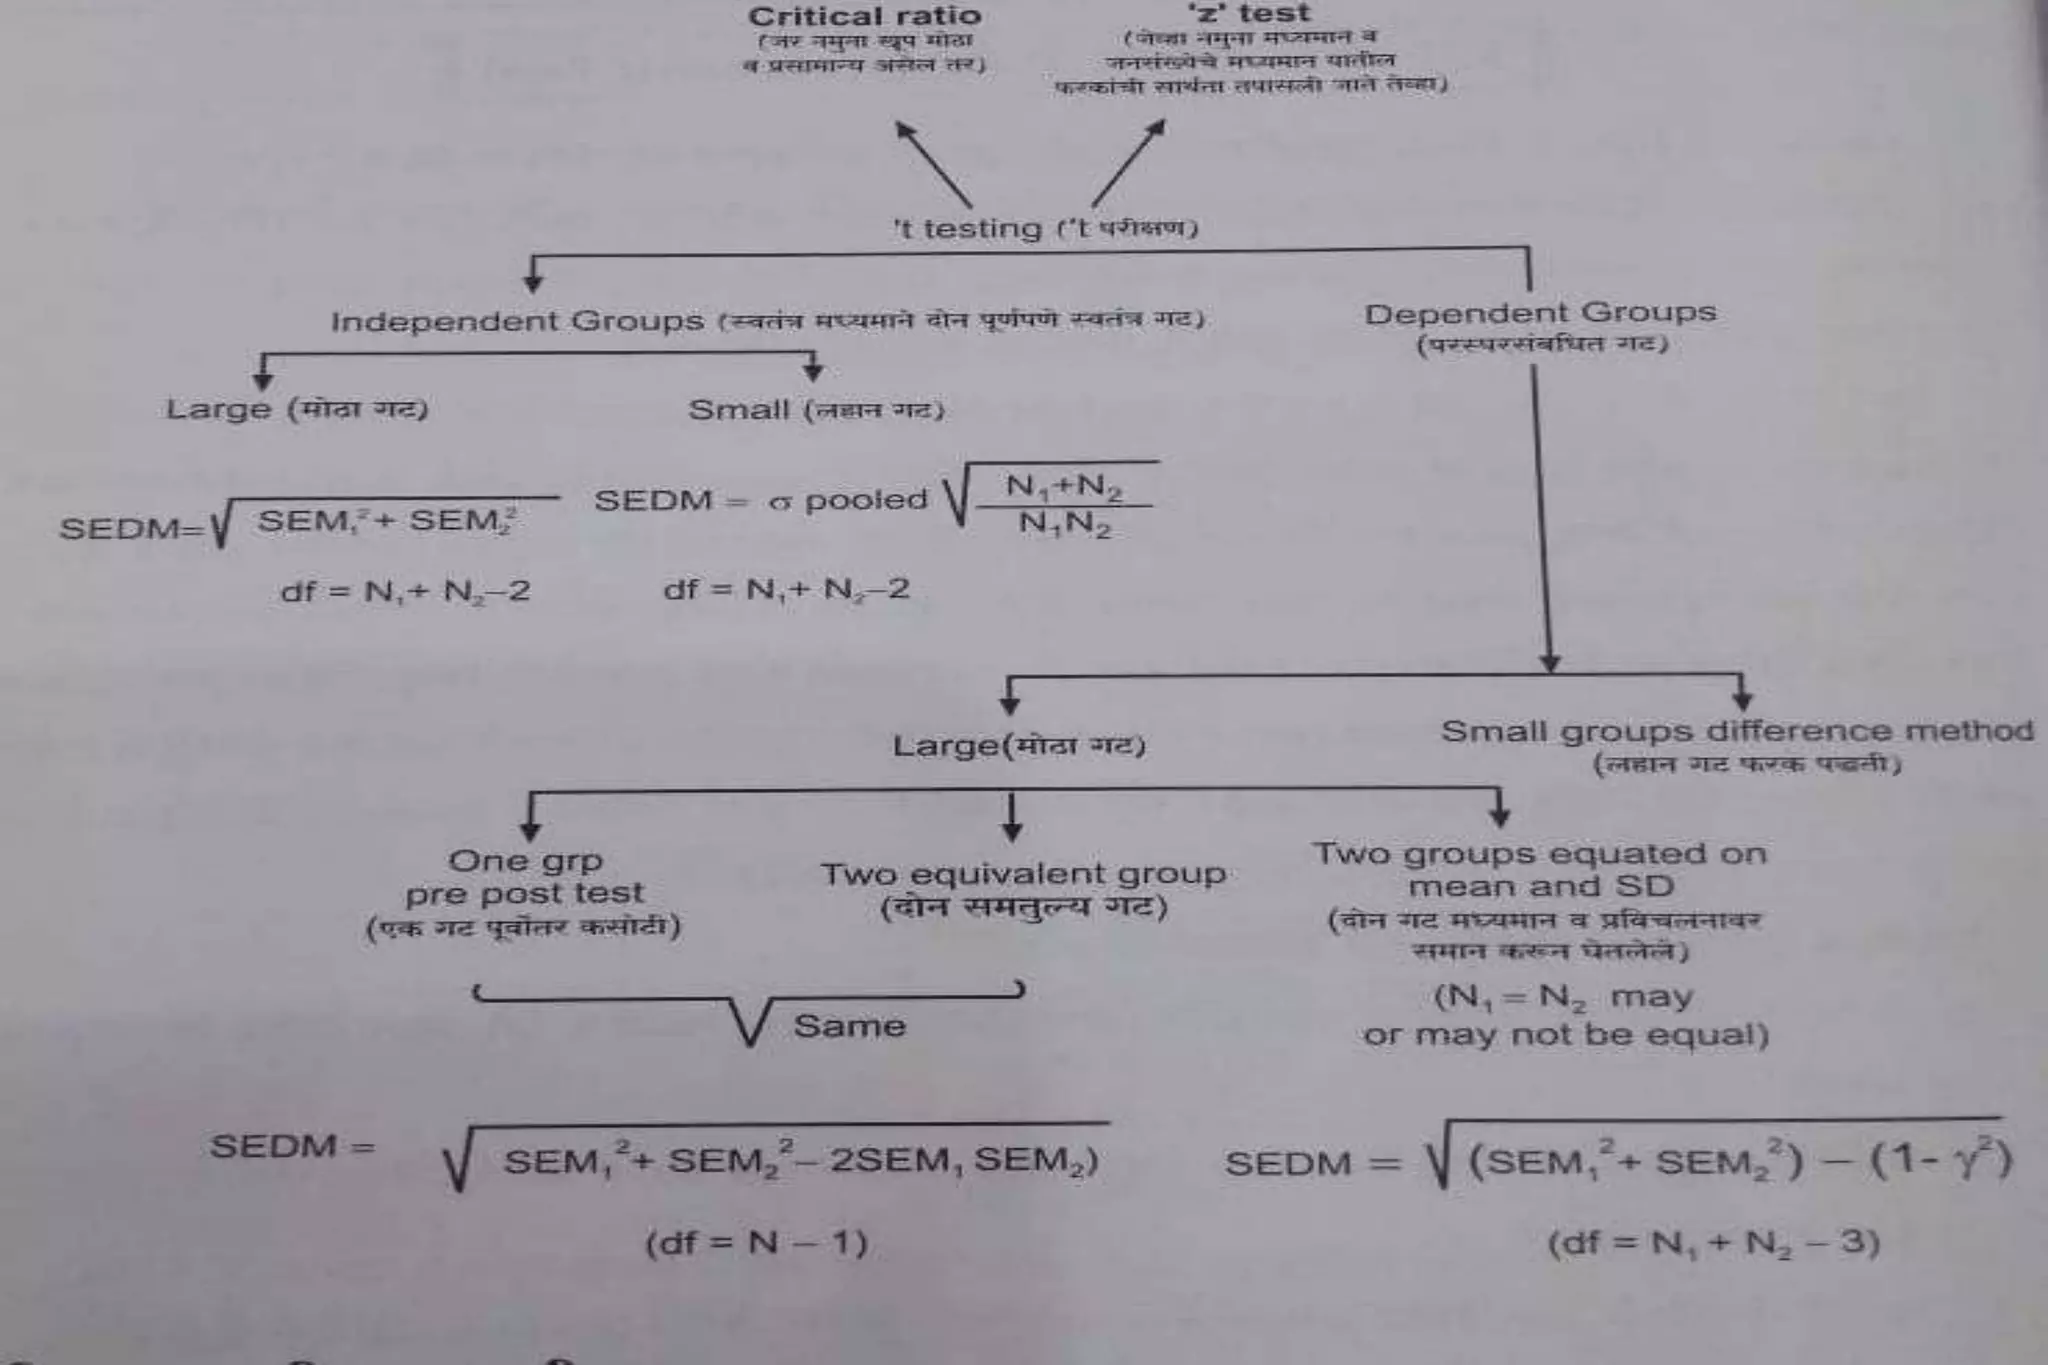
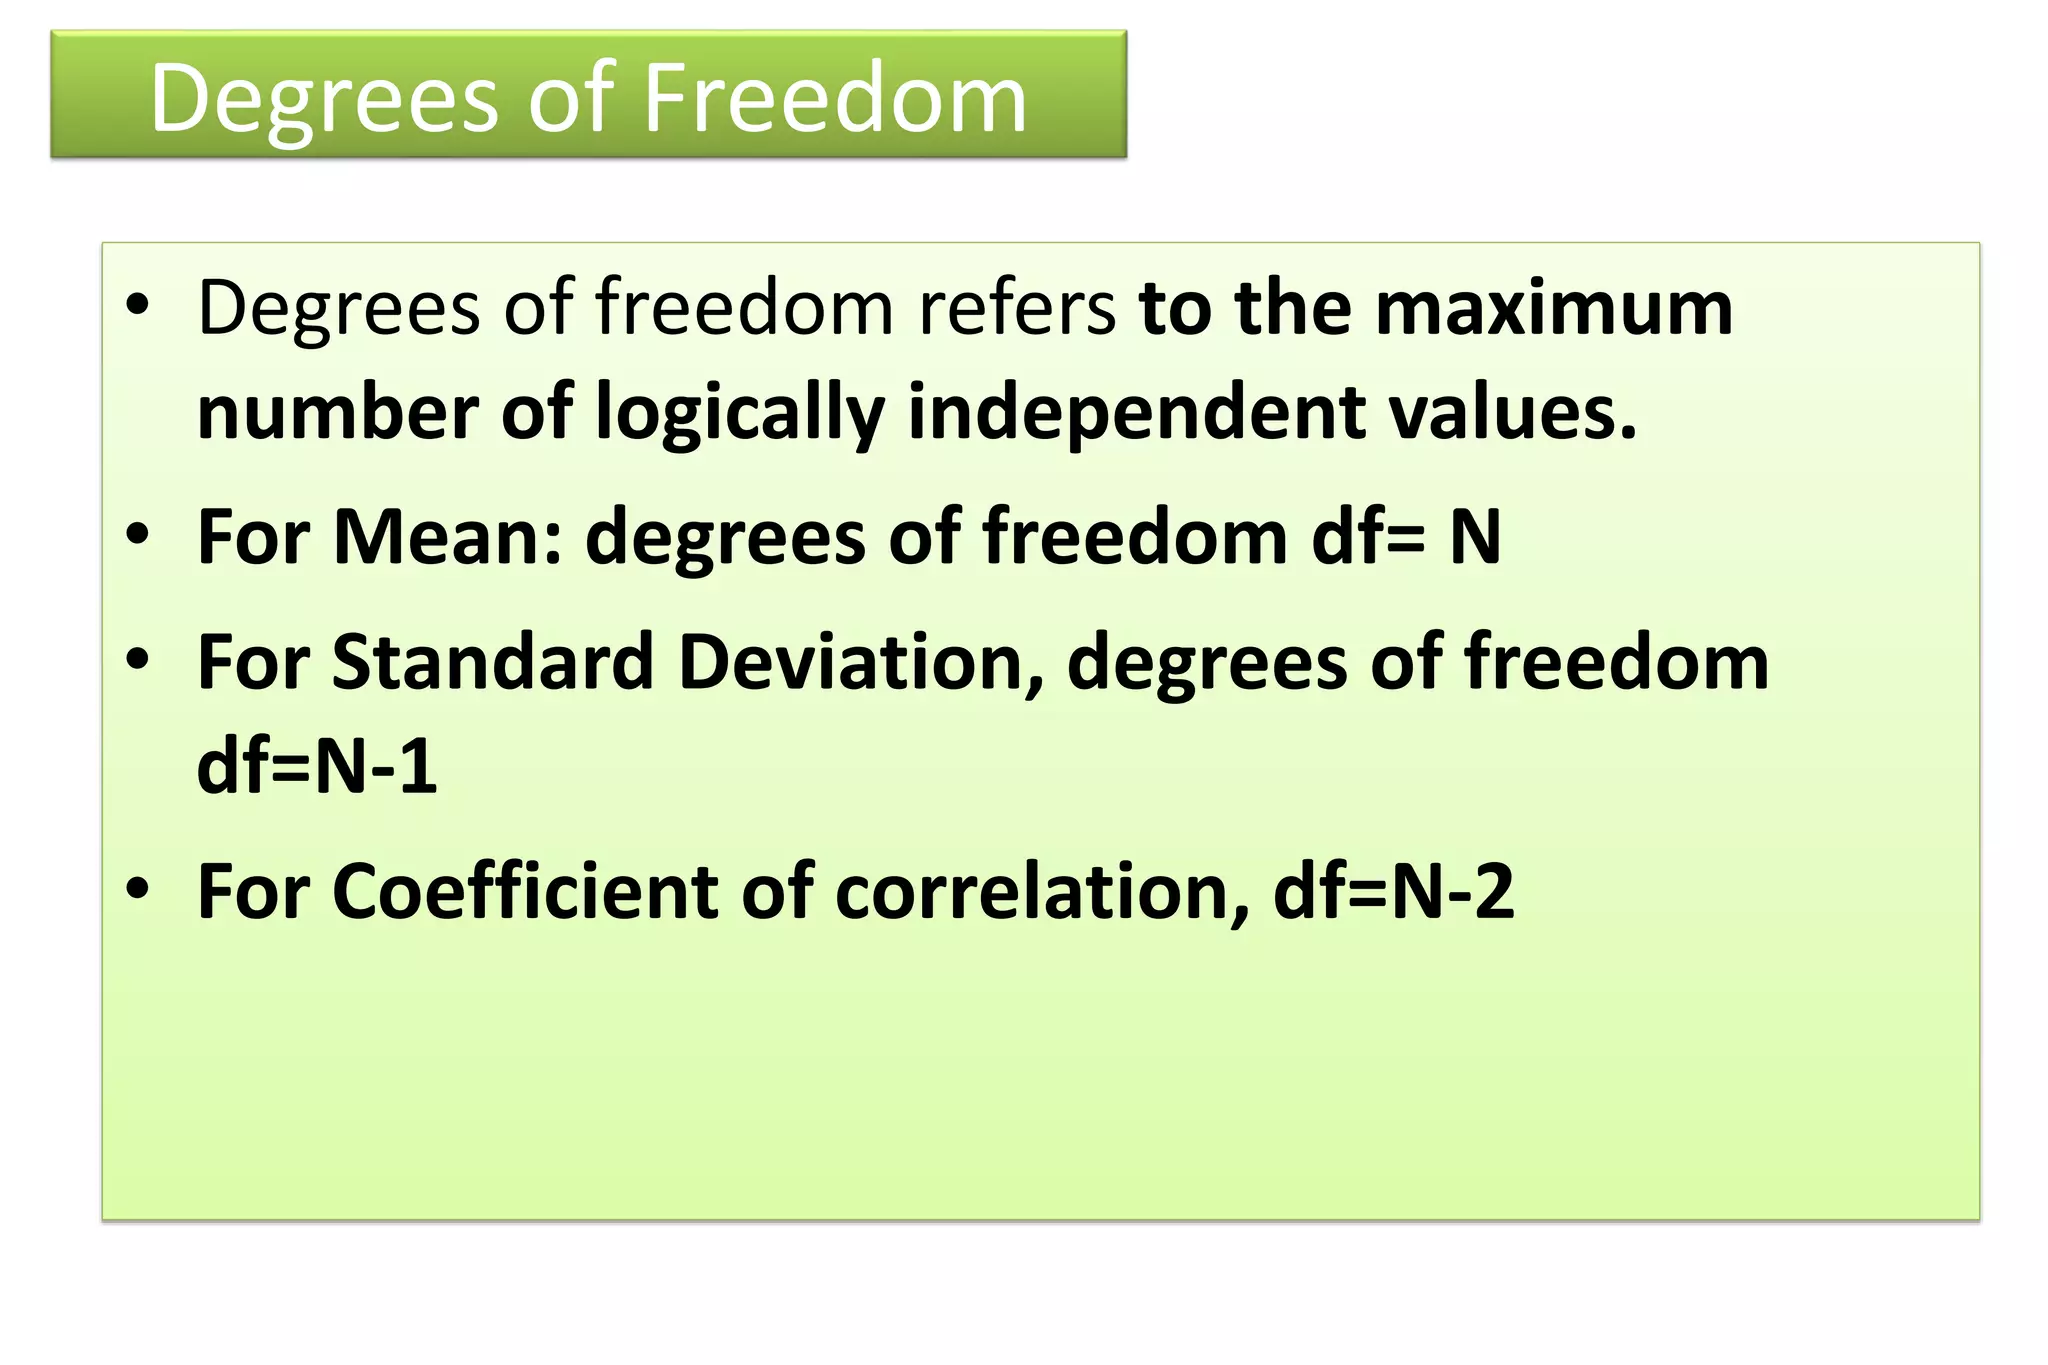
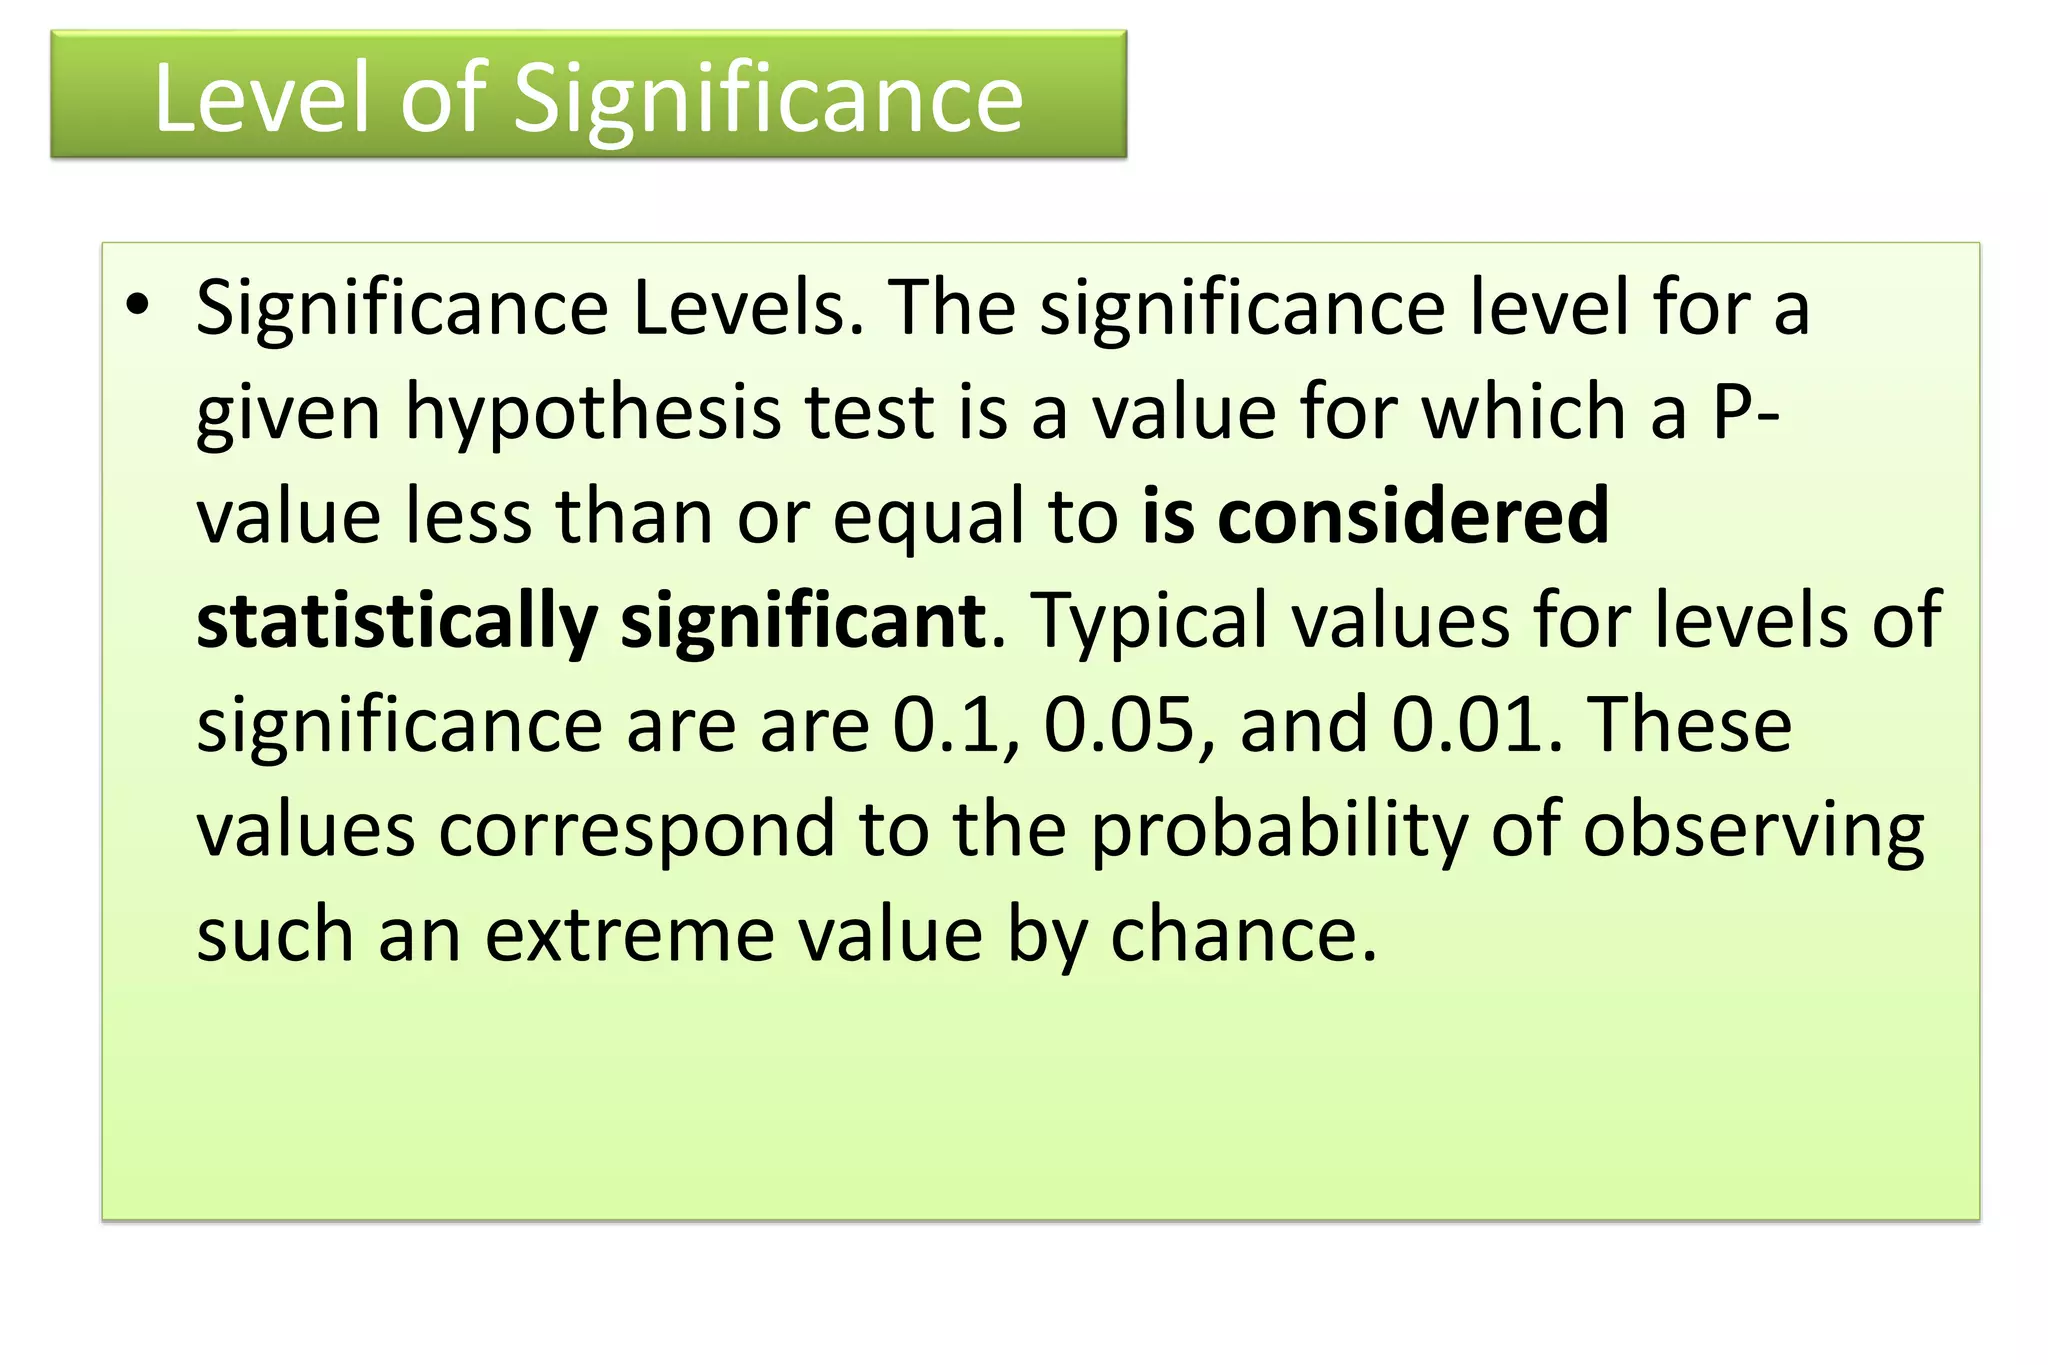
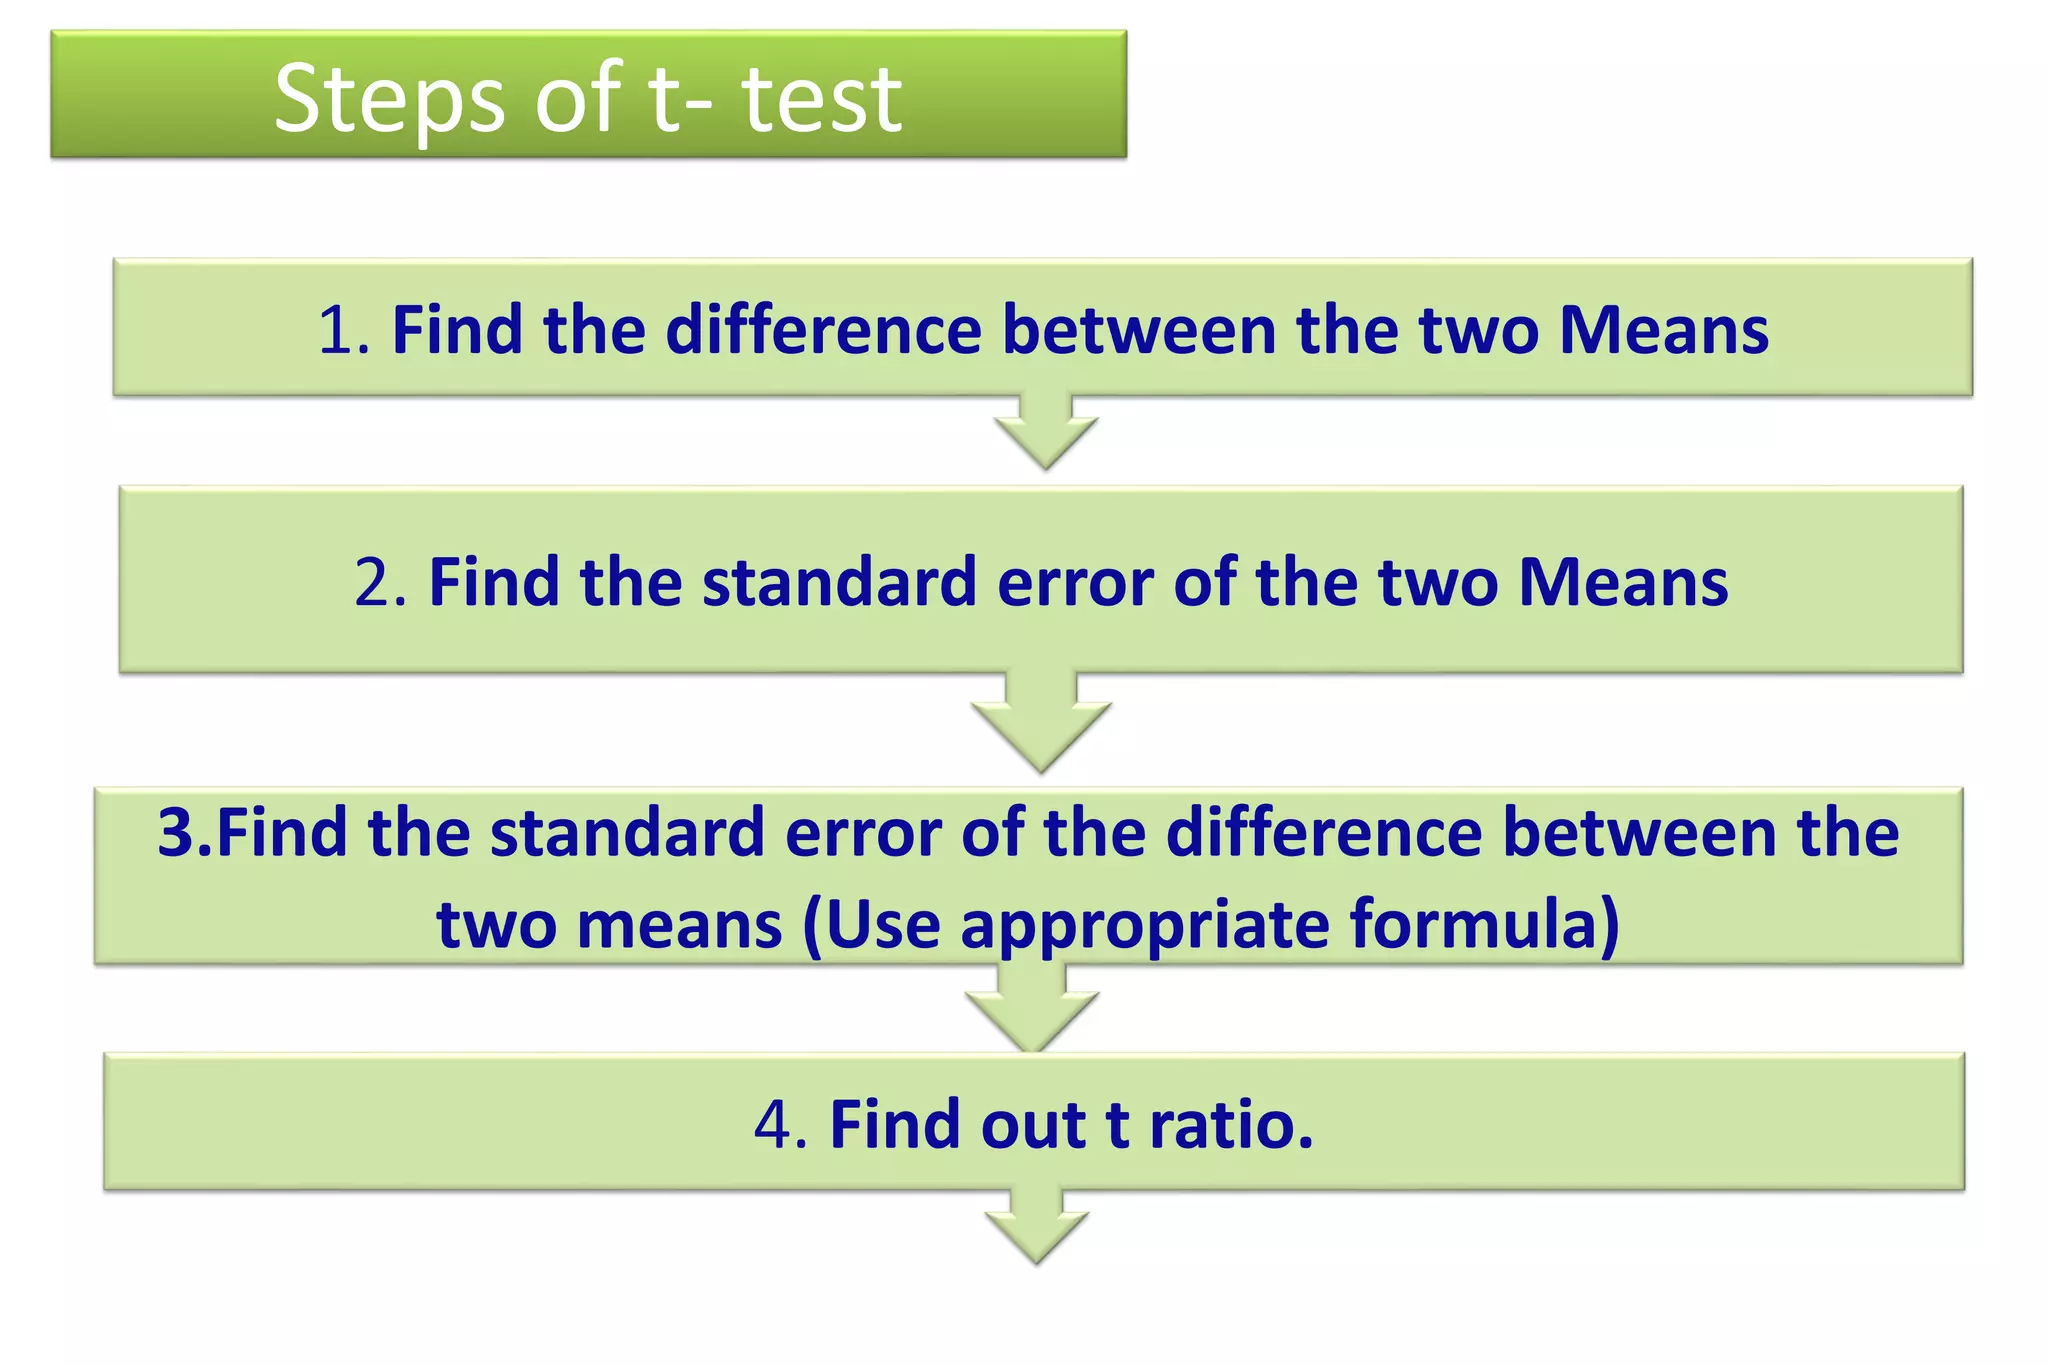
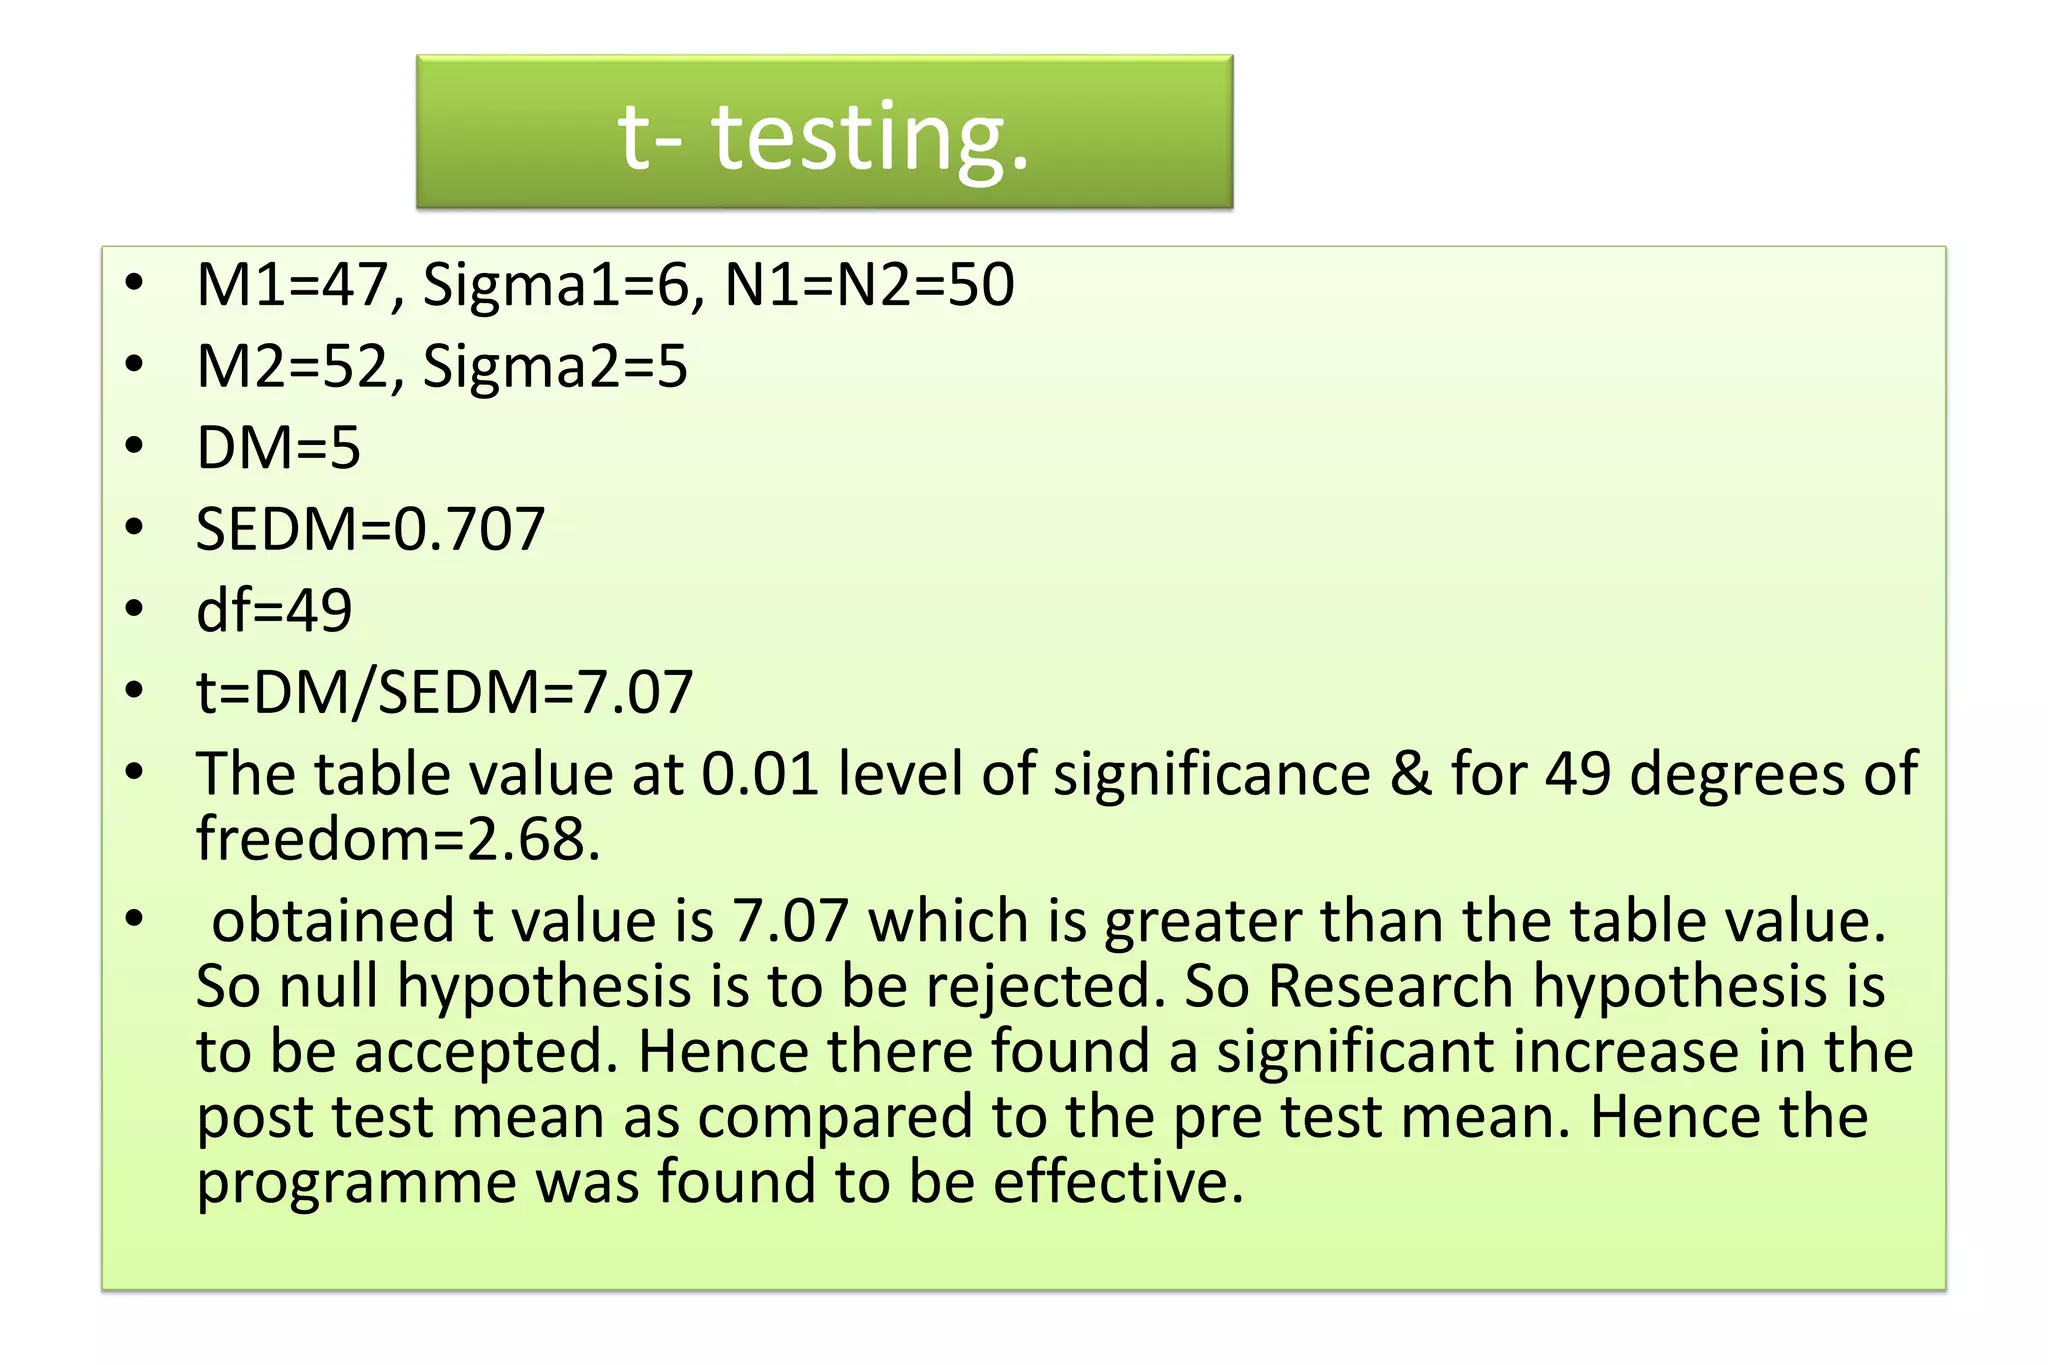
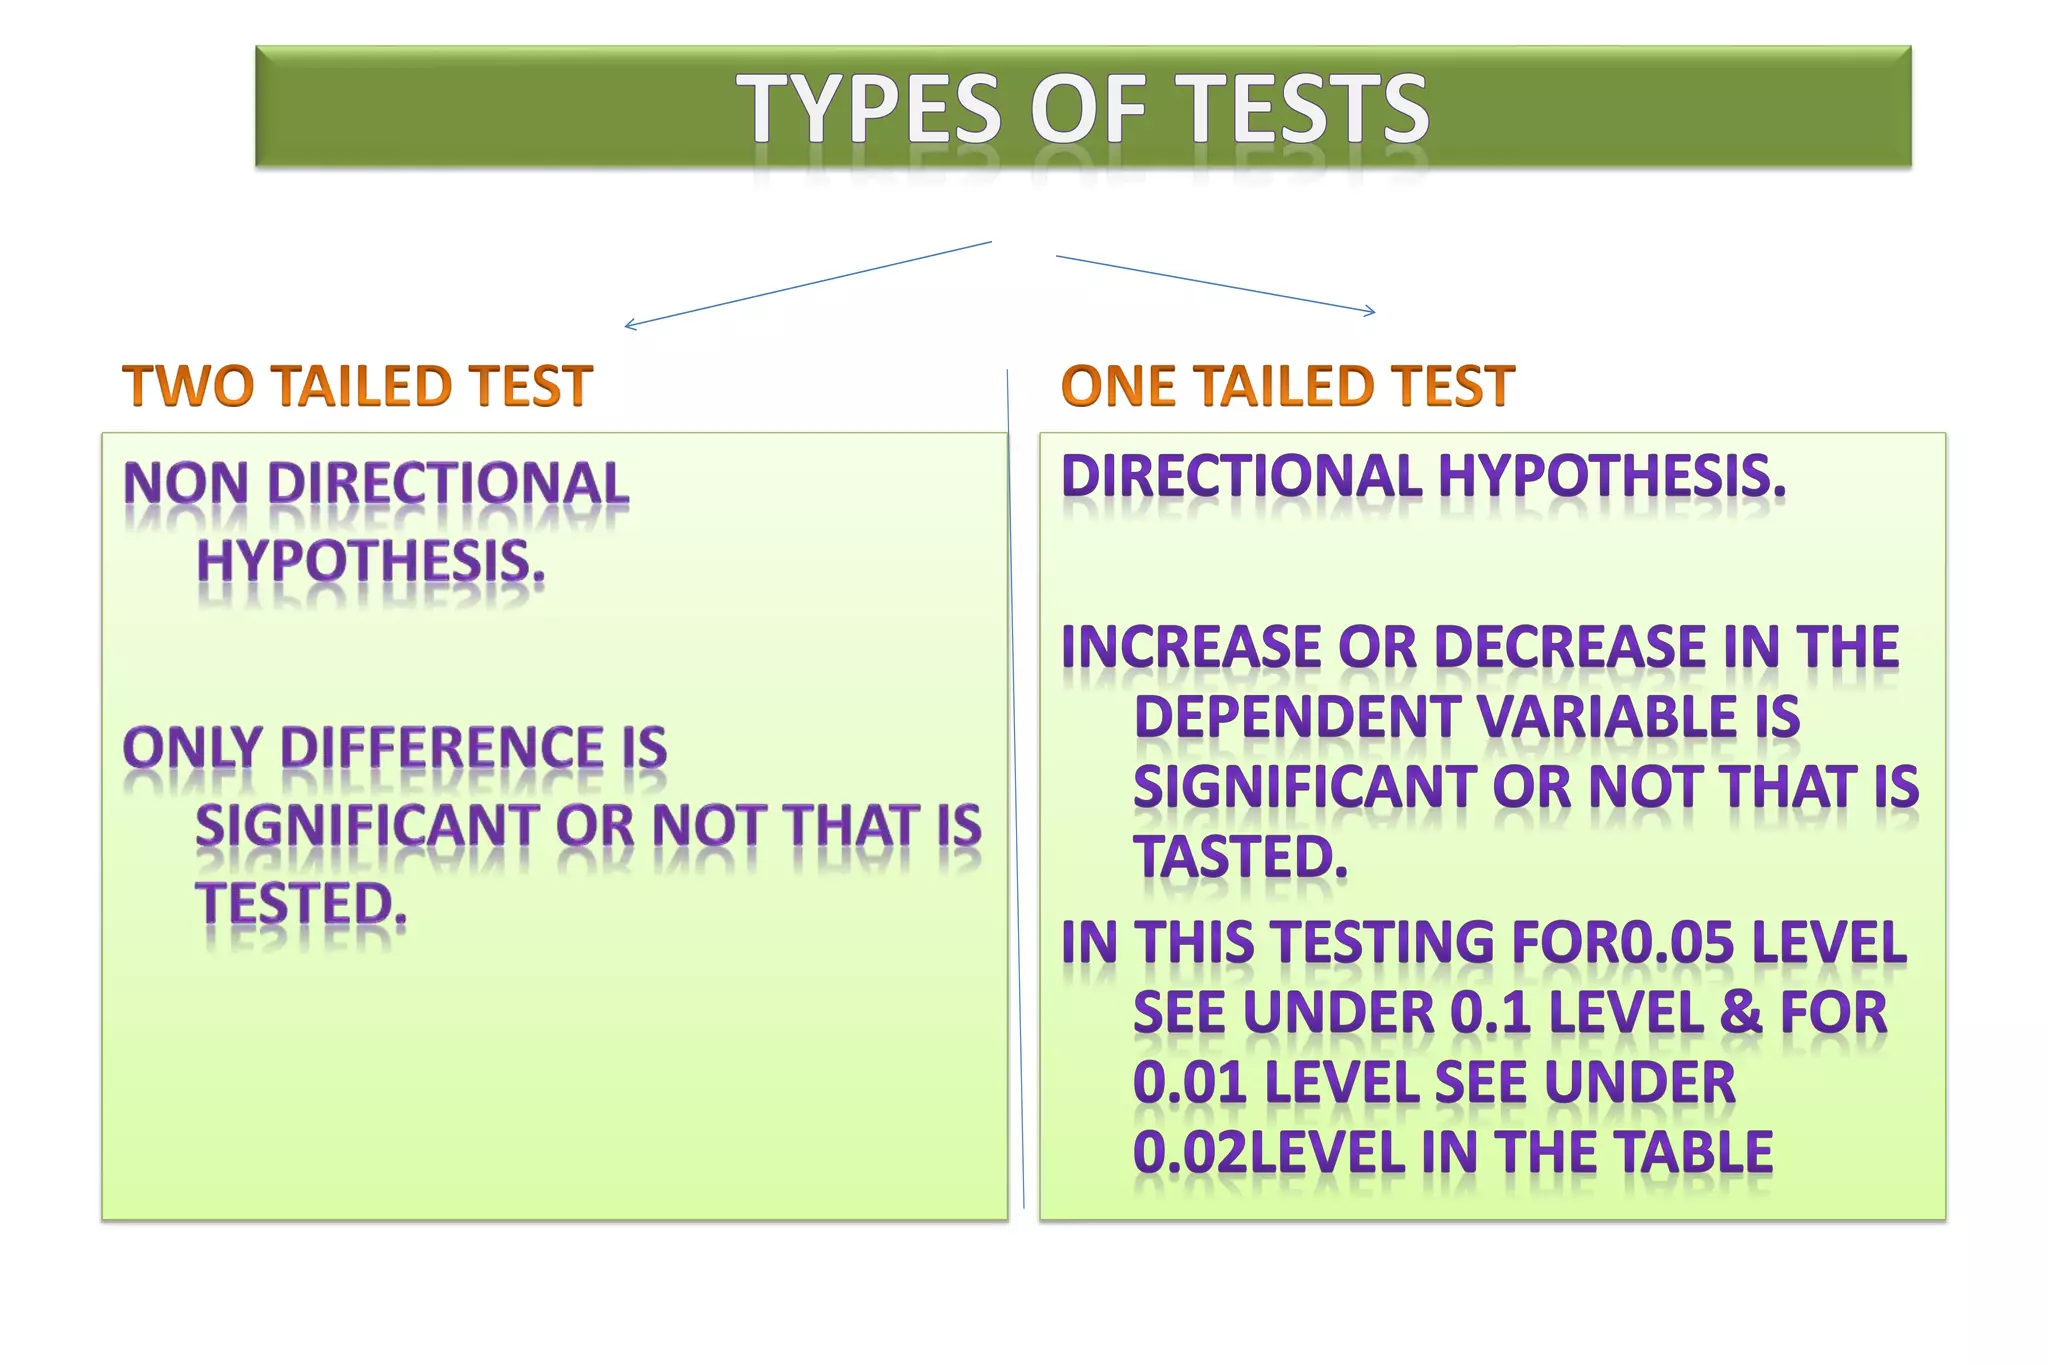
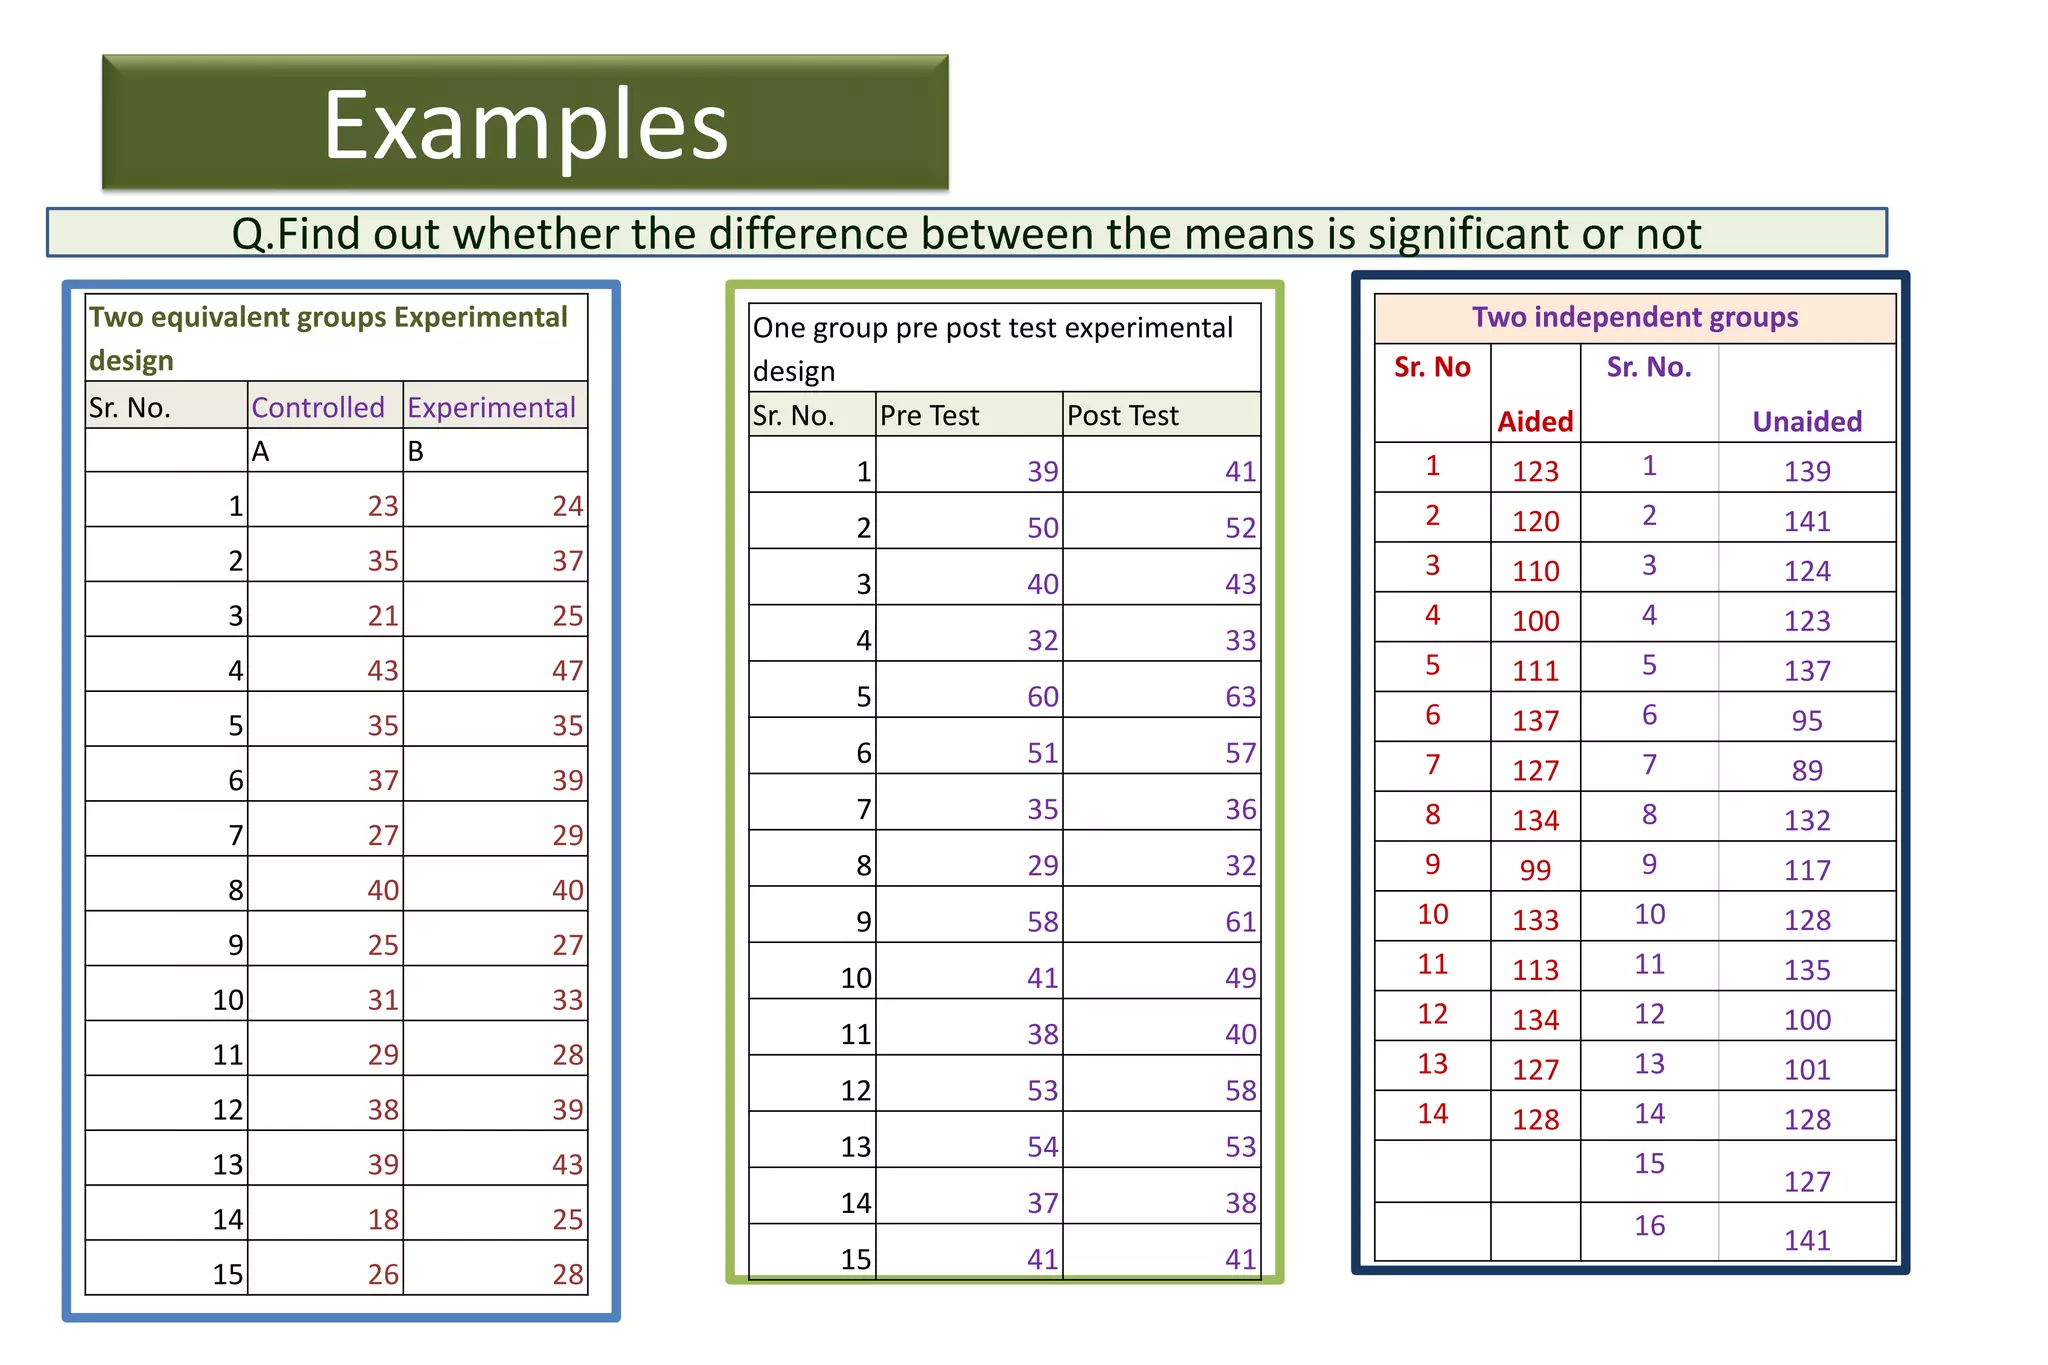
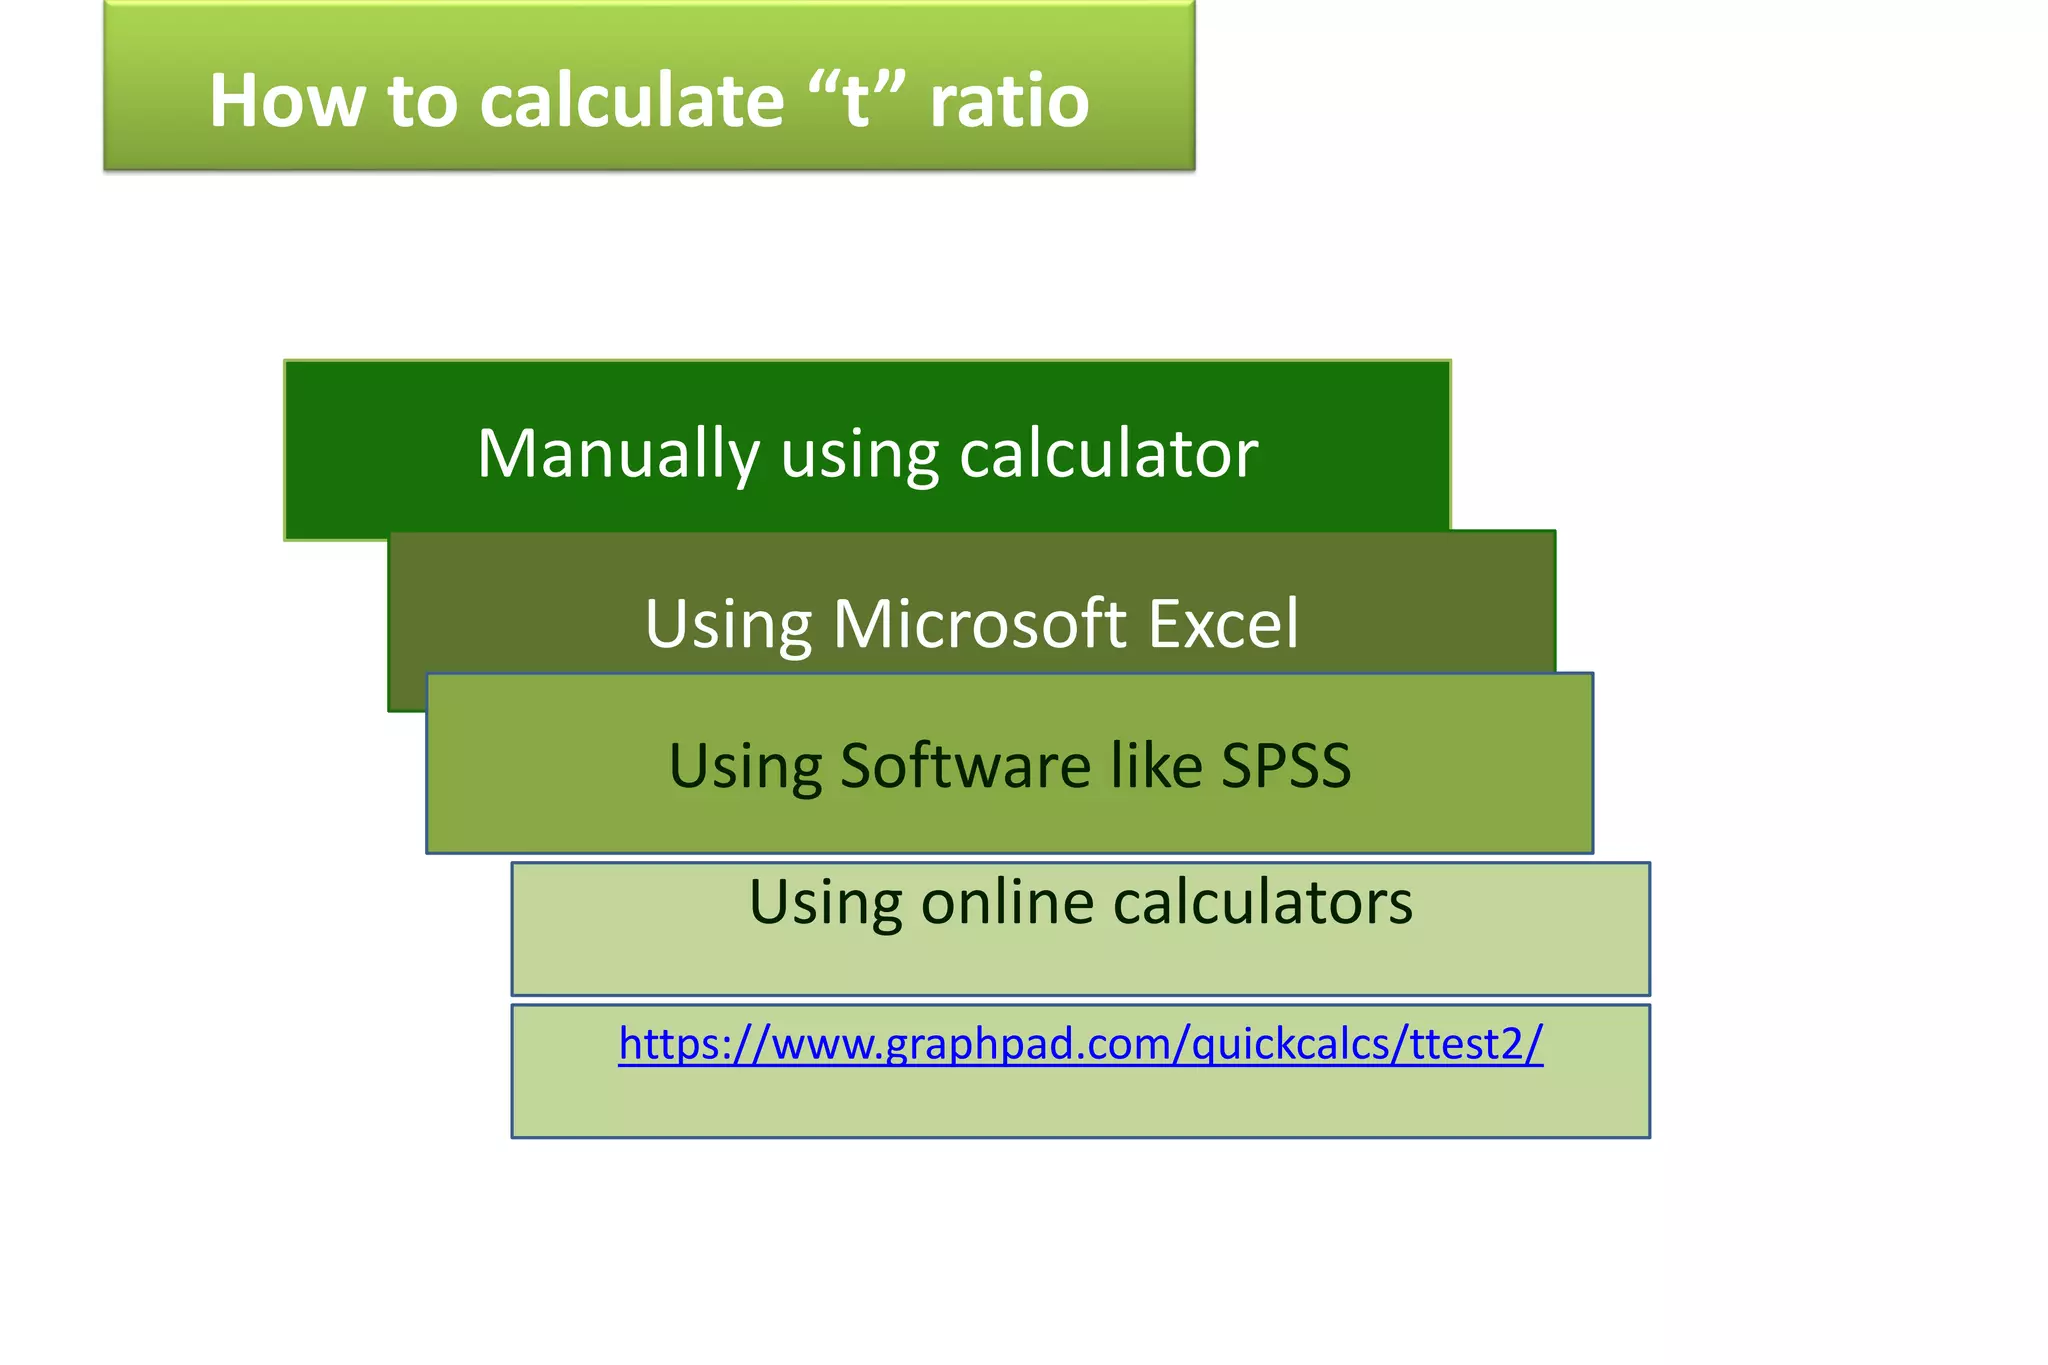
SlideShare a Scribd company logo
Parametric
tests- t test
Dr. Neha Deo
DESCRIPTIVE
INFERENTIAL
PREDICTIVE
Hypothesis is a tentative generalization, the validity
of which remains to be tested.
Hypothesis is a conjectural statement between two or
more variables.
The research or scientific hypothesis is a formal
affirmative statement predicting a single research
outcome, a tentative explanation of the
relationship between two or more variables.
Hypothesis guides the thinking process.
Hypothesis is a statement temporarily accepted
as true in the light of what is known at that
time.
Hypo + Thesis
So it is a lower level thesis. The thing might be
converted in to thesis.
• In experimental method it is must.
• In survey method when significance of
difference between two groups is to be tested.
• In correlation study to test whether the
correlation is significant or not.
• Sometimes in historical research also.
• But it is not compulsory in each & every
research.
Types of Hypothesis-
Hypothesis-types
Main
Research
Positive
H1
States that
there will be
difference
Statistical
Null
H0
States that there
will not be any
difference or
difference will be
zero.
Types
Hypothesis-types
Directional
Null
Positive
Non directional Question
Hypothesis
Some basic terms
• Parameter-P -Population
• Statistics-S-Sample
• Sampling Unit-It is one of the units selected for the purpose of sampling.
• Sampling Error= (P-S)
• Bias- It is a systematic tendency which causes differences between results and
facts.
• Sampling Distribution- S1, S2,S3, S4, S5,……..SN
M1, M2, M3, M4, M5,…….MN
112, 113, 110, 109, 119,…………
• Sampling distribution of Mean
• Standard Error
• Standard error of the mean-
• M pop=M+-(SEM×1.98)……….0.05 level
• Mpop=M+-(SEM× 2.58)…………0.01 levle
• M pop=M+-(SEM ×1.98)……….0.05 level….95%
• M pop=M+-(SEM ×2.58)………0.01 level….99%
Confidence intervals
SEM=0.5, SEM ×2.58=1.29
Mpop=M+1.29=155+1.29=156.29
Mpop=M-1.29=155-1.29=153.71
153.71……..156.29
M=155, S.D. =10, SEM=0.5,
N=400
SEM ×1.98=0.5 ×1.98=0.99
155+0.99=155.99
155-099=154.01
What does a parameter mean?
What does parametric mean?
• Parameter-a numerical or other measurable factor
forming one of a set that defines a system or sets the
conditions of its operation.
• Parametric—In STATISTICS
• assuming the value of a parameter for the purpose of
analysis.
• "variables with normal distribution were compared
by means of parametric tests"
Non-Parametric data
Parametric data
Central limit theorem
• The central limit theorem (CLT) states that the distribution of
sample means approximates a normal distribution as the sample
size gets larger, regardless of the population's distribution.
• Sample sizes equal to or greater than 30 are often considered
sufficient for the CLT to hold.
• A key aspect of CLT is that the average of the sample means and
standard deviations will equal the population mean and standard
deviation.
• A sufficiently large sample size can predict the characteristics of a
population more accurately.
• Standard Deviation of the distribution of means (Standard error)
is smaller than the standard deviation of any selected sample.
Z Test
T Test
F Test
ANOVA
ANCOVA
Student’s t distribution
In probability and statistics Student's t-distribution (or simply the t
distribution) is any member of a family of continuous probability
distributions that arise when estimating the mean of a normally distributed
population in
situations where the
sample size is small
and the
population's standard
deviation is unknown.
It was developed by
English statistician
William Sealy Gosset
under the pseudonym
"Student".
DM
SEDM
t =
Standard Error of Mean
• Standard Error of Mean:
As per the central limit
theorem,
Standard deviation of the
distribution of means is
always smaller than the
standard deviation of one
samples' standard
deviation
• Formula of standard
error of mean
σ
• SEM=
√N
‘
‘t’
Non
correlate
d groups
Small
groups.
df=N1+N2-
1
large
groups
Correlated
groups
Two groups
matched for mean
& standard
deviation.
df=N1+N2-3
Single group
pre test post
test design.
df=N-1
Two
equivalent
groups’
matched
by pairs.
df=N-1
Degrees of Freedom
• Degrees of freedom refers to the maximum
number of logically independent values.
• For Mean: degrees of freedom df= N
• For Standard Deviation, degrees of freedom
df=N-1
• For Coefficient of correlation, df=N-2
Level of Significance
• Significance Levels. The significance level for a
given hypothesis test is a value for which a P-
value less than or equal to is considered
statistically significant. Typical values for levels of
significance are are 0.1, 0.05, and 0.01. These
values correspond to the probability of observing
such an extreme value by chance.
Steps of t- test
1. Find the difference between the two Means
2. Find the standard error of the two Means
3.Find the standard error of the difference between the
two means (Use appropriate formula)
4. Find out t ratio.
Steps of t- test
5. Find out degrees of freedom
6.Decide the level of significance: o.o1 or 0.05
7. Compare the obtained t-value with the table value –D
table
8.Take the Decision.(Reject or not to reject the null
hypothesis)
9.Write down the findings as per the decision taken..
t- testing.
• M1=47, Sigma1=6, N1=N2=50
• M2=52, Sigma2=5
• DM=5
• SEDM=0.707
• df=49
• t=DM/SEDM=7.07
• The table value at 0.01 level of significance & for 49 degrees of
freedom=2.68.
• obtained t value is 7.07 which is greater than the table value.
So null hypothesis is to be rejected. So Research hypothesis is
to be accepted. Hence there found a significant increase in the
post test mean as compared to the pre test mean. Hence the
programme was found to be effective.
Examples
Two equivalent groups Experimental
design
Sr. No. Controlled Experimental
A B
1 23 24
2 35 37
3 21 25
4 43 47
5 35 35
6 37 39
7 27 29
8 40 40
9 25 27
10 31 33
11 29 28
12 38 39
13 39 43
14 18 25
15 26 28
One group pre post test experimental
design
Sr. No. Pre Test Post Test
1 39 41
2 50 52
3 40 43
4 32 33
5 60 63
6 51 57
7 35 36
8 29 32
9 58 61
10 41 49
11 38 40
12 53 58
13 54 53
14 37 38
15 41 41
Two independent groups
Sr. No
Aided
Sr. No.
Unaided
1 123 1 139
2 120 2 141
3 110 3 124
4 100 4 123
5 111 5 137
6 137 6 95
7 127 7 89
8 134 8 132
9 99 9 117
10 133 10 128
11 113 11 135
12 134 12 100
13 127 13 101
14 128 14 128
15
127
16 141
Q.Find out whether the difference between the means is significant or not
How to calculate “t” ratio
Manually using calculator
Using Microsoft Excel
Using Software like SPSS
https://www.graphpad.com/quickcalcs/ttest2/
Using online calculators
Parametric Test -T test.pptx by Dr. Neha Deo

More Related Content

What's hot

non parametric statistics
non parametric statisticsnon parametric statistics
non parametric statistics
Anchal Garg
 
Student's T-Test
Student's T-TestStudent's T-Test
Degrees of freedom
Degrees of freedomDegrees of freedom
Degrees of freedom
MacVasquez
 
Wilcoxon signed rank test
Wilcoxon signed rank testWilcoxon signed rank test
Wilcoxon signed rank test
Biswash Sapkota
 
Advance Statistics - Wilcoxon Signed Rank Test
Advance Statistics - Wilcoxon Signed Rank TestAdvance Statistics - Wilcoxon Signed Rank Test
Advance Statistics - Wilcoxon Signed Rank Test
Joshua Batalla
 
T test statistics
T test statisticsT test statistics
T test statistics
Mohammad Ihmeidan
 
Mann- Whitney Test.pptx
Mann- Whitney Test.pptxMann- Whitney Test.pptx
Mann- Whitney Test.pptx
EchaACagalitan
 
SIGN TEST SLIDE.ppt
SIGN TEST SLIDE.pptSIGN TEST SLIDE.ppt
SIGN TEST SLIDE.ppt
SikoBikoAreru
 
t distribution, paired and unpaired t-test
t distribution, paired and unpaired t-testt distribution, paired and unpaired t-test
t distribution, paired and unpaired t-test
BPKIHS
 
Experimental research design
Experimental research designExperimental research design
Experimental research design
Muhammad Musawar Ali
 
Friedman test Stat
Friedman test Stat Friedman test Stat
Friedman test Stat
Kate Malda
 
Independent sample t test
Independent sample t testIndependent sample t test
Independent sample t test
Shajar Khan
 
The Normal Distribution
The Normal DistributionThe Normal Distribution
The Normal Distribution
San Benito CISD
 
Hypothesis testing for parametric data
Hypothesis testing for parametric dataHypothesis testing for parametric data
Hypothesis testing for parametric data
KwambokaLeonidah
 
Wilcoxon Signed Rank Test
Wilcoxon Signed Rank Test Wilcoxon Signed Rank Test
Wilcoxon Signed Rank Test
Sharlaine Ruth
 
Degree of freedom.pptx
Degree of freedom.pptxDegree of freedom.pptx
Degree of freedom.pptx
CHIRANTANMONDAL2
 
Goodness of fit (ppt)
Goodness of fit (ppt)Goodness of fit (ppt)
Goodness of fit (ppt)
Sharlaine Ruth
 
Intro to tests of significance qualitative
Intro to tests of significance qualitativeIntro to tests of significance qualitative
Intro to tests of significance qualitative
Pandurangi Raghavendra
 
Assumptions about parametric and non parametric tests
Assumptions about parametric and non parametric testsAssumptions about parametric and non parametric tests
Assumptions about parametric and non parametric tests
Barath Babu Kumar
 
Experimental Research Design - Meaning, Characteristics and Classification
Experimental Research Design - Meaning, Characteristics and ClassificationExperimental Research Design - Meaning, Characteristics and Classification
Experimental Research Design - Meaning, Characteristics and Classification
Sundar B N
 

What's hot (20)

non parametric statistics
non parametric statisticsnon parametric statistics
non parametric statistics
 
Student's T-Test
Student's T-TestStudent's T-Test
Student's T-Test
 
Degrees of freedom
Degrees of freedomDegrees of freedom
Degrees of freedom
 
Wilcoxon signed rank test
Wilcoxon signed rank testWilcoxon signed rank test
Wilcoxon signed rank test
 
Advance Statistics - Wilcoxon Signed Rank Test
Advance Statistics - Wilcoxon Signed Rank TestAdvance Statistics - Wilcoxon Signed Rank Test
Advance Statistics - Wilcoxon Signed Rank Test
 
T test statistics
T test statisticsT test statistics
T test statistics
 
Mann- Whitney Test.pptx
Mann- Whitney Test.pptxMann- Whitney Test.pptx
Mann- Whitney Test.pptx
 
SIGN TEST SLIDE.ppt
SIGN TEST SLIDE.pptSIGN TEST SLIDE.ppt
SIGN TEST SLIDE.ppt
 
t distribution, paired and unpaired t-test
t distribution, paired and unpaired t-testt distribution, paired and unpaired t-test
t distribution, paired and unpaired t-test
 
Experimental research design
Experimental research designExperimental research design
Experimental research design
 
Friedman test Stat
Friedman test Stat Friedman test Stat
Friedman test Stat
 
Independent sample t test
Independent sample t testIndependent sample t test
Independent sample t test
 
The Normal Distribution
The Normal DistributionThe Normal Distribution
The Normal Distribution
 
Hypothesis testing for parametric data
Hypothesis testing for parametric dataHypothesis testing for parametric data
Hypothesis testing for parametric data
 
Wilcoxon Signed Rank Test
Wilcoxon Signed Rank Test Wilcoxon Signed Rank Test
Wilcoxon Signed Rank Test
 
Degree of freedom.pptx
Degree of freedom.pptxDegree of freedom.pptx
Degree of freedom.pptx
 
Goodness of fit (ppt)
Goodness of fit (ppt)Goodness of fit (ppt)
Goodness of fit (ppt)
 
Intro to tests of significance qualitative
Intro to tests of significance qualitativeIntro to tests of significance qualitative
Intro to tests of significance qualitative
 
Assumptions about parametric and non parametric tests
Assumptions about parametric and non parametric testsAssumptions about parametric and non parametric tests
Assumptions about parametric and non parametric tests
 
Experimental Research Design - Meaning, Characteristics and Classification
Experimental Research Design - Meaning, Characteristics and ClassificationExperimental Research Design - Meaning, Characteristics and Classification
Experimental Research Design - Meaning, Characteristics and Classification
 

Similar to Parametric Test -T test.pptx by Dr. Neha Deo

Test of significance
Test of significanceTest of significance
Test of significance
Dr. Imran Zaheer
 
jhghgjhgjhgjhfhcgjfjhvjhjgjkggjhgjhgjhfjgjgfgfhgfhg
jhghgjhgjhgjhfhcgjfjhvjhjgjkggjhgjhgjhfjgjgfgfhgfhgjhghgjhgjhgjhfhcgjfjhvjhjgjkggjhgjhgjhfjgjgfgfhgfhg
jhghgjhgjhgjhfhcgjfjhvjhjgjkggjhgjhgjhfjgjgfgfhgfhg
UMAIRASHFAQ20
 
Dr.Dinesh-BIOSTAT-Tests-of-significance-1-min.pdf
Dr.Dinesh-BIOSTAT-Tests-of-significance-1-min.pdfDr.Dinesh-BIOSTAT-Tests-of-significance-1-min.pdf
Dr.Dinesh-BIOSTAT-Tests-of-significance-1-min.pdf
HassanMohyUdDin2
 
Applied statistics lecture_3
Applied statistics lecture_3Applied statistics lecture_3
Applied statistics lecture_3
Daria Bogdanova
 
univariate and bivariate analysis in spss
univariate and bivariate analysis in spss univariate and bivariate analysis in spss
univariate and bivariate analysis in spss
Subodh Khanal
 
Steps of hypothesis testingSelect the appropriate testSo far.docx
Steps of hypothesis testingSelect the appropriate testSo far.docxSteps of hypothesis testingSelect the appropriate testSo far.docx
Steps of hypothesis testingSelect the appropriate testSo far.docx
dessiechisomjj4
 
Ttest
TtestTtest
Stats - Intro to Quantitative
Stats -  Intro to Quantitative Stats -  Intro to Quantitative
Stats - Intro to Quantitative
Michigan State University
 
Test of-significance : Z test , Chi square test
Test of-significance : Z test , Chi square testTest of-significance : Z test , Chi square test
Test of-significance : Z test , Chi square test
dr.balan shaikh
 
Factorial Experiments
Factorial ExperimentsFactorial Experiments
Factorial Experiments
HelpWithAssignment.com
 
T test^jsample size^j ethics
T test^jsample size^j ethicsT test^jsample size^j ethics
T test^jsample size^j ethics
Abhishek Thakur
 
Chi square test
Chi square testChi square test
hypothesis.pptx
hypothesis.pptxhypothesis.pptx
hypothesis.pptx
PrakharMishra925441
 
inferentialstatistics-210411214248.pdf
inferentialstatistics-210411214248.pdfinferentialstatistics-210411214248.pdf
inferentialstatistics-210411214248.pdf
ChenPalaruan
 
Inferential statistics
Inferential statisticsInferential statistics
Inferential statistics
Dalia El-Shafei
 
Inferential statistics quantitative data - single sample and 2 groups
Inferential statistics   quantitative data - single sample and 2 groupsInferential statistics   quantitative data - single sample and 2 groups
Inferential statistics quantitative data - single sample and 2 groups
Dhritiman Chakrabarti
 
Introduction to the t Statistic
Introduction to the t StatisticIntroduction to the t Statistic
Introduction to the t Statistic
jasondroesch
 
Statistical analysis.pptx
Statistical analysis.pptxStatistical analysis.pptx
Statistical analysis.pptx
Chinna Chadayan
 
Unit-5.-t-test.ppt
Unit-5.-t-test.pptUnit-5.-t-test.ppt
Unit-5.-t-test.ppt
frelynmaeDillo
 
linearity concept of significance, standard deviation, chi square test, stude...
linearity concept of significance, standard deviation, chi square test, stude...linearity concept of significance, standard deviation, chi square test, stude...
linearity concept of significance, standard deviation, chi square test, stude...
KavyasriPuttamreddy
 

Similar to Parametric Test -T test.pptx by Dr. Neha Deo (20)

Test of significance
Test of significanceTest of significance
Test of significance
 
jhghgjhgjhgjhfhcgjfjhvjhjgjkggjhgjhgjhfjgjgfgfhgfhg
jhghgjhgjhgjhfhcgjfjhvjhjgjkggjhgjhgjhfjgjgfgfhgfhgjhghgjhgjhgjhfhcgjfjhvjhjgjkggjhgjhgjhfjgjgfgfhgfhg
jhghgjhgjhgjhfhcgjfjhvjhjgjkggjhgjhgjhfjgjgfgfhgfhg
 
Dr.Dinesh-BIOSTAT-Tests-of-significance-1-min.pdf
Dr.Dinesh-BIOSTAT-Tests-of-significance-1-min.pdfDr.Dinesh-BIOSTAT-Tests-of-significance-1-min.pdf
Dr.Dinesh-BIOSTAT-Tests-of-significance-1-min.pdf
 
Applied statistics lecture_3
Applied statistics lecture_3Applied statistics lecture_3
Applied statistics lecture_3
 
univariate and bivariate analysis in spss
univariate and bivariate analysis in spss univariate and bivariate analysis in spss
univariate and bivariate analysis in spss
 
Steps of hypothesis testingSelect the appropriate testSo far.docx
Steps of hypothesis testingSelect the appropriate testSo far.docxSteps of hypothesis testingSelect the appropriate testSo far.docx
Steps of hypothesis testingSelect the appropriate testSo far.docx
 
Ttest
TtestTtest
Ttest
 
Stats - Intro to Quantitative
Stats -  Intro to Quantitative Stats -  Intro to Quantitative
Stats - Intro to Quantitative
 
Test of-significance : Z test , Chi square test
Test of-significance : Z test , Chi square testTest of-significance : Z test , Chi square test
Test of-significance : Z test , Chi square test
 
Factorial Experiments
Factorial ExperimentsFactorial Experiments
Factorial Experiments
 
T test^jsample size^j ethics
T test^jsample size^j ethicsT test^jsample size^j ethics
T test^jsample size^j ethics
 
Chi square test
Chi square testChi square test
Chi square test
 
hypothesis.pptx
hypothesis.pptxhypothesis.pptx
hypothesis.pptx
 
inferentialstatistics-210411214248.pdf
inferentialstatistics-210411214248.pdfinferentialstatistics-210411214248.pdf
inferentialstatistics-210411214248.pdf
 
Inferential statistics
Inferential statisticsInferential statistics
Inferential statistics
 
Inferential statistics quantitative data - single sample and 2 groups
Inferential statistics   quantitative data - single sample and 2 groupsInferential statistics   quantitative data - single sample and 2 groups
Inferential statistics quantitative data - single sample and 2 groups
 
Introduction to the t Statistic
Introduction to the t StatisticIntroduction to the t Statistic
Introduction to the t Statistic
 
Statistical analysis.pptx
Statistical analysis.pptxStatistical analysis.pptx
Statistical analysis.pptx
 
Unit-5.-t-test.ppt
Unit-5.-t-test.pptUnit-5.-t-test.ppt
Unit-5.-t-test.ppt
 
linearity concept of significance, standard deviation, chi square test, stude...
linearity concept of significance, standard deviation, chi square test, stude...linearity concept of significance, standard deviation, chi square test, stude...
linearity concept of significance, standard deviation, chi square test, stude...
 

More from Neha Deo

STAFF DEVELOPMENT revised.pptx
STAFF DEVELOPMENT revised.pptxSTAFF DEVELOPMENT revised.pptx
STAFF DEVELOPMENT revised.pptx
Neha Deo
 
Group Dynamics.pptx
Group Dynamics.pptxGroup Dynamics.pptx
Group Dynamics.pptx
Neha Deo
 
Quality
Quality Quality
Quality
Neha Deo
 
Review of related literature , researches, Notes taking.pptx
 Review of related literature , researches, Notes taking.pptx Review of related literature , researches, Notes taking.pptx
Review of related literature , researches, Notes taking.pptx
Neha Deo
 
Mixed methods research in Education pptx
Mixed methods research in Education pptxMixed methods research in Education pptx
Mixed methods research in Education pptx
Neha Deo
 
Principles of qualitative research. for slideshare.pptx
Principles of qualitative research. for slideshare.pptxPrinciples of qualitative research. for slideshare.pptx
Principles of qualitative research. for slideshare.pptx
Neha Deo
 
Ethical issues in qualitative research
Ethical issues in qualitative researchEthical issues in qualitative research
Ethical issues in qualitative research
Neha Deo
 
Narrative research for slideshare upload.pptx
Narrative research for slideshare upload.pptxNarrative research for slideshare upload.pptx
Narrative research for slideshare upload.pptx
Neha Deo
 
Types of data in a qualitative research for slideshare upload.pptx
Types of data in a qualitative research for slideshare upload.pptxTypes of data in a qualitative research for slideshare upload.pptx
Types of data in a qualitative research for slideshare upload.pptx
Neha Deo
 
Phenomenological Research
Phenomenological ResearchPhenomenological Research
Phenomenological Research
Neha Deo
 
Normal Probability Curve by Dr. Neha Deo
Normal Probability Curve by Dr. Neha DeoNormal Probability Curve by Dr. Neha Deo
Normal Probability Curve by Dr. Neha Deo
Neha Deo
 
Qualitative Research by Dr.Neha Deo
Qualitative Research by Dr.Neha DeoQualitative Research by Dr.Neha Deo
Qualitative Research by Dr.Neha Deo
Neha Deo
 
Meaning, definitions & need of educational research.
Meaning, definitions & need of educational research.Meaning, definitions & need of educational research.
Meaning, definitions & need of educational research.
Neha Deo
 
A Case study by Dr. Neha Deo
A Case study by Dr. Neha DeoA Case study by Dr. Neha Deo
A Case study by Dr. Neha Deo
Neha Deo
 
Review of related literature & research studies by Dr. Neha Deo
Review of related literature & research studies by Dr. Neha DeoReview of related literature & research studies by Dr. Neha Deo
Review of related literature & research studies by Dr. Neha Deo
Neha Deo
 
Ex post facto research (causal comparative) by Dr. Neha Deo
Ex post facto research (causal comparative) by Dr. Neha DeoEx post facto research (causal comparative) by Dr. Neha Deo
Ex post facto research (causal comparative) by Dr. Neha Deo
Neha Deo
 
Descriptive research-Different types of survey by Dr. Neha Deo
Descriptive research-Different types of survey by Dr. Neha DeoDescriptive research-Different types of survey by Dr. Neha Deo
Descriptive research-Different types of survey by Dr. Neha Deo
Neha Deo
 
Experimental method of Educational Research.
Experimental method of Educational Research.Experimental method of Educational Research.
Experimental method of Educational Research.
Neha Deo
 
Correlation study-by Dr. Neha Deo
Correlation study-by Dr. Neha DeoCorrelation study-by Dr. Neha Deo
Correlation study-by Dr. Neha Deo
Neha Deo
 
Research methodology-Variables-by Dr. Neha Deo
Research methodology-Variables-by Dr. Neha DeoResearch methodology-Variables-by Dr. Neha Deo
Research methodology-Variables-by Dr. Neha Deo
Neha Deo
 

More from Neha Deo (20)

STAFF DEVELOPMENT revised.pptx
STAFF DEVELOPMENT revised.pptxSTAFF DEVELOPMENT revised.pptx
STAFF DEVELOPMENT revised.pptx
 
Group Dynamics.pptx
Group Dynamics.pptxGroup Dynamics.pptx
Group Dynamics.pptx
 
Quality
Quality Quality
Quality
 
Review of related literature , researches, Notes taking.pptx
 Review of related literature , researches, Notes taking.pptx Review of related literature , researches, Notes taking.pptx
Review of related literature , researches, Notes taking.pptx
 
Mixed methods research in Education pptx
Mixed methods research in Education pptxMixed methods research in Education pptx
Mixed methods research in Education pptx
 
Principles of qualitative research. for slideshare.pptx
Principles of qualitative research. for slideshare.pptxPrinciples of qualitative research. for slideshare.pptx
Principles of qualitative research. for slideshare.pptx
 
Ethical issues in qualitative research
Ethical issues in qualitative researchEthical issues in qualitative research
Ethical issues in qualitative research
 
Narrative research for slideshare upload.pptx
Narrative research for slideshare upload.pptxNarrative research for slideshare upload.pptx
Narrative research for slideshare upload.pptx
 
Types of data in a qualitative research for slideshare upload.pptx
Types of data in a qualitative research for slideshare upload.pptxTypes of data in a qualitative research for slideshare upload.pptx
Types of data in a qualitative research for slideshare upload.pptx
 
Phenomenological Research
Phenomenological ResearchPhenomenological Research
Phenomenological Research
 
Normal Probability Curve by Dr. Neha Deo
Normal Probability Curve by Dr. Neha DeoNormal Probability Curve by Dr. Neha Deo
Normal Probability Curve by Dr. Neha Deo
 
Qualitative Research by Dr.Neha Deo
Qualitative Research by Dr.Neha DeoQualitative Research by Dr.Neha Deo
Qualitative Research by Dr.Neha Deo
 
Meaning, definitions & need of educational research.
Meaning, definitions & need of educational research.Meaning, definitions & need of educational research.
Meaning, definitions & need of educational research.
 
A Case study by Dr. Neha Deo
A Case study by Dr. Neha DeoA Case study by Dr. Neha Deo
A Case study by Dr. Neha Deo
 
Review of related literature & research studies by Dr. Neha Deo
Review of related literature & research studies by Dr. Neha DeoReview of related literature & research studies by Dr. Neha Deo
Review of related literature & research studies by Dr. Neha Deo
 
Ex post facto research (causal comparative) by Dr. Neha Deo
Ex post facto research (causal comparative) by Dr. Neha DeoEx post facto research (causal comparative) by Dr. Neha Deo
Ex post facto research (causal comparative) by Dr. Neha Deo
 
Descriptive research-Different types of survey by Dr. Neha Deo
Descriptive research-Different types of survey by Dr. Neha DeoDescriptive research-Different types of survey by Dr. Neha Deo
Descriptive research-Different types of survey by Dr. Neha Deo
 
Experimental method of Educational Research.
Experimental method of Educational Research.Experimental method of Educational Research.
Experimental method of Educational Research.
 
Correlation study-by Dr. Neha Deo
Correlation study-by Dr. Neha DeoCorrelation study-by Dr. Neha Deo
Correlation study-by Dr. Neha Deo
 
Research methodology-Variables-by Dr. Neha Deo
Research methodology-Variables-by Dr. Neha DeoResearch methodology-Variables-by Dr. Neha Deo
Research methodology-Variables-by Dr. Neha Deo
 

Recently uploaded

Temple of Asclepius in Thrace. Excavation results
Temple of Asclepius in Thrace. Excavation resultsTemple of Asclepius in Thrace. Excavation results
Temple of Asclepius in Thrace. Excavation results
Krassimira Luka
 
Gender and Mental Health - Counselling and Family Therapy Applications and In...
Gender and Mental Health - Counselling and Family Therapy Applications and In...Gender and Mental Health - Counselling and Family Therapy Applications and In...
Gender and Mental Health - Counselling and Family Therapy Applications and In...
PsychoTech Services
 
Nutrition Inc FY 2024, 4 - Hour Training
Nutrition Inc FY 2024, 4 - Hour TrainingNutrition Inc FY 2024, 4 - Hour Training
Nutrition Inc FY 2024, 4 - Hour Training
melliereed
 
BÀI TẬP BỔ TRỢ TIẾNG ANH LỚP 9 CẢ NĂM - GLOBAL SUCCESS - NĂM HỌC 2024-2025 - ...
BÀI TẬP BỔ TRỢ TIẾNG ANH LỚP 9 CẢ NĂM - GLOBAL SUCCESS - NĂM HỌC 2024-2025 - ...BÀI TẬP BỔ TRỢ TIẾNG ANH LỚP 9 CẢ NĂM - GLOBAL SUCCESS - NĂM HỌC 2024-2025 - ...
BÀI TẬP BỔ TRỢ TIẾNG ANH LỚP 9 CẢ NĂM - GLOBAL SUCCESS - NĂM HỌC 2024-2025 - ...
Nguyen Thanh Tu Collection
 
BÀI TẬP DẠY THÊM TIẾNG ANH LỚP 7 CẢ NĂM FRIENDS PLUS SÁCH CHÂN TRỜI SÁNG TẠO ...
BÀI TẬP DẠY THÊM TIẾNG ANH LỚP 7 CẢ NĂM FRIENDS PLUS SÁCH CHÂN TRỜI SÁNG TẠO ...BÀI TẬP DẠY THÊM TIẾNG ANH LỚP 7 CẢ NĂM FRIENDS PLUS SÁCH CHÂN TRỜI SÁNG TẠO ...
BÀI TẬP DẠY THÊM TIẾNG ANH LỚP 7 CẢ NĂM FRIENDS PLUS SÁCH CHÂN TRỜI SÁNG TẠO ...
Nguyen Thanh Tu Collection
 
RHEOLOGY Physical pharmaceutics-II notes for B.pharm 4th sem students
RHEOLOGY Physical pharmaceutics-II notes for B.pharm 4th sem studentsRHEOLOGY Physical pharmaceutics-II notes for B.pharm 4th sem students
RHEOLOGY Physical pharmaceutics-II notes for B.pharm 4th sem students
Himanshu Rai
 
REASIGNACION 2024 UGEL CHUPACA 2024 UGEL CHUPACA.pdf
REASIGNACION 2024 UGEL CHUPACA 2024 UGEL CHUPACA.pdfREASIGNACION 2024 UGEL CHUPACA 2024 UGEL CHUPACA.pdf
REASIGNACION 2024 UGEL CHUPACA 2024 UGEL CHUPACA.pdf
giancarloi8888
 
Bonku-Babus-Friend by Sathyajith Ray (9)
Bonku-Babus-Friend by Sathyajith Ray  (9)Bonku-Babus-Friend by Sathyajith Ray  (9)
Bonku-Babus-Friend by Sathyajith Ray (9)
nitinpv4ai
 
Wound healing PPT
Wound healing PPTWound healing PPT
Wound healing PPT
Jyoti Chand
 
math operations ued in python and all used
math operations ued in python and all usedmath operations ued in python and all used
math operations ued in python and all used
ssuser13ffe4
 
Lifelines of National Economy chapter for Class 10 STUDY MATERIAL PDF
Lifelines of National Economy chapter for Class 10 STUDY MATERIAL PDFLifelines of National Economy chapter for Class 10 STUDY MATERIAL PDF
Lifelines of National Economy chapter for Class 10 STUDY MATERIAL PDF
Vivekanand Anglo Vedic Academy
 
Philippine Edukasyong Pantahanan at Pangkabuhayan (EPP) Curriculum
Philippine Edukasyong Pantahanan at Pangkabuhayan (EPP) CurriculumPhilippine Edukasyong Pantahanan at Pangkabuhayan (EPP) Curriculum
Philippine Edukasyong Pantahanan at Pangkabuhayan (EPP) Curriculum
MJDuyan
 
spot a liar (Haiqa 146).pptx Technical writhing and presentation skills
spot a liar (Haiqa 146).pptx Technical writhing and presentation skillsspot a liar (Haiqa 146).pptx Technical writhing and presentation skills
spot a liar (Haiqa 146).pptx Technical writhing and presentation skills
haiqairshad
 
Benner "Expanding Pathways to Publishing Careers"
Benner "Expanding Pathways to Publishing Careers"Benner "Expanding Pathways to Publishing Careers"
Benner "Expanding Pathways to Publishing Careers"
National Information Standards Organization (NISO)
 
Stack Memory Organization of 8086 Microprocessor
Stack Memory Organization of 8086 MicroprocessorStack Memory Organization of 8086 Microprocessor
Stack Memory Organization of 8086 Microprocessor
JomonJoseph58
 
Pharmaceutics Pharmaceuticals best of brub
Pharmaceutics Pharmaceuticals best of brubPharmaceutics Pharmaceuticals best of brub
Pharmaceutics Pharmaceuticals best of brub
danielkiash986
 
Pengantar Penggunaan Flutter - Dart programming language1.pptx
Pengantar Penggunaan Flutter - Dart programming language1.pptxPengantar Penggunaan Flutter - Dart programming language1.pptx
Pengantar Penggunaan Flutter - Dart programming language1.pptx
Fajar Baskoro
 
BIOLOGY NATIONAL EXAMINATION COUNCIL (NECO) 2024 PRACTICAL MANUAL.pptx
BIOLOGY NATIONAL EXAMINATION COUNCIL (NECO) 2024 PRACTICAL MANUAL.pptxBIOLOGY NATIONAL EXAMINATION COUNCIL (NECO) 2024 PRACTICAL MANUAL.pptx
BIOLOGY NATIONAL EXAMINATION COUNCIL (NECO) 2024 PRACTICAL MANUAL.pptx
RidwanHassanYusuf
 
Electric Fetus - Record Store Scavenger Hunt
Electric Fetus - Record Store Scavenger HuntElectric Fetus - Record Store Scavenger Hunt
Electric Fetus - Record Store Scavenger Hunt
RamseyBerglund
 
Film vocab for eal 3 students: Australia the movie
Film vocab for eal 3 students: Australia the movieFilm vocab for eal 3 students: Australia the movie
Film vocab for eal 3 students: Australia the movie
Nicholas Montgomery
 

Recently uploaded (20)

Temple of Asclepius in Thrace. Excavation results
Temple of Asclepius in Thrace. Excavation resultsTemple of Asclepius in Thrace. Excavation results
Temple of Asclepius in Thrace. Excavation results
 
Gender and Mental Health - Counselling and Family Therapy Applications and In...
Gender and Mental Health - Counselling and Family Therapy Applications and In...Gender and Mental Health - Counselling and Family Therapy Applications and In...
Gender and Mental Health - Counselling and Family Therapy Applications and In...
 
Nutrition Inc FY 2024, 4 - Hour Training
Nutrition Inc FY 2024, 4 - Hour TrainingNutrition Inc FY 2024, 4 - Hour Training
Nutrition Inc FY 2024, 4 - Hour Training
 
BÀI TẬP BỔ TRỢ TIẾNG ANH LỚP 9 CẢ NĂM - GLOBAL SUCCESS - NĂM HỌC 2024-2025 - ...
BÀI TẬP BỔ TRỢ TIẾNG ANH LỚP 9 CẢ NĂM - GLOBAL SUCCESS - NĂM HỌC 2024-2025 - ...BÀI TẬP BỔ TRỢ TIẾNG ANH LỚP 9 CẢ NĂM - GLOBAL SUCCESS - NĂM HỌC 2024-2025 - ...
BÀI TẬP BỔ TRỢ TIẾNG ANH LỚP 9 CẢ NĂM - GLOBAL SUCCESS - NĂM HỌC 2024-2025 - ...
 
BÀI TẬP DẠY THÊM TIẾNG ANH LỚP 7 CẢ NĂM FRIENDS PLUS SÁCH CHÂN TRỜI SÁNG TẠO ...
BÀI TẬP DẠY THÊM TIẾNG ANH LỚP 7 CẢ NĂM FRIENDS PLUS SÁCH CHÂN TRỜI SÁNG TẠO ...BÀI TẬP DẠY THÊM TIẾNG ANH LỚP 7 CẢ NĂM FRIENDS PLUS SÁCH CHÂN TRỜI SÁNG TẠO ...
BÀI TẬP DẠY THÊM TIẾNG ANH LỚP 7 CẢ NĂM FRIENDS PLUS SÁCH CHÂN TRỜI SÁNG TẠO ...
 
RHEOLOGY Physical pharmaceutics-II notes for B.pharm 4th sem students
RHEOLOGY Physical pharmaceutics-II notes for B.pharm 4th sem studentsRHEOLOGY Physical pharmaceutics-II notes for B.pharm 4th sem students
RHEOLOGY Physical pharmaceutics-II notes for B.pharm 4th sem students
 
REASIGNACION 2024 UGEL CHUPACA 2024 UGEL CHUPACA.pdf
REASIGNACION 2024 UGEL CHUPACA 2024 UGEL CHUPACA.pdfREASIGNACION 2024 UGEL CHUPACA 2024 UGEL CHUPACA.pdf
REASIGNACION 2024 UGEL CHUPACA 2024 UGEL CHUPACA.pdf
 
Bonku-Babus-Friend by Sathyajith Ray (9)
Bonku-Babus-Friend by Sathyajith Ray  (9)Bonku-Babus-Friend by Sathyajith Ray  (9)
Bonku-Babus-Friend by Sathyajith Ray (9)
 
Wound healing PPT
Wound healing PPTWound healing PPT
Wound healing PPT
 
math operations ued in python and all used
math operations ued in python and all usedmath operations ued in python and all used
math operations ued in python and all used
 
Lifelines of National Economy chapter for Class 10 STUDY MATERIAL PDF
Lifelines of National Economy chapter for Class 10 STUDY MATERIAL PDFLifelines of National Economy chapter for Class 10 STUDY MATERIAL PDF
Lifelines of National Economy chapter for Class 10 STUDY MATERIAL PDF
 
Philippine Edukasyong Pantahanan at Pangkabuhayan (EPP) Curriculum
Philippine Edukasyong Pantahanan at Pangkabuhayan (EPP) CurriculumPhilippine Edukasyong Pantahanan at Pangkabuhayan (EPP) Curriculum
Philippine Edukasyong Pantahanan at Pangkabuhayan (EPP) Curriculum
 
spot a liar (Haiqa 146).pptx Technical writhing and presentation skills
spot a liar (Haiqa 146).pptx Technical writhing and presentation skillsspot a liar (Haiqa 146).pptx Technical writhing and presentation skills
spot a liar (Haiqa 146).pptx Technical writhing and presentation skills
 
Benner "Expanding Pathways to Publishing Careers"
Benner "Expanding Pathways to Publishing Careers"Benner "Expanding Pathways to Publishing Careers"
Benner "Expanding Pathways to Publishing Careers"
 
Stack Memory Organization of 8086 Microprocessor
Stack Memory Organization of 8086 MicroprocessorStack Memory Organization of 8086 Microprocessor
Stack Memory Organization of 8086 Microprocessor
 
Pharmaceutics Pharmaceuticals best of brub
Pharmaceutics Pharmaceuticals best of brubPharmaceutics Pharmaceuticals best of brub
Pharmaceutics Pharmaceuticals best of brub
 
Pengantar Penggunaan Flutter - Dart programming language1.pptx
Pengantar Penggunaan Flutter - Dart programming language1.pptxPengantar Penggunaan Flutter - Dart programming language1.pptx
Pengantar Penggunaan Flutter - Dart programming language1.pptx
 
BIOLOGY NATIONAL EXAMINATION COUNCIL (NECO) 2024 PRACTICAL MANUAL.pptx
BIOLOGY NATIONAL EXAMINATION COUNCIL (NECO) 2024 PRACTICAL MANUAL.pptxBIOLOGY NATIONAL EXAMINATION COUNCIL (NECO) 2024 PRACTICAL MANUAL.pptx
BIOLOGY NATIONAL EXAMINATION COUNCIL (NECO) 2024 PRACTICAL MANUAL.pptx
 
Electric Fetus - Record Store Scavenger Hunt
Electric Fetus - Record Store Scavenger HuntElectric Fetus - Record Store Scavenger Hunt
Electric Fetus - Record Store Scavenger Hunt
 
Film vocab for eal 3 students: Australia the movie
Film vocab for eal 3 students: Australia the movieFilm vocab for eal 3 students: Australia the movie
Film vocab for eal 3 students: Australia the movie
 

Parametric Test -T test.pptx by Dr. Neha Deo

  • 3. Hypothesis is a tentative generalization, the validity of which remains to be tested. Hypothesis is a conjectural statement between two or more variables. The research or scientific hypothesis is a formal affirmative statement predicting a single research outcome, a tentative explanation of the relationship between two or more variables.
  • 4. Hypothesis guides the thinking process. Hypothesis is a statement temporarily accepted as true in the light of what is known at that time. Hypo + Thesis So it is a lower level thesis. The thing might be converted in to thesis.
  • 5. • In experimental method it is must. • In survey method when significance of difference between two groups is to be tested. • In correlation study to test whether the correlation is significant or not. • Sometimes in historical research also. • But it is not compulsory in each & every research.
  • 6. Types of Hypothesis- Hypothesis-types Main Research Positive H1 States that there will be difference Statistical Null H0 States that there will not be any difference or difference will be zero.
  • 8. Some basic terms • Parameter-P -Population • Statistics-S-Sample • Sampling Unit-It is one of the units selected for the purpose of sampling. • Sampling Error= (P-S) • Bias- It is a systematic tendency which causes differences between results and facts. • Sampling Distribution- S1, S2,S3, S4, S5,……..SN M1, M2, M3, M4, M5,…….MN 112, 113, 110, 109, 119,………… • Sampling distribution of Mean • Standard Error • Standard error of the mean- • M pop=M+-(SEM×1.98)……….0.05 level • Mpop=M+-(SEM× 2.58)…………0.01 levle
  • 9. • M pop=M+-(SEM ×1.98)……….0.05 level….95% • M pop=M+-(SEM ×2.58)………0.01 level….99% Confidence intervals SEM=0.5, SEM ×2.58=1.29 Mpop=M+1.29=155+1.29=156.29 Mpop=M-1.29=155-1.29=153.71 153.71……..156.29 M=155, S.D. =10, SEM=0.5, N=400 SEM ×1.98=0.5 ×1.98=0.99 155+0.99=155.99 155-099=154.01
  • 10. What does a parameter mean? What does parametric mean? • Parameter-a numerical or other measurable factor forming one of a set that defines a system or sets the conditions of its operation. • Parametric—In STATISTICS • assuming the value of a parameter for the purpose of analysis. • "variables with normal distribution were compared by means of parametric tests"
  • 12. Central limit theorem • The central limit theorem (CLT) states that the distribution of sample means approximates a normal distribution as the sample size gets larger, regardless of the population's distribution. • Sample sizes equal to or greater than 30 are often considered sufficient for the CLT to hold. • A key aspect of CLT is that the average of the sample means and standard deviations will equal the population mean and standard deviation. • A sufficiently large sample size can predict the characteristics of a population more accurately. • Standard Deviation of the distribution of means (Standard error) is smaller than the standard deviation of any selected sample.
  • 13. Z Test T Test F Test ANOVA ANCOVA
  • 14. Student’s t distribution In probability and statistics Student's t-distribution (or simply the t distribution) is any member of a family of continuous probability distributions that arise when estimating the mean of a normally distributed population in situations where the sample size is small and the population's standard deviation is unknown. It was developed by English statistician William Sealy Gosset under the pseudonym "Student".
  • 16. Standard Error of Mean • Standard Error of Mean: As per the central limit theorem, Standard deviation of the distribution of means is always smaller than the standard deviation of one samples' standard deviation • Formula of standard error of mean σ • SEM= √N
  • 17. ‘ ‘t’ Non correlate d groups Small groups. df=N1+N2- 1 large groups Correlated groups Two groups matched for mean & standard deviation. df=N1+N2-3 Single group pre test post test design. df=N-1 Two equivalent groups’ matched by pairs. df=N-1
  • 18.
  • 19. Degrees of Freedom • Degrees of freedom refers to the maximum number of logically independent values. • For Mean: degrees of freedom df= N • For Standard Deviation, degrees of freedom df=N-1 • For Coefficient of correlation, df=N-2
  • 20. Level of Significance • Significance Levels. The significance level for a given hypothesis test is a value for which a P- value less than or equal to is considered statistically significant. Typical values for levels of significance are are 0.1, 0.05, and 0.01. These values correspond to the probability of observing such an extreme value by chance.
  • 21. Steps of t- test 1. Find the difference between the two Means 2. Find the standard error of the two Means 3.Find the standard error of the difference between the two means (Use appropriate formula) 4. Find out t ratio.
  • 22. Steps of t- test 5. Find out degrees of freedom 6.Decide the level of significance: o.o1 or 0.05 7. Compare the obtained t-value with the table value –D table 8.Take the Decision.(Reject or not to reject the null hypothesis) 9.Write down the findings as per the decision taken..
  • 23. t- testing. • M1=47, Sigma1=6, N1=N2=50 • M2=52, Sigma2=5 • DM=5 • SEDM=0.707 • df=49 • t=DM/SEDM=7.07 • The table value at 0.01 level of significance & for 49 degrees of freedom=2.68. • obtained t value is 7.07 which is greater than the table value. So null hypothesis is to be rejected. So Research hypothesis is to be accepted. Hence there found a significant increase in the post test mean as compared to the pre test mean. Hence the programme was found to be effective.
  • 24.
  • 25. Examples Two equivalent groups Experimental design Sr. No. Controlled Experimental A B 1 23 24 2 35 37 3 21 25 4 43 47 5 35 35 6 37 39 7 27 29 8 40 40 9 25 27 10 31 33 11 29 28 12 38 39 13 39 43 14 18 25 15 26 28 One group pre post test experimental design Sr. No. Pre Test Post Test 1 39 41 2 50 52 3 40 43 4 32 33 5 60 63 6 51 57 7 35 36 8 29 32 9 58 61 10 41 49 11 38 40 12 53 58 13 54 53 14 37 38 15 41 41 Two independent groups Sr. No Aided Sr. No. Unaided 1 123 1 139 2 120 2 141 3 110 3 124 4 100 4 123 5 111 5 137 6 137 6 95 7 127 7 89 8 134 8 132 9 99 9 117 10 133 10 128 11 113 11 135 12 134 12 100 13 127 13 101 14 128 14 128 15 127 16 141 Q.Find out whether the difference between the means is significant or not
  • 26. How to calculate “t” ratio Manually using calculator Using Microsoft Excel Using Software like SPSS https://www.graphpad.com/quickcalcs/ttest2/ Using online calculators