Download to read offline


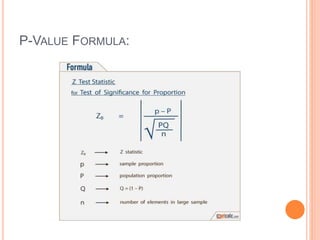
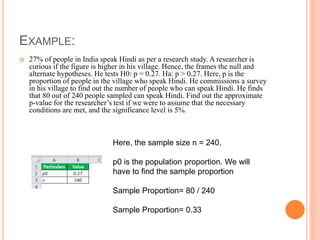


The document defines p-value as a statistical measurement used to validate a hypothesis against observed data, with lower p-values indicating greater statistical significance. It provides an example of using a p-value to test the hypothesis that the proportion of people speaking Hindi in a village is higher than 27% based on survey data. The p-value is calculated to be 0.0183, which is less than the 5% significance level, so the null hypothesis that the proportion is 27% is rejected.