Observations And Inferences
•Download as PPTX, PDF•
26 likes•25,579 views

The document discusses observations and inferences. It explains that observations are what is directly noticed, while inferences are conclusions or explanations drawn from those observations. It also distinguishes between quantitative observations, which involve measurements, and qualitative observations, which describe characteristics. The summary asks the reader to consider the differences between observations and inferences, and between quantitative and qualitative observations, and how different inferences can be drawn from the same observations.

Recommended
More Related Content
What's hot
What's hot (20)
Viewers also liked
Viewers also liked (20)
Similar to Observations And Inferences
Similar to Observations And Inferences (20)
More from Joshua Grasso
More from Joshua Grasso (20)
Recently uploaded
Recently uploaded (20)
Observations And Inferences
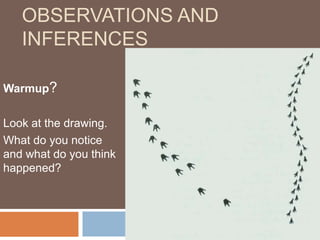
- 1. Observations and Inferences Warmup? Look at the drawing. What do you notice and what do you think happened?
- 2. Observations and Inferences How does your story change?
- 3. Observations and Inferences How does your story change?
- 4. Observations and Inferences What do you observe? What do you infer? Compare what you think now to your earlier written accounts.
- 5. Observations and Inferences Observations are what you notice Inferencesare your reactions, thoughts or explanations
- 6. Write one observation. Write one inference
- 7. Write one observation. Write one inference
- 8. Write one observation. Write one inference
- 9. Write one observation. Write one inference
- 10. Write one observation. Write one inference
- 11. Write one observation. Write one inference
- 12. Write one observation. Write one inference
- 13. Write one observation. Write one inference
- 14. Quantitative vs Qualitative Quantitative observations are ones that are based on a QUANTITY. These would be measurements. Weight Height Length Qualitative Observations. These are based on characteristics. Color Size Texture
- 15. Summary What is the difference between an observation and an inference. What is the difference between a quantitative observation and a qualitative observation. How can people have different inferences about the same observations.
- 16. Scientific Method Scientists do two main types of studies. Experimental Observational Study, Observe, analyze Control, Test