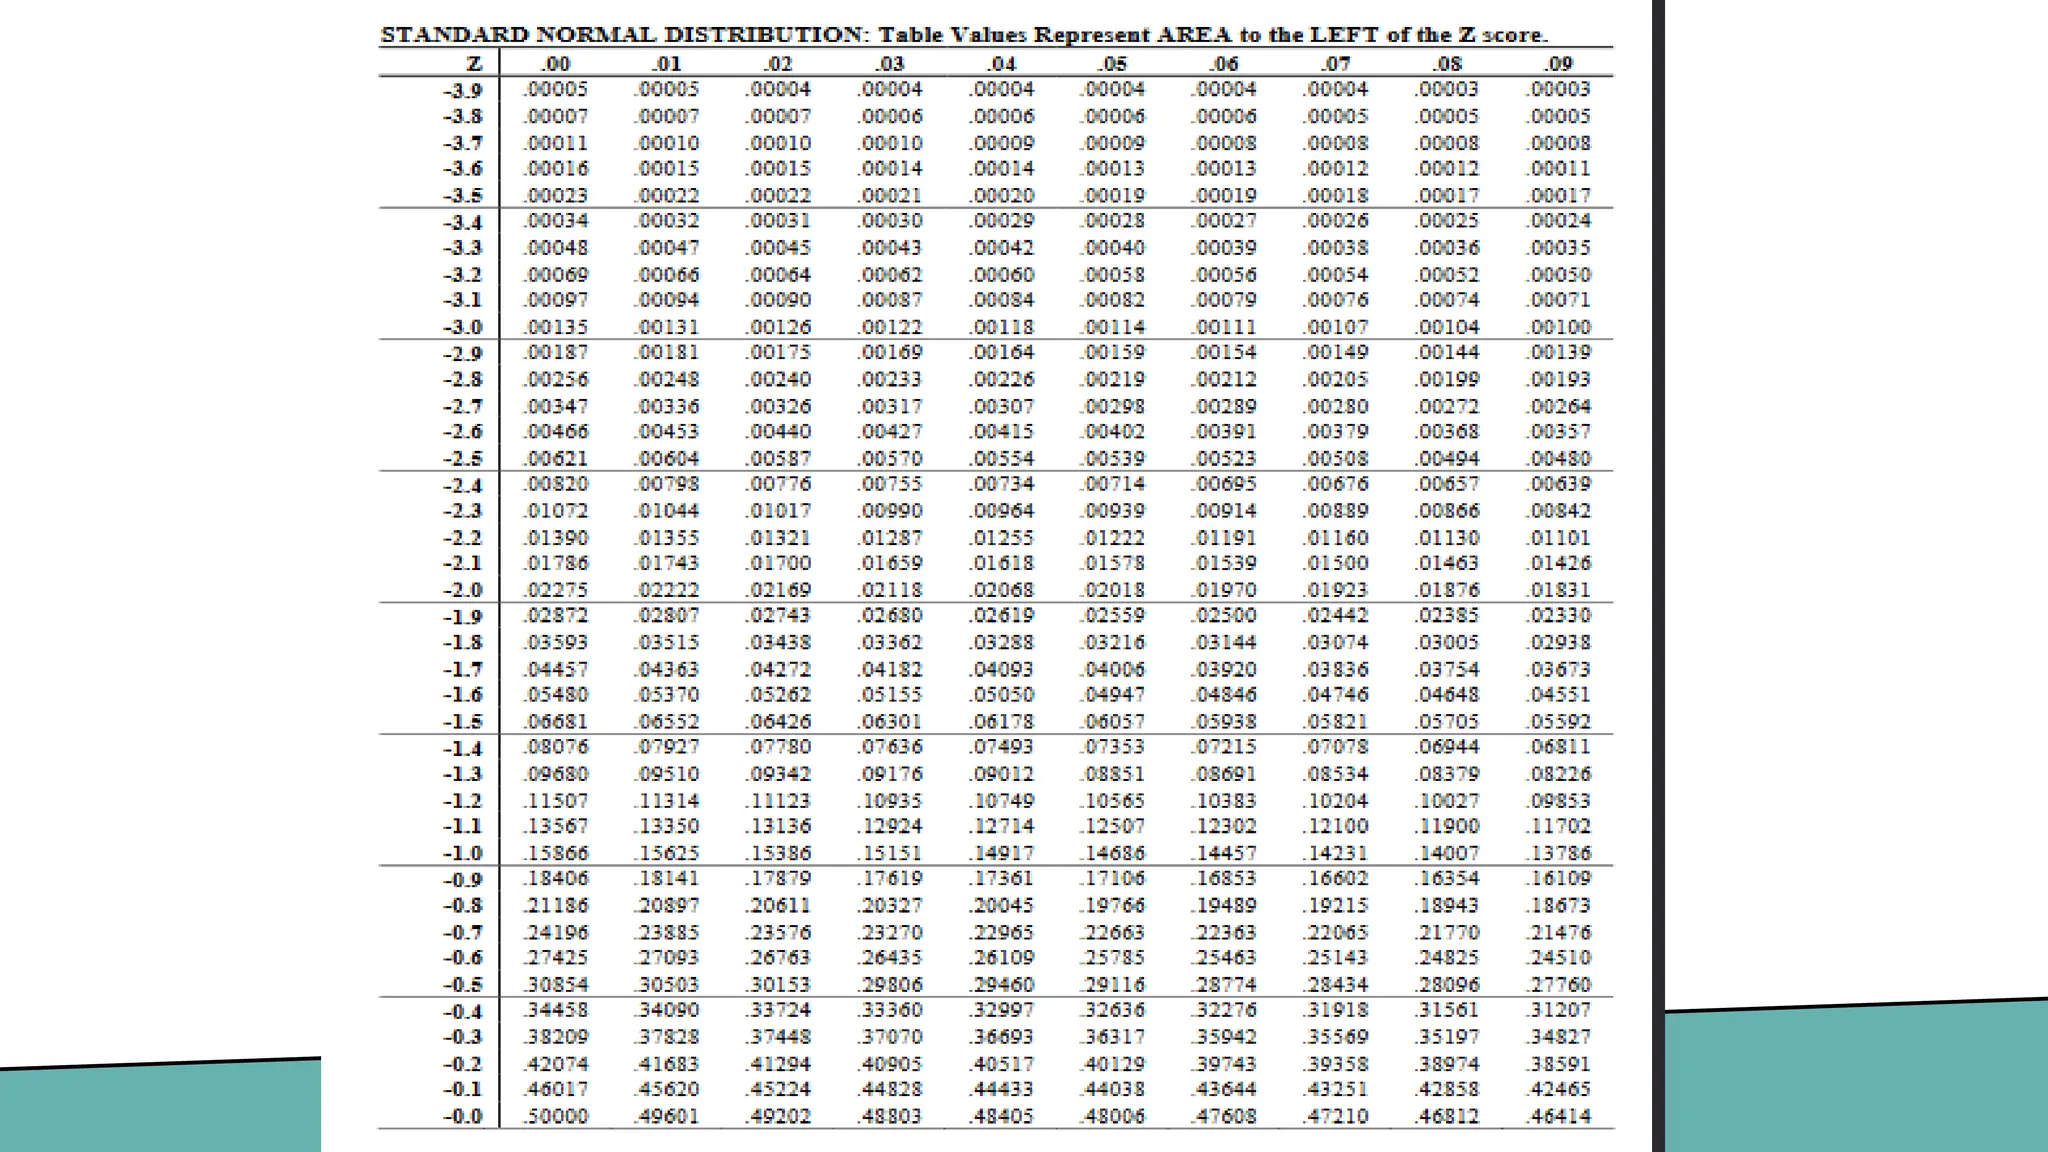
1. 6.53
Z SCORE ( STANDARD
NORMAL
DISTRIBUTION)
Mr. Julius C. Reyes
2. Standard Normal Distribution
A normal distribution is a bell-shaped distribution. Theoretically, a normal distribution
is continuous and may be depicted as a density curve, such as the one below. The
distribution plot below is a standard normal distribution. A standard normal
distribution has a mean of 0 and standard deviation of 1. This is also known as the z
distribution.
3. A normal distribution, data is symmetrically distributed with no skew. When plotted
on a graph, the data follows a bell shape, with most values clustering around a
central region and tapering off as they go further away from the center.
Normal distributions are also called Gaussian distributions or bell curves because of
their shape.
What are the properties of normal distributions?
Normal distributions have key characteristics that are easy to spot in graphs:
• The mean, median and mode are exactly the same.
• The distribution is symmetric about the mean—half the values fall below the mean
and half above the mean.
• The distribution can be described by two values: the mean and the standard
deviation.
4. 4
MEASURES OF RELATIVE POSITIONS
Z- Score
The z score let us know of how far away a
data point is from the mean of its set, in
units of the standard deviation of the set. In
other words, once you have calculated the
mean of a data set and its distribution, you
can calculate how many of these standard
deviations separate each data point from
the mean, that is the z score for each value.
5. How to calculate a z score
In order to calculate the z score of a population we follow the next formula:
Population Sample
6. Example 1
Using Z-score to Compare the Variation in Different Populations, look at the next case:
Charlie got a mark of 85 on a math test which had a mean of 75 and a standard
deviation of 5. Daisy got a mark of 75 on an English test which had a mean of 69 and
a standard deviation of 2. Relative to their respective mean and standard deviation,
who got the better grade?
We have the following information:
ZCh = Z Score for Charlie ZD = Z Score for Daisy
x = 85 x = 75
μ = 75 μ = 69
σ = 5 σ = 2
7. Solution
Charlie Daisy
Zch =
𝑥−µ
σ
ZD =
𝑥−µ
σ
Zch =
85−75
5
ZD =
75−69
2
Zch =
10
5
= 2 ZD =
6
2
= 3
After we have gotten the
corresponding z scores, how do
we know which of their grades is
better? Well, the results from
equation 3 tell us that Charlie got
a test mark 2 standard deviations
higher than the mean of the class,
while Daisy got a mark that is 3
standard deviations higher than
the mean in her class. Therefore,
proportionally speaking, Daisy did
better within her class in
comparison to Charlie.
8.
9. Area Under Normal Curve
To find a specific area under a normal curve, find
the z-score of the data value and use a Z-Score Table
to find the area. A Z-Score Table, is a table that shows
the percentage of values (or area percentage) to the left
of a given z-score on a standard normal distribution.
10.
11.
12. Case 1:
Use the Z-table to see the area under the value (x)
In the Z-table top row and the first column corresponds to the Z-
values and all the numbers in the middle correspond to the areas.
For example, a Z-score of -1.53 has an area of 0.0630 to the left of
it. In other words, p(Z<-1.53) = 0.0630.
For example, a Z-score of 0.83 has an area of 0.7967 to the left of
it. So, the Area to the right is 1 – 0.7967 = 0.2033.
13. Example
1. Find the area under the normal curve from
a. z≤ 1.18
b. z≥ 1.18
Z ≤ 1.18 = .88100
Z ≥ 1.18 = 1 − .88100
= .11900
14. Find
P(z < 2.37)
Solution
We use the table. Notice the picture on the table has shaded region
corresponding to the area to the left (below) a z-score. This is exactly
what we want. Below are a few lines of the table.
15. Find
P(z > 1.82)
Solution
In this case, we want the area to the right of 1.82. This is not what is
given in the table. We can use the identity
P(z > 1.82) = 1 - P(z < 1.82)
reading the table gives
P(z < 1.82) = .9656
Our answer is
P(z > 1.82) = 1 - .9656 = .0344
16. Find
P(-1.18 < z < 2.1)
Solution
Once again, the table does not exactly handle this type of area. However, the area
between -1.18 and 2.1 is equal to the area to the left of 2.1 minus the area to the left
of -1.18.
That is P(-1.18 < z < 2.1) = P(z < 2.1) - P(z < -1.18)
To find P(z < 2.1) we rewrite it as P(z < 2.10) and use the table to get
P(z < 2.10) = .9821.
The table also tells us that
P(z < -1.18) = .1190
Now subtract to get
P(-1.18 < z < 2.1) = .9821 - .1190 = .8631
17. Suppose that the books in a math teacher's office have an average length of
350 pages, with a standard deviation of 90 pages. What percentage of this math
teacher's books are longer than 500 pages?
First, calculate the Z-score: z=
𝒙 −µ
σ
The proportion of Z-scores to the left of
1.67 is 0.9525.
Another way to write this in math notation
is P(z≤1.67)=0.9525
However, the example asked for the percentage of books that have page counts
greater than 500 pages. In other words, the percentage to the right of 1.67. To find
this percentage, subtract the table value from 1:
1−0.9525=0.0475
Thus, roughly 4.75% of books in the math teacher's collection are longer than 500
pages. Another way to write this is P(z>1.67)=0.0475.