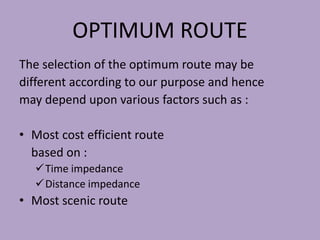
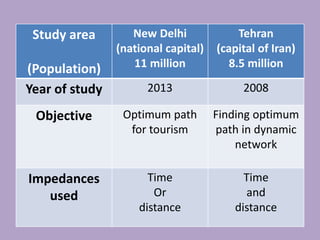
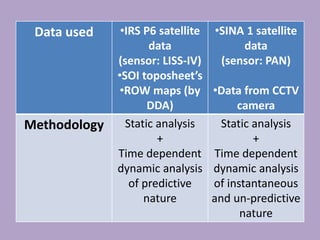
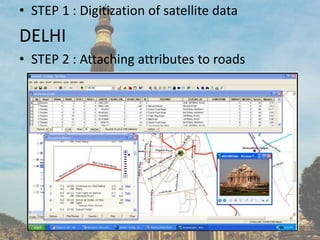
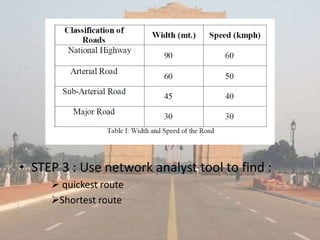
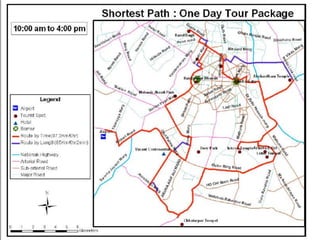
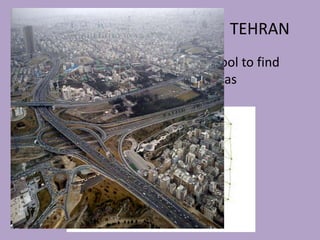
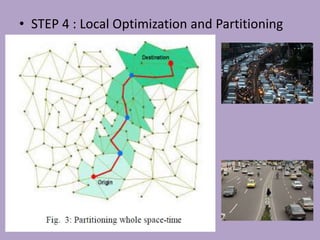
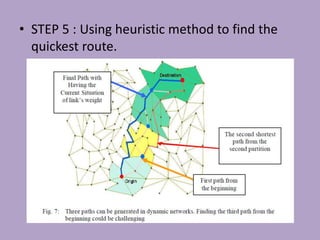
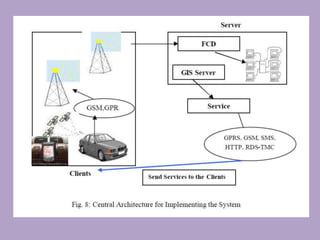
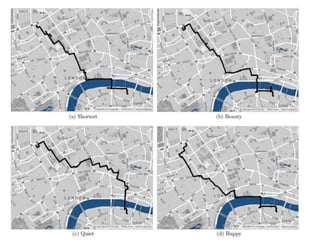
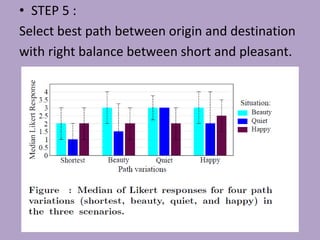
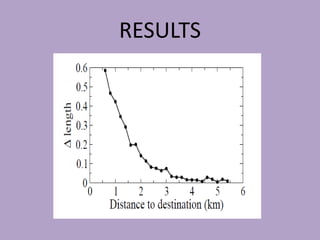
2. What is network analysis ?
It enables you to solve problems such as :
• Finding most efficient travel route
• generating travel directions
• finding closest facility
• Defining service areas
3.
4. OPTIMUM ROUTE
The selection of the optimum route may be
different according to our purpose and hence
may depend upon various factors such as :
• Most cost efficient route
based on :
Time impedance
Distance impedance
• Most scenic route
6. Study area
(Population)
New Delhi
(national capital)
11 million
Tehran
(capital of Iran)
8.5 million
Year of study 2013 2008
Objective Optimum path
for tourism
Finding optimum
path in dynamic
network
Impedances
used
Time
Or
distance
Time
and
distance
7. Data used •IRS P6 satellite
data
(sensor: LISS-IV)
•SOI toposheet’s
•ROW maps (by
DDA)
•SINA 1 satellite
data
(sensor: PAN)
•Data from CCTV
camera
Methodology Static analysis
+
Time dependent
dynamic analysis
of predictive
nature
Static analysis
+
Time dependent
dynamic analysis
of instantaneous
and un-predictive
nature
8. • STEP 1 : Digitization of satellite data
DELHI
• STEP 2 : Attaching attributes to roads
9. • STEP 3 : Use network analyst tool to find :
quickest route
Shortest route
10.
11.
12. • STEP 1 : Digitization.
• STEP 2 : Attaching attributes.
• STEP 3 : Use of network analyst tool to find
the shortest route using distance as
impedance.
TEHRAN
13. • STEP 4 : Local Optimization and Partitioning
14. • STEP 5 : Using heuristic method to find the
quickest route.
15.
16. RESULTS OF THE
COMPARITIVE STUDY
• Travel time of a journey is a function of traffic
situation and can never have a predictive
nature (as considered in Delhi case study).
• The dynamic analysis with time having a
predictive nature will always give results
including approximation.
17. THE SHORTEST ROUTE TO
HAPPINESS
AIM : to suggest user a short and pleasant path
between their current location and destination .
18. SOURCES OF DATA
• Crowd sourcing
• Flickr , foursquare metadata
• Google street view
• GPS
• Virtual geographic system
• geographical map
19. METHODOLOGY
• STEP 1 :
Vectorization of the maps available and marking
all the location of the city under study.
20. • STEP 2 :
Crowdsourcing people’s perceptions of these
locations along three dimensions:
beauty
Quiet
happy
• STEP 3 :
An origin (O) and a destination (D) are selected
and M shortest paths between them are found
using EPPSTEIN’S ALGORITHM.
23. • STEP 4 :
Assign score to the paths along each of three
parameters, i.e. beauty, quiet and happy.
Shortest Beauty Happy Quiet
a b d c
b c b d
c a a c
d d c a
24.
25. • STEP 5 :
Select best path between origin and destination
with right balance between short and pleasant.
27. • On an average the suggested paths are only
12% longer .
• Beautiful paths are on an average 28% more
beautiful then shortest paths.
28. REFERENCES
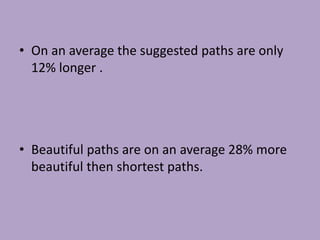
• Research paper “The shortest path to happiness : Recommending
Beautiful, Quiet and Happy routes in the city” by Yahoo labs [Barcelona,
(Spain)] and University of Torino (Italy).
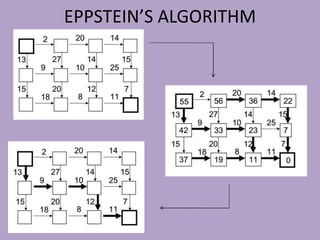
• http://www.isi.edu/natural-language/people/epp-cs562.pdf (for
eppstein’s algorithm).
• IDOSI published “New Method for Finding Optimal Path in Dynamic
Networks” (world applied sciences journal 3 (supple 1) 2008)
• “identification of optimum path for tourist places using GIS based network
analysis” (IJARSGG (2013) Vol. 1, No. 2, 34-38)