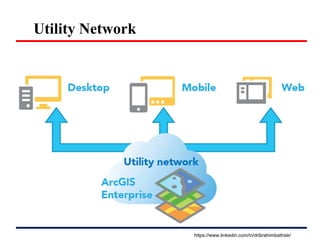
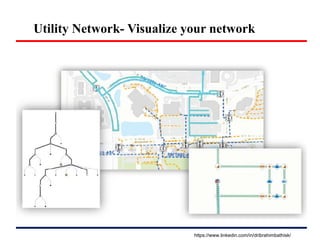
SlideShare a Scribd company logo
Part 3 Utility Network
Dr. IBRAHIM BATHIS K
https://www.linkedin.com/in/dribrahimbathisk/
http://pro.arcgis.com/en/pro‐app/help/data/utility‐network/what‐is‐a‐utility‐network‐.htm
https://www.linkedin.com/in/dribrahimbathisk/
Utility Network (ESRI)
Utility, Pipeline, and Telecommunications
 The utility network is the main component users will work with
when managing utility and telecom networks within ArcGIS.
 The common thread in these challenges is the network's
relationship to location.
Where are customers, sensors, meters, workers, and
waste? -- That's where GIS comes in.
https://www.linkedin.com/in/dribrahimbathisk/
Utility Network
 The utility network combined with a transaction model, attribute
rules, editing tools, and more allows users to completely model and
analyze their complex network systems for water, gas, electric,
telecom, sewer, stormwater, and other utilities.
 The capabilities to manage and analyze network data will be
delivered through the ArcGIS Utility Network Management
extension to ArcGIS Enterprise.
 The extension, which includes the utility network, provides the
ability to access all capabilities through a services-based
architecture callable from any device or application that supports
web services.
https://www.linkedin.com/in/dribrahimbathisk/
Utility Network….
 Knowing asset locations, their conditions, and their
relationship to one another is fundamental to managing them.
 But the GIS data was often kept from the people who needed it
most: field workers, executives, managers, service technicians,
and accountants.
 Limited resources and increasingly complex networks
Demands - Companies need a new wave of GIS-based
network management with more functionality, added
flexibility, and better access.
 The Utility Network lets users create, manage, and share
electric, water, wastewater, gas, district heating, and
telecommunications asset data.
https://www.linkedin.com/in/dribrahimbathisk/
Utility Network
 It is designed to model all of the components that make up your
system- such as wires, pipes, valves, zones, devices, and circuits and
allows you to build real world behavior into the features you model.
With the utility network you can:
 Create and edit features that model every type of utility equipment.
 Discover how features in the network are connected.
 Trace how resources, such as gas, water, and electricity, flow
through the network.
 Provide an operational view of how all the dynamic devices of your
utility are presently configured.
 Analyze how the network is affected by real world events like storms,
outages, or equipment failure.
https://www.linkedin.com/in/dribrahimbathisk/
Utility Network
 The utility network uses a services-based architecture which allows you
to share and collaborate on it everywhere.
 In command and dispatch centers, in design and engineering offices, on
desktop and mobile devices, in the office, and in the field.
 The utility network leverages the entire ArcGIS platform to create a
seamless GIS system that presents an accurate and unified view on the
status of your systems.
 This information can be served from your portal and be made readily
available on every device from desktop to smart phones.
https://www.linkedin.com/in/dribrahimbathisk/
Utility Network
https://www.linkedin.com/in/dribrahimbathisk/
Utility Network- Visualize your network
https://www.linkedin.com/in/dribrahimbathisk/
Utility Network- Visualize your network
The utility network offers a number of different ways to view
network system and assets:
 View thematic cartographic maps for different use cases, such as
customer service, field collection and inspection, or distribution
management.
 Create network diagrams that allow you to readily check
network connectivity and create logical views of your network
in a more simplified, symbolic representation of the information.
 View inside complex assemblies of devices and lines and
manage how assets are connected within them.
 Visualize a selected pressure zone or circuit with a display filter.
 Analyze your network
https://www.linkedin.com/in/dribrahimbathisk/
Utility Network- Analyze your network
https://www.linkedin.com/in/dribrahimbathisk/
Utility Network- Analyze your network
The utility network has an array of analysis and tracing tools to support a
large variety of analytic workflows:
 Perform inspection of the network in the aftermath of an event such as
a severe storm.
 Determine the number of customers with access to your resource. For
example, you can create a load summary report to present the number
of customers being fed by specific circuit in an electric network.
 Trace network features upstream or downstream from a given
location. For example, water utilities can determine which valves to
shut off when a pipe bursts.
 Model multiple utility systems within one utility network and run
tracing analysis across all of them. For example, an outage from an
electrical network can affect the delivery of another resource such as
gas or water. You can run a trace across all systems involved, see
where the problems lie, and decide on the best course of action.
https://www.linkedin.com/in/dribrahimbathisk/
Utility Network- Benefits of a utility network
 A utility network supports the requirements of utilities in delivering resources
to customers safely, reliably, and economically.
 It can serve as the system of record for the assets of a utility and provide
information about the present state of the utility system.
 Optimized for high performance and scalable to large utilities
 Models how components of your system are connected
 Represents dense areas of your system without map clutter
 Enforces data integrity and reduces data entry errors
 Enables advanced analysis of your network
 Provides a comprehensive view of your network
https://www.linkedin.com/in/dribrahimbathisk/
Utility Network - Functionality
 Flexibility: Users can edit the network data seamlessly via web services.
 Asset connectivity: Users can mine the behavior of networks.
 For example, the technology can simulate the connection of a pipe to a valve or a
transformer to an electrical conductor.
 This can be done automatically by placing the network elements at the same
location or by specifying which objects are connected to each other.
 Containment: Users can place objects or devices within structures, such as
buildings or cabinets.
 For example, the Utility Network can show the internal electrical
connections of a substation inside the substation building or the internal
gas piping configuration within a gas meter station building.
https://www.linkedin.com/in/dribrahimbathisk/
Utility Network – Functionality…
 Attachment:
 Users can model network element attachments, such as how a
transformer or telephone cable is affixed to a pole.
 Quality:
 The technology leverages built-in, industry-standard rules that
guard against users making data entry mistakes.
 For example: Editors would not be allowed to connect a high-
voltage cable to a low-voltage one.
 Modeling:
 Users can specify where sources of electricity, gas, or water are
located to facilitate network simulation.
 They can also model devices that have many connection points,
such as complex switches and valves.
https://www.linkedin.com/in/dribrahimbathisk/
Utility Network – Advantages
Increased productivity:
 Users have access to shortcuts, templates, and streamlined workflows within
the software.
Tracing:
 The technology contains extensive, out-of-the-box tracing tools.
Visualization:
 The Utility Network supports 3D.
Schematics:
 It has an assortment of built-in network diagrams and one-line tools
(schematic representations of electric, water, and gas networks).
Workflows:
 The Utility Network helps users with editing, giving them guidance at every
step of the process.
 The technology continues to support the concept of long transactions as well,
which enable users to create future changes to the network model that go into
effect after a certain time.
https://www.linkedin.com/in/dribrahimbathisk/
Utility Network
Utility Network toolbox
• The Utility Network toolbox contains a number of tools that can be used to
create and manage the utility network layer, subnetworks, associations,
network topology, tracing, diagrams, and rules.
• Some of these tools can also be opened from the Utility Network tab as
described previously
https://www.linkedin.com/in/dribrahimbathisk/
Utility Network - Vocabulary
Asset group
 The asset group of a feature defines its broad classification.
 The ASSETGROUP field for each network feature class is defined as the
subtype field.
 Further classification of features is added by assigning attribute domains at
the subtype level on the ASSETTYPE field.
 A transformer is an asset group of a transformer in an electric device
network feature class.
Asset type
The asset type attribute of a feature defines a finer classification for each asset
group in a network layer.
 The ASSETTYPE field in a network layer is a text field linked to an
attribute domain of values.
 A power transformer is an asset type of a transformer in an electric device
network feature class.
https://www.linkedin.com/in/dribrahimbathisk/
Utility Network – Vocabulary..
Associations
Associations are created to associate features with one another.
 A connectivity association specifies that a transformer is connected to a fuse.
 A structural attachment association specifies that a capacitor is attached to a
pole.
 A containment association specifies that a vault can contain valves and pipes
Association rules
Association rules prevent an editor from adding logically invalid feature
associations in a network. Association rules define the valid ways network features
can be associated with each other.
 Connectivity rule: A transformer can connect to a fuse.
 Structural attachment rule: A capacitor can be attached to a pole.
 Containment rule: A vault can contain valves and pipes.
https://www.linkedin.com/in/dribrahimbathisk/
Utility Network – Vocabulary..
Connectivity
 Network features in a utility network can be connected to each other in two basic
ways: either with a shared endpoint, vertex, or point (common x-, y-, and z-
values), or with a defined connectivity association between two features that are
not spatially coincident. This is called connectivity.
 A pump placed at the end of a water pipe will have connectivity established
because of the shared location.
Connectivity association
 A connectivity association allows the individual features to be represented in the
network and establishes a connection between the network features that are
spatially disjointed. This is an integral part of performing tracing and analysis.
 A connection between a switch and a line is an example of connectivity
association.
 A connection between a fuse and an arrester that are not spatially coincident is
another example of a connectivity association
https://www.linkedin.com/in/dribrahimbathisk/
Utility Network – Vocabulary..
Container
 A container represents an assembly of network features that are normally shown
as a single feature on a map
 For example, an electrical switchgear container feature contains internal
switches, fuses, and a busbar, which are important for tracing analysis, but a map
showing all these internal features would be too dense. Network features inside a
container can be connected to features outside a container.
 Electrical substations and pumping stations are examples of container features.
Diagram view
 The diagram view shows a schematic view of your network.
 A diagram is a symbolic representation of features in a utility network with an
applied visualization technique.
 Diagrams can also show the results of a tracing analysis.
 At an electric utility, one type of diagram view is called a one-line diagram.
https://www.linkedin.com/in/dribrahimbathisk/
Utility Network - Structure network
https://www.linkedin.com/in/dribrahimbathisk/
Utility Network – Vocabulary..
Geometric coincidence
 When two or more features exist in the same x-, y-, and z-location, they are
geometrically coincident.
 Sometimes features can occupy the same x- and y-locations, such as devices
stacked on a pole.
 These features can be made to be not geometrically coincident by assigning z-
values.
Junction-edge connectivity rule
 A junction-edge connectivity rule is a type of connectivity rule that governs
which junction network features can be connected to endpoints or vertices of
line network features.
 A switch can be connected to the endpoint of a medium-voltage line.
https://www.linkedin.com/in/dribrahimbathisk/
Utility Network – Vocabulary..
Dirty areas
 Dirty areas mark modified features in a map that are out of date in the network
topology. Dirty areas are used as a visual cue to show which areas must be
validated to maintain the network topology.
 Dirty areas are cleared when the network topology is validated.
 A new medium-voltage line is constructed within the map and a new dirty area is
created that is visible around this feature.
Domain network
 A domain network is an industry-specific collection of feature classes such as
electric distribution or gas transmission.
 Sometimes a utility network will have two domain networks at the transmission
level and distribution level.
 A utility network can also have crossing domain networks, such as gas and
water, if they are both managed by that utility.
https://www.linkedin.com/in/dribrahimbathisk/
Utility Network – Vocabulary..
Map view
 The map view shows a cartographic display of your utility network.
 When edits are performed, dirty areas will appear on the map showing where the
network topology is not current.
Terminal
 Terminals model physical connections on a device. Not all devices require
terminals.
 Terminals are needed on a device type for three situations: when a device
transforms the resource (such as voltage or pressure) between the high side and
low side, when the flow of resource is asymmetric (such as a check valve), or
when there are three or more connections to a device.
 The use of terminals allows more realistic modeling of some devices and enables
more accurate data exchange to external analytic systems.
https://www.linkedin.com/in/dribrahimbathisk/

More Related Content

What's hot

Introduction to GIS
Introduction to GISIntroduction to GIS
Introduction to GIS
Uday kumar Devalla
 
Gis in telecomm ppt
Gis in telecomm pptGis in telecomm ppt
Gis in telecomm ppt
Atiqa khan
 

What's hot (20)

Geoprocessing
GeoprocessingGeoprocessing
Geoprocessing
 
Data input and transformation
Data input and transformationData input and transformation
Data input and transformation
 
Introduction to GIS
Introduction to GISIntroduction to GIS
Introduction to GIS
 
spatial data infrastructure : issues and concepts
spatial data infrastructure : issues and conceptsspatial data infrastructure : issues and concepts
spatial data infrastructure : issues and concepts
 
Network analysis in gis , part 4 transportation networks
Network analysis in gis , part 4 transportation networksNetwork analysis in gis , part 4 transportation networks
Network analysis in gis , part 4 transportation networks
 
TIN IN GIS
TIN IN GISTIN IN GIS
TIN IN GIS
 
Vector and Raster Data data model
Vector and Raster Data data modelVector and Raster Data data model
Vector and Raster Data data model
 
Network Analysis
Network AnalysisNetwork Analysis
Network Analysis
 
Future of GIS, Moving to the Enterprise Platform
Future of GIS, Moving to the Enterprise PlatformFuture of GIS, Moving to the Enterprise Platform
Future of GIS, Moving to the Enterprise Platform
 
DATA in GIS and DATA Query
DATA in GIS and DATA QueryDATA in GIS and DATA Query
DATA in GIS and DATA Query
 
Data base management system
Data base management systemData base management system
Data base management system
 
Geographic Information System for Egyptian Railway System(GIS)
Geographic Information System for Egyptian Railway System(GIS)Geographic Information System for Egyptian Railway System(GIS)
Geographic Information System for Egyptian Railway System(GIS)
 
Types of GIS Data
Types of GIS DataTypes of GIS Data
Types of GIS Data
 
Geographic information system
Geographic information systemGeographic information system
Geographic information system
 
QUERY AND NETWORK ANALYSIS IN GIS
QUERY AND NETWORK ANALYSIS IN GISQUERY AND NETWORK ANALYSIS IN GIS
QUERY AND NETWORK ANALYSIS IN GIS
 
DTM
DTMDTM
DTM
 
Application of GIS in Transportation Planning
Application of GIS in Transportation Planning Application of GIS in Transportation Planning
Application of GIS in Transportation Planning
 
Introduction to GIS
Introduction to GISIntroduction to GIS
Introduction to GIS
 
Internet GIS
Internet GISInternet GIS
Internet GIS
 
Gis in telecomm ppt
Gis in telecomm pptGis in telecomm ppt
Gis in telecomm ppt
 

Similar to Network analysis in gis , part 3 utility network

Smart Grid technicalDraw neat diagram for equivalent circuit of transformer.
Smart Grid technicalDraw neat diagram for equivalent circuit of transformer.Smart Grid technicalDraw neat diagram for equivalent circuit of transformer.
Smart Grid technicalDraw neat diagram for equivalent circuit of transformer.
pravingauda84
 
Volume 2-issue-6-2068-2072
Volume 2-issue-6-2068-2072Volume 2-issue-6-2068-2072
Volume 2-issue-6-2068-2072
Editor IJARCET
 
Volume 2-issue-6-2068-2072
Volume 2-issue-6-2068-2072Volume 2-issue-6-2068-2072
Volume 2-issue-6-2068-2072
Editor IJARCET
 

Similar to Network analysis in gis , part 3 utility network (20)

1720 1724
1720 17241720 1724
1720 1724
 
1720 1724
1720 17241720 1724
1720 1724
 
intelligent-management-of-electrical-systems-in-industries.docx
intelligent-management-of-electrical-systems-in-industries.docxintelligent-management-of-electrical-systems-in-industries.docx
intelligent-management-of-electrical-systems-in-industries.docx
 
IRJET- Study of Various Network Simulators
IRJET- Study of Various Network SimulatorsIRJET- Study of Various Network Simulators
IRJET- Study of Various Network Simulators
 
IRJET- Wifi based Smart Electric Meter using IoT
IRJET-  	  Wifi based Smart Electric Meter using IoTIRJET-  	  Wifi based Smart Electric Meter using IoT
IRJET- Wifi based Smart Electric Meter using IoT
 
"Performance Analysis of In-Network Caching in Content-Centric Advanced Meter...
"Performance Analysis of In-Network Caching in Content-Centric Advanced Meter..."Performance Analysis of In-Network Caching in Content-Centric Advanced Meter...
"Performance Analysis of In-Network Caching in Content-Centric Advanced Meter...
 
Inroduction to grid computing by gargi shankar verma
Inroduction to grid computing by gargi shankar vermaInroduction to grid computing by gargi shankar verma
Inroduction to grid computing by gargi shankar verma
 
Smart Grid technicalDraw neat diagram for equivalent circuit of transformer.
Smart Grid technicalDraw neat diagram for equivalent circuit of transformer.Smart Grid technicalDraw neat diagram for equivalent circuit of transformer.
Smart Grid technicalDraw neat diagram for equivalent circuit of transformer.
 
Applications Drive Secure Lightpath Creation Across Heterogeneous Domains
Applications Drive Secure Lightpath Creation Across Heterogeneous DomainsApplications Drive Secure Lightpath Creation Across Heterogeneous Domains
Applications Drive Secure Lightpath Creation Across Heterogeneous Domains
 
Results of simulation modeling of technical parameters of a multiservice network
Results of simulation modeling of technical parameters of a multiservice networkResults of simulation modeling of technical parameters of a multiservice network
Results of simulation modeling of technical parameters of a multiservice network
 
Wide area network in smart grid kundan
Wide area network in smart grid kundanWide area network in smart grid kundan
Wide area network in smart grid kundan
 
Smart grid communications
Smart grid communicationsSmart grid communications
Smart grid communications
 
The Agile Fractal Grid orchestrated by a platform of platforms
The Agile Fractal Grid  orchestrated by a platform of platformsThe Agile Fractal Grid  orchestrated by a platform of platforms
The Agile Fractal Grid orchestrated by a platform of platforms
 
IRJET- Internet of Things (IoT) based Smart Grid
IRJET- Internet of Things (IoT) based Smart GridIRJET- Internet of Things (IoT) based Smart Grid
IRJET- Internet of Things (IoT) based Smart Grid
 
The International Journal of Engineering and Science (The IJES)
The International Journal of Engineering and Science (The IJES)The International Journal of Engineering and Science (The IJES)
The International Journal of Engineering and Science (The IJES)
 
IRJET- Cost Effective Workflow Scheduling in Bigdata
IRJET-  	  Cost Effective Workflow Scheduling in BigdataIRJET-  	  Cost Effective Workflow Scheduling in Bigdata
IRJET- Cost Effective Workflow Scheduling in Bigdata
 
First Steps Toward Scientific Cyber-Security Experimentation in Wide-Area Cyb...
First Steps Toward Scientific Cyber-Security Experimentation in Wide-Area Cyb...First Steps Toward Scientific Cyber-Security Experimentation in Wide-Area Cyb...
First Steps Toward Scientific Cyber-Security Experimentation in Wide-Area Cyb...
 
IJSRED-V1I1P5
IJSRED-V1I1P5IJSRED-V1I1P5
IJSRED-V1I1P5
 
Volume 2-issue-6-2068-2072
Volume 2-issue-6-2068-2072Volume 2-issue-6-2068-2072
Volume 2-issue-6-2068-2072
 
Volume 2-issue-6-2068-2072
Volume 2-issue-6-2068-2072Volume 2-issue-6-2068-2072
Volume 2-issue-6-2068-2072
 

Recently uploaded

Recently uploaded (20)

Synthetic Fiber Construction in lab .pptx
Synthetic Fiber Construction in lab .pptxSynthetic Fiber Construction in lab .pptx
Synthetic Fiber Construction in lab .pptx
 
Phrasal Verbs.XXXXXXXXXXXXXXXXXXXXXXXXXX
Phrasal Verbs.XXXXXXXXXXXXXXXXXXXXXXXXXXPhrasal Verbs.XXXXXXXXXXXXXXXXXXXXXXXXXX
Phrasal Verbs.XXXXXXXXXXXXXXXXXXXXXXXXXX
 
Danh sách HSG Bộ môn cấp trường - Cấp THPT.pdf
Danh sách HSG Bộ môn cấp trường - Cấp THPT.pdfDanh sách HSG Bộ môn cấp trường - Cấp THPT.pdf
Danh sách HSG Bộ môn cấp trường - Cấp THPT.pdf
 
Basic phrases for greeting and assisting costumers
Basic phrases for greeting and assisting costumersBasic phrases for greeting and assisting costumers
Basic phrases for greeting and assisting costumers
 
GIÁO ÁN DẠY THÊM (KẾ HOẠCH BÀI BUỔI 2) - TIẾNG ANH 8 GLOBAL SUCCESS (2 CỘT) N...
GIÁO ÁN DẠY THÊM (KẾ HOẠCH BÀI BUỔI 2) - TIẾNG ANH 8 GLOBAL SUCCESS (2 CỘT) N...GIÁO ÁN DẠY THÊM (KẾ HOẠCH BÀI BUỔI 2) - TIẾNG ANH 8 GLOBAL SUCCESS (2 CỘT) N...
GIÁO ÁN DẠY THÊM (KẾ HOẠCH BÀI BUỔI 2) - TIẾNG ANH 8 GLOBAL SUCCESS (2 CỘT) N...
 
Salient features of Environment protection Act 1986.pptx
Salient features of Environment protection Act 1986.pptxSalient features of Environment protection Act 1986.pptx
Salient features of Environment protection Act 1986.pptx
 
Benefits and Challenges of Using Open Educational Resources
Benefits and Challenges of Using Open Educational ResourcesBenefits and Challenges of Using Open Educational Resources
Benefits and Challenges of Using Open Educational Resources
 
Overview on Edible Vaccine: Pros & Cons with Mechanism
Overview on Edible Vaccine: Pros & Cons with MechanismOverview on Edible Vaccine: Pros & Cons with Mechanism
Overview on Edible Vaccine: Pros & Cons with Mechanism
 
Supporting (UKRI) OA monographs at Salford.pptx
Supporting (UKRI) OA monographs at Salford.pptxSupporting (UKRI) OA monographs at Salford.pptx
Supporting (UKRI) OA monographs at Salford.pptx
 
Students, digital devices and success - Andreas Schleicher - 27 May 2024..pptx
Students, digital devices and success - Andreas Schleicher - 27 May 2024..pptxStudents, digital devices and success - Andreas Schleicher - 27 May 2024..pptx
Students, digital devices and success - Andreas Schleicher - 27 May 2024..pptx
 
Sha'Carri Richardson Presentation 202345
Sha'Carri Richardson Presentation 202345Sha'Carri Richardson Presentation 202345
Sha'Carri Richardson Presentation 202345
 
Basic Civil Engineering Notes of Chapter-6, Topic- Ecosystem, Biodiversity G...
Basic Civil Engineering Notes of Chapter-6,  Topic- Ecosystem, Biodiversity G...Basic Civil Engineering Notes of Chapter-6,  Topic- Ecosystem, Biodiversity G...
Basic Civil Engineering Notes of Chapter-6, Topic- Ecosystem, Biodiversity G...
 
Welcome to TechSoup New Member Orientation and Q&A (May 2024).pdf
Welcome to TechSoup   New Member Orientation and Q&A (May 2024).pdfWelcome to TechSoup   New Member Orientation and Q&A (May 2024).pdf
Welcome to TechSoup New Member Orientation and Q&A (May 2024).pdf
 
NLC-2024-Orientation-for-RO-SDO (1).pptx
NLC-2024-Orientation-for-RO-SDO (1).pptxNLC-2024-Orientation-for-RO-SDO (1).pptx
NLC-2024-Orientation-for-RO-SDO (1).pptx
 
aaaaaaaaaaaaaaaaaaaaaaaaaaaaaaaaaaaaaaaaaaaaaaaaaaaaaaa
aaaaaaaaaaaaaaaaaaaaaaaaaaaaaaaaaaaaaaaaaaaaaaaaaaaaaaaaaaaaaaaaaaaaaaaaaaaaaaaaaaaaaaaaaaaaaaaaaaaaaaaaaaaaaa
aaaaaaaaaaaaaaaaaaaaaaaaaaaaaaaaaaaaaaaaaaaaaaaaaaaaaaa
 
Palestine last event orientationfvgnh .pptx
Palestine last event orientationfvgnh .pptxPalestine last event orientationfvgnh .pptx
Palestine last event orientationfvgnh .pptx
 
B.ed spl. HI pdusu exam paper-2023-24.pdf
B.ed spl. HI pdusu exam paper-2023-24.pdfB.ed spl. HI pdusu exam paper-2023-24.pdf
B.ed spl. HI pdusu exam paper-2023-24.pdf
 
NCERT Solutions Power Sharing Class 10 Notes pdf
NCERT Solutions Power Sharing Class 10 Notes pdfNCERT Solutions Power Sharing Class 10 Notes pdf
NCERT Solutions Power Sharing Class 10 Notes pdf
 
Chapter 3 - Islamic Banking Products and Services.pptx
Chapter 3 - Islamic Banking Products and Services.pptxChapter 3 - Islamic Banking Products and Services.pptx
Chapter 3 - Islamic Banking Products and Services.pptx
 
1.4 modern child centered education - mahatma gandhi-2.pptx
1.4 modern child centered education - mahatma gandhi-2.pptx1.4 modern child centered education - mahatma gandhi-2.pptx
1.4 modern child centered education - mahatma gandhi-2.pptx
 

Network analysis in gis , part 3 utility network

  • 1. Part 3 Utility Network Dr. IBRAHIM BATHIS K https://www.linkedin.com/in/dribrahimbathisk/ https://www.linkedin.com/in/dribrahimbathisk/
  • 3. Utility Network (ESRI) Utility, Pipeline, and Telecommunications  The utility network is the main component users will work with when managing utility and telecom networks within ArcGIS.  The common thread in these challenges is the network's relationship to location. Where are customers, sensors, meters, workers, and waste? -- That's where GIS comes in. https://www.linkedin.com/in/dribrahimbathisk/
  • 4. Utility Network  The utility network combined with a transaction model, attribute rules, editing tools, and more allows users to completely model and analyze their complex network systems for water, gas, electric, telecom, sewer, stormwater, and other utilities.  The capabilities to manage and analyze network data will be delivered through the ArcGIS Utility Network Management extension to ArcGIS Enterprise.  The extension, which includes the utility network, provides the ability to access all capabilities through a services-based architecture callable from any device or application that supports web services. https://www.linkedin.com/in/dribrahimbathisk/
  • 5. Utility Network….  Knowing asset locations, their conditions, and their relationship to one another is fundamental to managing them.  But the GIS data was often kept from the people who needed it most: field workers, executives, managers, service technicians, and accountants.  Limited resources and increasingly complex networks Demands - Companies need a new wave of GIS-based network management with more functionality, added flexibility, and better access.  The Utility Network lets users create, manage, and share electric, water, wastewater, gas, district heating, and telecommunications asset data. https://www.linkedin.com/in/dribrahimbathisk/
  • 6. Utility Network  It is designed to model all of the components that make up your system- such as wires, pipes, valves, zones, devices, and circuits and allows you to build real world behavior into the features you model. With the utility network you can:  Create and edit features that model every type of utility equipment.  Discover how features in the network are connected.  Trace how resources, such as gas, water, and electricity, flow through the network.  Provide an operational view of how all the dynamic devices of your utility are presently configured.  Analyze how the network is affected by real world events like storms, outages, or equipment failure. https://www.linkedin.com/in/dribrahimbathisk/
  • 7. Utility Network  The utility network uses a services-based architecture which allows you to share and collaborate on it everywhere.  In command and dispatch centers, in design and engineering offices, on desktop and mobile devices, in the office, and in the field.  The utility network leverages the entire ArcGIS platform to create a seamless GIS system that presents an accurate and unified view on the status of your systems.  This information can be served from your portal and be made readily available on every device from desktop to smart phones. https://www.linkedin.com/in/dribrahimbathisk/
  • 9. Utility Network- Visualize your network https://www.linkedin.com/in/dribrahimbathisk/
  • 10. Utility Network- Visualize your network The utility network offers a number of different ways to view network system and assets:  View thematic cartographic maps for different use cases, such as customer service, field collection and inspection, or distribution management.  Create network diagrams that allow you to readily check network connectivity and create logical views of your network in a more simplified, symbolic representation of the information.  View inside complex assemblies of devices and lines and manage how assets are connected within them.  Visualize a selected pressure zone or circuit with a display filter.  Analyze your network https://www.linkedin.com/in/dribrahimbathisk/
  • 11. Utility Network- Analyze your network https://www.linkedin.com/in/dribrahimbathisk/
  • 12. Utility Network- Analyze your network The utility network has an array of analysis and tracing tools to support a large variety of analytic workflows:  Perform inspection of the network in the aftermath of an event such as a severe storm.  Determine the number of customers with access to your resource. For example, you can create a load summary report to present the number of customers being fed by specific circuit in an electric network.  Trace network features upstream or downstream from a given location. For example, water utilities can determine which valves to shut off when a pipe bursts.  Model multiple utility systems within one utility network and run tracing analysis across all of them. For example, an outage from an electrical network can affect the delivery of another resource such as gas or water. You can run a trace across all systems involved, see where the problems lie, and decide on the best course of action. https://www.linkedin.com/in/dribrahimbathisk/
  • 13. Utility Network- Benefits of a utility network  A utility network supports the requirements of utilities in delivering resources to customers safely, reliably, and economically.  It can serve as the system of record for the assets of a utility and provide information about the present state of the utility system.  Optimized for high performance and scalable to large utilities  Models how components of your system are connected  Represents dense areas of your system without map clutter  Represents dense areas of your system without map clutter  Enforces data integrity and reduces data entry errors  Enables advanced analysis of your network  Provides a comprehensive view of your network https://www.linkedin.com/in/dribrahimbathisk/
  • 14. Utility Network - Functionality  Flexibility: Users can edit the network data seamlessly via web services.  Asset connectivity: Users can mine the behavior of networks.  For example, the technology can simulate the connection of a pipe to a valve or a transformer to an electrical conductor.  This can be done automatically by placing the network elements at the same location or by specifying which objects are connected to each other.  Containment: Users can place objects or devices within structures, such as buildings or cabinets.  For example, the Utility Network can show the internal electrical connections of a substation inside the substation building or the internal gas piping configuration within a gas meter station building. https://www.linkedin.com/in/dribrahimbathisk/
  • 15. Utility Network – Functionality…  Attachment:  Users can model network element attachments, such as how a transformer or telephone cable is affixed to a pole.  Quality:  The technology leverages built-in, industry-standard rules that guard against users making data entry mistakes.  For example: Editors would not be allowed to connect a high- voltage cable to a low-voltage one.  Modeling:  Users can specify where sources of electricity, gas, or water are located to facilitate network simulation.  They can also model devices that have many connection points, such as complex switches and valves. https://www.linkedin.com/in/dribrahimbathisk/
  • 16. Utility Network – Advantages Increased productivity:  Users have access to shortcuts, templates, and streamlined workflows within the software. Tracing:  The technology contains extensive, out-of-the-box tracing tools. Visualization:  The Utility Network supports 3D. Schematics:  It has an assortment of built-in network diagrams and one-line tools (schematic representations of electric, water, and gas networks). Workflows:  The Utility Network helps users with editing, giving them guidance at every step of the process.  The technology continues to support the concept of long transactions as well, which enable users to create future changes to the network model that go into effect after a certain time. https://www.linkedin.com/in/dribrahimbathisk/
  • 17. Utility Network Utility Network toolbox • The Utility Network toolbox contains a number of tools that can be used to create and manage the utility network layer, subnetworks, associations, network topology, tracing, diagrams, and rules. • Some of these tools can also be opened from the Utility Network tab as described previously https://www.linkedin.com/in/dribrahimbathisk/
  • 18. Utility Network - Vocabulary Asset group  The asset group of a feature defines its broad classification.  The ASSETGROUP field for each network feature class is defined as the subtype field.  Further classification of features is added by assigning attribute domains at the subtype level on the ASSETTYPE field.  A transformer is an asset group of a transformer in an electric device network feature class. Asset type The asset type attribute of a feature defines a finer classification for each asset group in a network layer.  The ASSETTYPE field in a network layer is a text field linked to an attribute domain of values.  A power transformer is an asset type of a transformer in an electric device network feature class. https://www.linkedin.com/in/dribrahimbathisk/
  • 19. Utility Network – Vocabulary.. Associations Associations are created to associate features with one another.  A connectivity association specifies that a transformer is connected to a fuse.  A structural attachment association specifies that a capacitor is attached to a pole.  A containment association specifies that a vault can contain valves and pipes Association rules Association rules prevent an editor from adding logically invalid feature associations in a network. Association rules define the valid ways network features can be associated with each other.  Connectivity rule: A transformer can connect to a fuse.  Structural attachment rule: A capacitor can be attached to a pole.  Containment rule: A vault can contain valves and pipes. https://www.linkedin.com/in/dribrahimbathisk/
  • 20. Utility Network – Vocabulary.. Connectivity  Network features in a utility network can be connected to each other in two basic ways: either with a shared endpoint, vertex, or point (common x-, y-, and z- values), or with a defined connectivity association between two features that are not spatially coincident. This is called connectivity.  A pump placed at the end of a water pipe will have connectivity established because of the shared location. Connectivity association  A connectivity association allows the individual features to be represented in the network and establishes a connection between the network features that are spatially disjointed. This is an integral part of performing tracing and analysis.  A connection between a switch and a line is an example of connectivity association.  A connection between a fuse and an arrester that are not spatially coincident is another example of a connectivity association https://www.linkedin.com/in/dribrahimbathisk/
  • 21. Utility Network – Vocabulary.. Container  A container represents an assembly of network features that are normally shown as a single feature on a map  For example, an electrical switchgear container feature contains internal switches, fuses, and a busbar, which are important for tracing analysis, but a map showing all these internal features would be too dense. Network features inside a container can be connected to features outside a container.  Electrical substations and pumping stations are examples of container features. Diagram view  The diagram view shows a schematic view of your network.  A diagram is a symbolic representation of features in a utility network with an applied visualization technique.  Diagrams can also show the results of a tracing analysis.  At an electric utility, one type of diagram view is called a one-line diagram. https://www.linkedin.com/in/dribrahimbathisk/
  • 22. Utility Network - Structure network https://www.linkedin.com/in/dribrahimbathisk/
  • 23. Utility Network – Vocabulary.. Geometric coincidence  When two or more features exist in the same x-, y-, and z-location, they are geometrically coincident.  Sometimes features can occupy the same x- and y-locations, such as devices stacked on a pole.  These features can be made to be not geometrically coincident by assigning z- values. Junction-edge connectivity rule  A junction-edge connectivity rule is a type of connectivity rule that governs which junction network features can be connected to endpoints or vertices of line network features.  A switch can be connected to the endpoint of a medium-voltage line. https://www.linkedin.com/in/dribrahimbathisk/
  • 24. Utility Network – Vocabulary.. Dirty areas  Dirty areas mark modified features in a map that are out of date in the network topology. Dirty areas are used as a visual cue to show which areas must be validated to maintain the network topology.  Dirty areas are cleared when the network topology is validated.  A new medium-voltage line is constructed within the map and a new dirty area is created that is visible around this feature. Domain network  A domain network is an industry-specific collection of feature classes such as electric distribution or gas transmission.  Sometimes a utility network will have two domain networks at the transmission level and distribution level.  A utility network can also have crossing domain networks, such as gas and water, if they are both managed by that utility. https://www.linkedin.com/in/dribrahimbathisk/
  • 25. Utility Network – Vocabulary.. Map view  The map view shows a cartographic display of your utility network.  When edits are performed, dirty areas will appear on the map showing where the network topology is not current. Terminal  Terminals model physical connections on a device. Not all devices require terminals.  Terminals are needed on a device type for three situations: when a device transforms the resource (such as voltage or pressure) between the high side and low side, when the flow of resource is asymmetric (such as a check valve), or when there are three or more connections to a device.  The use of terminals allows more realistic modeling of some devices and enables more accurate data exchange to external analytic systems. https://www.linkedin.com/in/dribrahimbathisk/