Downloaded 244 times
![15
Computation
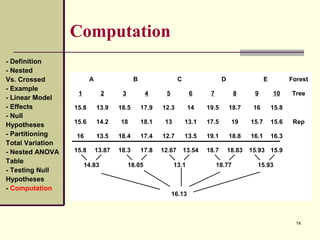
SSA = 2 x 3 [(16.13-14.83)2
+ (16.13-18.05)2
+ (16.13-13.1)2
+ (16.13-18.77)2
+ (16.13-15.93)2
]
= 129.28
SS(A)B = 3 [(15.8-14.83)2
+ (13.87-14.83)2
+ (18.3-18.05)2
+
(17.8-18.05)2
+ (12.67-13.1)2
+ (13.54-13.1)2
+
(18.7-18.77)2
+ (18.83-18.77)2
+ (15.93-15.93)2
+
(15.9-15.93)2
]
= 7.4
SSWerror = 4.01
TSS = 140.69
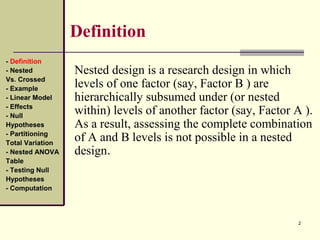
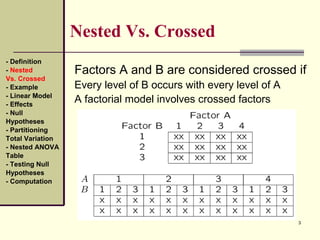
- Definition
- Nested
Vs. Crossed
- Example
- Linear Model
- Effects
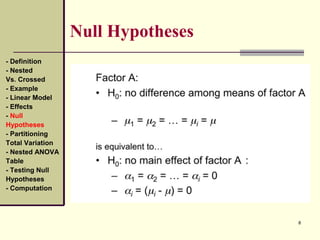
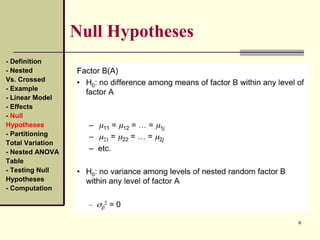
- Null
Hypotheses
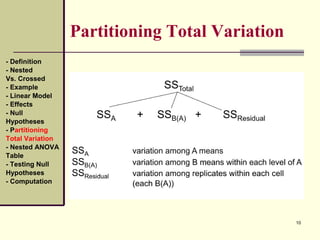
- Partitioning
Total Variation
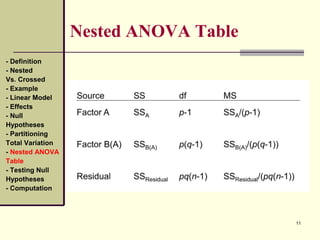
- Nested ANOVA
Table
- Testing Null
Hypotheses
- Computation](https://image.slidesharecdn.com/finalpresentation-150427092058-conversion-gate02/85/NESTED-DESIGNS-15-320.jpg)
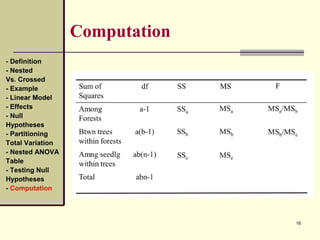
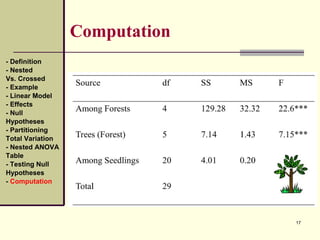

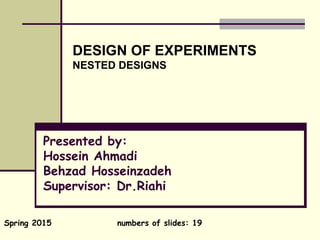
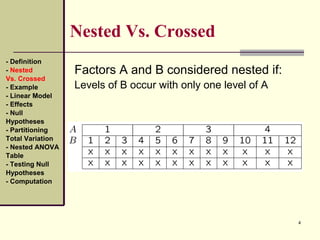
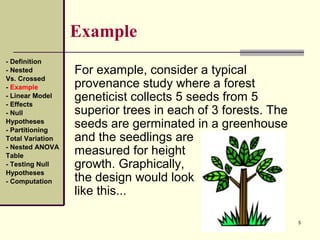
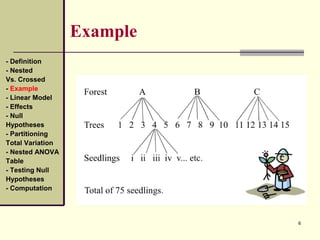
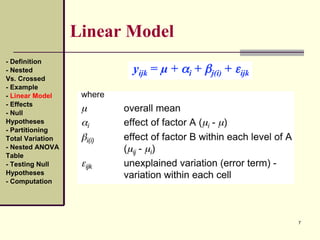
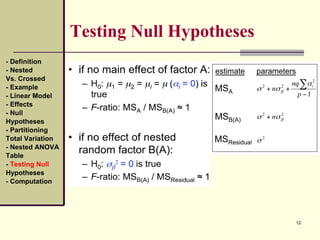
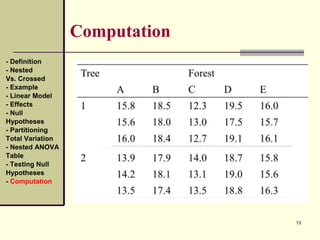
This document discusses nested designs in experiments. It defines nested designs as those where levels of one factor (B) are nested within or occur only with levels of another factor (A). An example is given of a forest genetics study measuring tree seedling height where seeds come from trees nested within different forests. The document outlines the linear model, effects, null hypotheses, partitioning variation, nested ANOVA table, testing hypotheses, and computations for a nested design.