Download to read offline


![k|fljlwsljZn]if0f
!_ahf/ ;f/f+z -sflt{s@%, @)&#;Ddsf]_
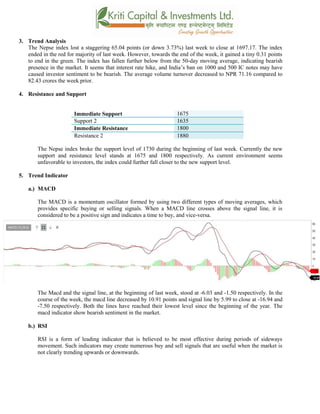
aGb cªs -sflt{s@%, @)&#_ !^(&=!&
pRr cªs -uPsf] ;ftf_ !&$(=!@
;fKtflxs kl/jt{g –^%=)$ -–#=&#k|ltzt_
b}lgscf};t Jofkf/ ¿=&!=!^s/f]8
s'n ;fKtflxsJofkf/ ¿ @*$=^$ s/f]8
cf/P;cfO{ @(=&^
PdP;L8L –!^=($
l;UgnnfO{g –&=%)
@_ ahf/ k|j[lt
Nepse (May 1, 2015 – November 10, 2016)](https://image.slidesharecdn.com/nepsetechnicalanalysisnovember6-november102016-161115065739/85/Nepse-technical-analysis-november-6-november-10-2016-5-320.jpg)
![#_ 6]«G8 ljZn]if0f
uPsf] ;ftfg]K;] kl/;"rsdf^%=)$cªssf] ef/L lu/fj6 b]lvof]h;sf] kmn:j?kahf/
!^(&=!&cªsdfaGbeof] .;ftfsf]clGtdlbg g]K;] kl/;"rsdflemgf] )=#!cªssf] a[l4 b]lvof] . cf};t
sf/f]af/ kl/df0fdfeg] *@=$#s/f]8af6&!=!^ s/f]8 dfcfPsf] cj:yf b]lvof] . g]K;] kl/;"rsclxn%)lbg]
d'leËPe/]heGbftncfPsf] cj:yfn] ahf/ clxn] k'/} laol/; 6]«G8 /x]sf] b']lvG5 . ahf/df b]lvPsf]
t/ntfsf] cefj / xfnef/t ;/sf/n] cfkmgf] !))) tyf %)) sf] gf]6df nfPsf] k|ltaGwn]
g]kfnLnufgLstf{ dfem ;d]t s]xLdgf]j}1flgs c;/ kf/]sf] b]lvG5 .
$_ 6]jftyfk|lt/f]w cªs
glhssf] 6]jfcªs !^&%
6]jfcªs @ !^#%
glhssf] k|lt/f]w cªs !*))
uPsf] ;ftf g]K;] kl/;"rsn] !&#) cªssf] 6]jfcªsnfO{ kf/ u/L tncfPsf] cj:yf /xof] . xfnsf] nflugofF
6]jfcªs !^&%tyfgofFk|lt/f]w cªs !*)) /x]sf] 5 . g]K;] kl/;"rsxfn %) lbg] d'leËPe/]h eGbftncfPsf]
cj:yfn] ahf/dflaol/; 6]«G8 /x]sf] b]lvG5 .
%_ g]K;] 6]«G8 ;"rs
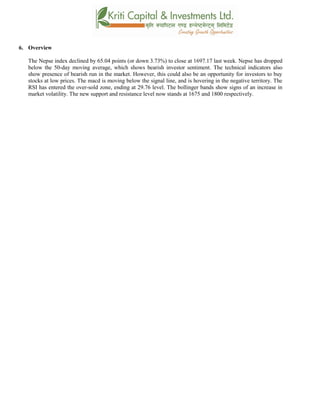
s_ d'leª Pe/]hsGeh]{G; 8fOeh]{G; -PdP;L8L_
PdP;L8Ldf b'O{ cf]6f /]vf x'G5g, h;df Pp6fn] ahf/sf] lbzf kl/jt{gsf] ;+s]t u5{ eg] csf]{n] ahf/sf]
k|j[lQ -6«]08_ b]vfpg] u5{ . olb PdP;L8L /]vfn] l;Ung /]vfnfO{ tnaf6 dfly sf6]dfo;nfO{ ;sf/fTds
;+s]tsf ?kdflnO{G5 / o;n] z]o/x? lsGg] ;+s]t ub{5 .
;ftfsf] z'?df PdP;L8L nfO{g tyfl;UgnnfO{g s|dzM–^=)#tyf–!=%)sf] l:yltdf /x]sf] lyof] .
PdP;L8LnfO{gtyfl;UgnnfO{gdfafFsLsflbgx?dflu/fj6 g} b]lvof] .xfnsf] nflu PdP;L8LnfO{g
tyfl;UgnnfO{g s|dz M –!^=($tyf&=%) /x]sf] 5 / PdP;L8L nfO{g l;UgnnfO{g eGbftncfO{ C0ffTds
If]qdf /x]sf] xF'bfahf/ laol/; l:yltdf b]lvG5 .](https://image.slidesharecdn.com/nepsetechnicalanalysisnovember6-november102016-161115065739/85/Nepse-technical-analysis-november-6-november-10-2016-6-320.jpg)
![v_ l/n]l6j :6«]Gy OG8]S; -cf/P;cfO{_
cf/P;cfO{ k|fljlwsljZn]if0fsf] o:tf] cf}hf/ xf], h;nfO{ Pstlkm{ ?kdfrln/x]sf] ahf/dfJofkf/ /0fgLlt
agfpg a9L pkof]uL dflgG5 . To;}u/L, o;n] ahf/dfvl/b / ljlqmsf] :ki6 ;+s]t b]vfpg] u5{ .
cf/P;cfO{uPsf] ;ftfsf] z'?df$!=)!cªsdf/x]sf] lyof]tyf ;ftfsf] cGTolt/ cf/P;cfO{ @(=&^cªsdf
/xof].#) cªseGbftnem/]sf] cf/P;cfO{n] cf]e/;f]N8 ahf/sf] l:Ylt b]vfp5 .](https://image.slidesharecdn.com/nepsetechnicalanalysisnovember6-november102016-161115065739/85/Nepse-technical-analysis-november-6-november-10-2016-7-320.jpg)
![u_ af]lnªu/ Aof08
af]lnªu/ Aof08 Ps k|fljlwsljZn]if0f ;"rsxf] h;df @!–lbg] d'leËPe/]hsf ;fyb'O{ Aof08 -Pp6f dfly_ /
Pp6f tn_ x'G5g . lo Aof08x?n] cl:y/tfsf] ;+s]t ub{5g, h'g :6fG88{ 8]leP;g u0fgf u/]/ kQfnufO{G5 .
g]K;] kl/;"rsuPsf] ;ftftNnf] Jof08 eGbftncfPsf]cj:yf /xof]h;n] ahf/ cf]e/ ;f]N8 l:yltdf /x]sf]
;+s]t ub{5 . pkNnf] tyftNnf] Jof08 aLrsf] b'/Ldf;d]t cfPsf] ab9f] b'/Ln]cl:yt/tfeg]] a9g] s|ddf /x]sf]
b]lvG5 .
;du{dfM
uPsf] ;ftf g]K;] kl/;"rsdf^%=)$cªssf] lu/fj6 b]lvof]h;sf] kmn:j?kahf/ !^(&=!&cªsdfaGbeof] .
clxn] %)lbg] d'leËPe/]heGbftncfPsf] kl/;"rsn] ahf/dflaol/; l:ylt /x]sf] b]lvG5 . PdP;L8LnfO{gdf
b]lvPsf] lu/fj6n] eg]a]Rg]xf]8afhLdf w]/} a[l4 ePsf]b]lvG5 . #)cªseGbftncfPsf] cf/P;cfO{n] ahf/ k'/}
a]Rg] l:ylt df /x]sf] ;+s]t ub{5 .pkNnf] tyftNnf] Jof08 aLrsf] b'/LdfcfPsf]a[l4n] ahf/sf] cl:y/tfeg]a9g]
s|ddf /x]sf] ;+s]t ub{5 .xfnsf] cj:yfdfgofF 6]jfcªstyfk|lt/f]w cªs s||dzM !^&%tyf !*)) sfod /x]sf]
5 .](https://image.slidesharecdn.com/nepsetechnicalanalysisnovember6-november102016-161115065739/85/Nepse-technical-analysis-november-6-november-10-2016-8-320.jpg)

- The Nepse index fell by 65.04 points (3.73%) last week to close at 1697.17 due to bearish sentiment from interest rate hikes and India's currency ban. - Technical indicators like MACD, RSI, and Bollinger bands show the market is in a bearish state with increased volatility. - The new support and resistance levels have been established at 1675 and 1800 respectively as the index broke below previous support of 1730.


